Breakthrough-Energy / PreREISE

Generate input data for scenario framework
https://breakthrough-energy.github.io/docs/
MIT License
21 stars 28 forks source link

feat: add local transmission capacity analysis function #279

Open danielolsen opened 2 years ago

danielolsen commented 2 years ago

Pull Request doc

Purpose

Add a helper function which can identify where local transmission capacity is insufficient to meet local power needs. This was designed around seeing whether local (radial or semi-radial) transmission capacity was sufficient to import enough power from the bulk (meshed) grid, but could easily be extended to ensure that local transmission capacity is sufficient to export power to the bulk grid.

What the code is doing

The user-facing function is identify_bottlenecks. It uses a branch dataframe to build a graph representing the transmission network, construct a block-cut tree of the biconnected components (see https://en.wikipedia.org/wiki/Biconnected_component#Block-cut_tree), and identify the largest biconnected component. These data structures are then passed to find_descendants, and the return is filtered to output all potential bottlenecks (the "all" key of the output dict), plus bottlenecks where demand is greater than capacity (the "constrained" key of the output dict).

find_descendants is a recursive function which starts from a parent node of a block-cut tree, optionally takes a grandparent node which indicates which direction is 'upstream', and calculates for each edge of the block-cut tree (between an articulation point and a block) whether the total branch capacity between the articulation point and the block is sufficient to meet all downstream demand. identify_bottlenecks passes the largest biconnected component as the root, and then find_descendants calculates the total demand downstream of each articulation point, by first calculating the total demand of the downstream block, etc. until it reaches the leaf nodes of the tree where there's nothing downstream, at which point the summation can start going back up the chain. Along the way back up, the set of all downstream nodes is built, and the local capacity between each articulation point and block.

Testing

A unit test is added, based around an example from Wikipedia's page on biconnected components, plus some arbitrary demands and capacities. image

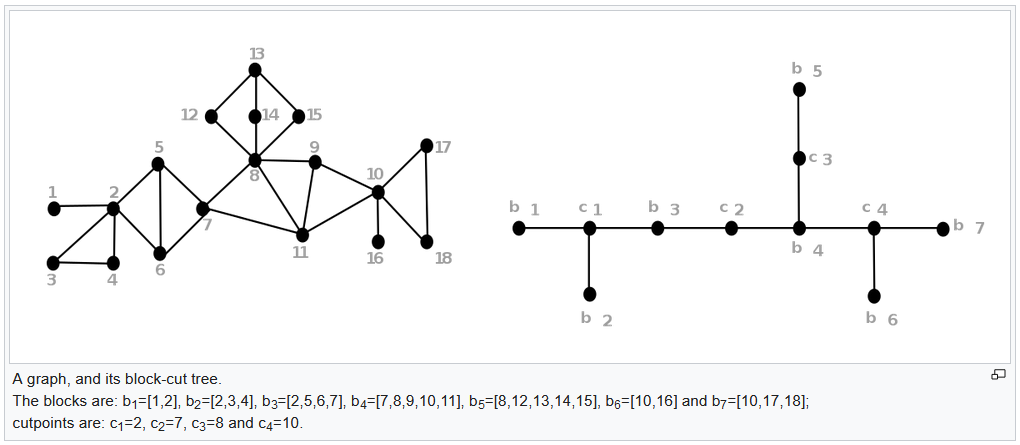
Usage Example/Visuals

from powersimdata import Scenario
from prereise.gather.griddata.hifld.data_process.topology import identify_bottlenecks
scenario = Scenario()
scenario.set_grid("usa_tamu", "Texas")
scenario.set_base_profile("demand", "vJan2021")
peak_demand = scenario.get_bus_demand().max()
branch = scenario.get_grid().branch.rename({"rateA": "capacity"}, axis=1)
bottlenecks = identify_bottlenecks(branch, peak_demand)

Time estimate

Figuring out the graph traversal logic was a pretty big headache, if I were coming at this fresh I would expect to take more than an hour to understand it. Maybe some of you have more of an intuitive feel for graph traversal algorithms though.

I'm leaving this as a draft PR for now, since this logic is ready for review but we will probably want some higher-level logic that uses the results of the identify_bottlenecks to aid in grid-building, besides just throwing warnings. That would require that we have demand profiles during grid-building though, which we currently don't have, so maybe we'll want to merge this now and wait for a follow-up later. I'm open to suggestions.

BainanXia commented 2 years ago

I like it! Thanks for the exploration with detailed explanation. A few comments from the design perspective which may or may not simplify the graph traversal logic due to complicated return structure:

def build_tree(): adj = {'b1': ['c1'], 'c1': ['b2', 'b3'], 'b2': [], 'b3': ['c2'], 'c2': ['b4'], 'b4': ['c3', 'c4'], 'c3': ['b5'], 'c4': ['b6', 'b7'] } root = TreeNode('b1', 1, 0) queue = [root] for q in queue: if q.name in adj and adj[q.name]: for ch in adj[q.name]: if 'b' in ch: node = TreeNode(ch, 1, 0) q.children.append(node) queue.append(node) else: node = TreeNode(ch, 0, len(adj[ch])) q.children.append(node) queue.append(node)
return root

root = build_tree()

def dfs(root): sub_tree_demand = root.demand for c in root.children: sub_tree_demand += dfs(c) if 'c' in root.name: root.demand = sub_tree_demand return sub_tree_demand

The code snippet above will give us following results:
```python
def helper(root):
    print(root.name, root.demand, root.capacity)
    for c in root.children:
        helper(c)
>>>helper(root)
b1 1 0
c1 6 2
b2 1 0
b3 1 0
c2 4 1
b4 1 0
c3 1 1
b5 1 0
c4 2 2
b6 1 0
b7 1 0

Finally, we can simply go through all articulation points (node name with 'c' in it in the example above) to see whether node.demand > node.capacity, i.e. the bottleneck. Not sure whether this is what we want here.

danielolsen commented 2 years ago

@BainanXia the bctree variable should be analogous to the tree as shown on the wikipedia page, where every block is compressed into a single node.

I'm not sure whether we can compress all of the graph information into nodes of the bctree representation, but we might be able to store them in the edges. If we look at the far-left part of the original graph, node 2 is an articulation point that could have three separate capacity constraints:

These correspond exactly to the three edges from the node 2 articulation point.

The current implementation could definitely be refactored to simplify it, especially if we don't care about keeping track of the set of descendants for each block/articulation point. I had been using that for debugging, and potentially it could be useful downstream of this function when we start to look at the problems and decide what to do about them, but doesn't seem to be strictly necessary just to look for capacity/demand mismatches.

BainanXia commented 2 years ago

@danielolsen What does the original structure of bctree look like? Is it a big biconnected-component -> a bunch of articulation points -> several small biconnected-components behind each articulation point? Or it could be deeper, similarly as the example above assuming b1 is the root, each small biconnected-component can have articulation point downstream as well.

In a general case, we should be able to evaluate every parent and child pair regardless of articulation point or block point, i.e. having demand attribute always store the total demand of the downstream subtree and capacity attribute with each edge instead, then checking throughout the graph for each pair: edge capacity between parent and child < child.demand.

I'm not sure I understand what you mean by keep track of the set of descendants for each block/articulation point. Does the bctree topology gives us that implicitly?

danielolsen commented 2 years ago

@BainanXia based on visualizing hifld/ERCOT, the tree can indeed be several layers deep, with downstream branch points as well (not just long radial blocks and articulations caused by long radial transmission lines in series). It probably only gets more complex in the larger interconnects.

I agree that we can store demand information for a node and all downstream nodes in any node of the BC Tree, and compare any node against its upstream edge.

The current output of identify_bottlenecks contains a key-value pair for each edge of the BC tree, e.g. (frozenset({2, 5, 6, 7}), 2): {'descendants': {1, 3, 4}, 'capacity': 0.44, 'demand': 1.0}. Currently, the descendants key says which nodes besides those explicitly identified in the edge are used to calculate the total demand that the edge needs to support. I agree that we could probably recover this information by re-parsing all of the keys/values to reconstruct the BC tree, but it seemed simple enough at the time to provide this to the user/upstream function, and potentially helpful for diagnosing root causes and designing solutions.

BainanXia commented 2 years ago

I see. If the desired info is the list of nodes within a block, probably we can put the keys/values used to construct the BC tree into a list and only use the corresponding index to label the node in the tree. In this way, we don't need to maintain that result data structure during recursion, which might be cleaner.

danielolsen commented 2 years ago

The desired info within the "descendants" sub-key is not just the list of nodes within a block, it's the list of all nodes within all blocks downstream of a given edge. I agree that the current BC-tree labeling is not very intuitive though, and depending on the downstream use-cases we may want to rearrange it.

BainanXia commented 2 years ago

Aha, I see. I didn't look into the data structure within descendants and just eyeball checking the test cases. If we want a list of all nodes within all blocks downstream of a given edge, then I don't know whether there is better data structures than a cumulative one.

I think it depends on how we would like to solve the problem after they are identified. If it is solved in a bottom-up way, i.e. starting from the edge of the network, if the violations of those "leaf" biconnected-components are resolved first, then for the upper level bottlenecks, we only need to get local problem solved, i.e. only the total demand behind an edge matters.

Is there an example in which case we will need the individual node info within a downstream block (rather than the one directly connected) to fix the edge capacity? Or we are also thinking of modifying the way we distribute load, i.e. Pd, instead?

danielolsen commented 2 years ago

I haven't figured out the 'what to do with the problems once we identify' step. If you've got ideas, I'm all ears!

Like you said, the simplest way is just to expand the line capacities at each constrained bottleneck, but maybe in some cases there's demand/generation that got connected to the wrong part of the network, and needs to be relocated. Once we're thinking about pushing power from a radial section back up to the bulk grid, something like plant.query("bus_id in @identified_downstream_buses") might be helpful for sanity checking.

BainanXia commented 2 years ago

I don't know either. One thought other than solutions is once we have load profiles by bus we can look at the peak hour in the downstream network instead of summation of peak demand for all the downstream buses, which will give us less violations and minimize the impact of whatever solution we carry out later.

We can run the same code for generation given the graph we build here is undirected :wink:.

danielolsen commented 2 years ago

I added the ability for the user to pass a zone demand profile, and get a report of transmission bottlenecks. Right now it's one giant massive printout, but you can get the idea by calling:

from prereise.gather.griddata.hifld import create_csvs
create_csvs(
    output_folder,
    wind_directory,
    year,
    nrel_email,
    nrel_api_key,
    zone_demand=YOUR_DEMAND_PROFILE,
)

or a little more directly:

from prereise.gather.griddata.hifld.data_process.topology import report_bottlenecks
from prereise.gather.griddata.hifld.orchestration import create_grid
full_tables = create_grid(output_folder)
report_bottlenecks(full_tables["branch"], full_tables["bus"], YOUR_DEMAND_PROFILE)

Once we generate the demand profile during grid-building, we can do the same sort of analysis and add a better user-facing report, maybe the number of constrained bottlenecks or something like that.

danielolsen commented 2 years ago

Thinking about this a bit more, maybe the better location for this is somewhere within prereise.gather.griddata.transmission rather than prereise.gather.griddata.hifld.data_process.topology, since it could be used for multiple different grids that we build?

BainanXia commented 2 years ago

Thinking about this a bit more, maybe the better location for this is somewhere within prereise.gather.griddata.transmission rather than prereise.gather.griddata.hifld.data_process.topology, since it could be used for multiple different grids that we build?

Yeah, it will be useful whenever we build a new grid/update existing grid with new data/resolve infeasibilities of a base case scenario of a future year, etc.