Stroke Prediction
(Note: You could Find Final Version in Main Branch, Master Branch is for editing and discussion)
Team member: Caihan Wang, Yifeng Tang, Jiajie Shen.
Description
We are going to create an application which could predict the stroke of patients, giving their Gender, Age, Hypertension, Heart Disease, Ever Married, Work Type, Residence Type, Avg. Glucose Level, BMI, Smoking Status.
Plan
For our data visualization part, we will include multiple informative graphs to illustrate the valuable information from our dataset: Percentage of people having strokes(in bar plot showing the percentage), Heart stroke and age, Heart stroke and Glucose, Heart stroke and weight, Gender risk for stroke, Hypertension Risk for stroke, Heart disease for stroke, Marriage and stroke, Lifestyle and stroke, Smoking and stroke, Correlation Map of features - How closely each of the features correlated. These graphs can help collaborators to understand the association between stroke and different variables.
For our model part, We are going to choose a model from logistic regression, Random Forest, Decision tree. The model packages could be imported from sklearn. We clean and split data with test data and train data. After training model, We do the model diagnose by test data with statistical methods to find the most accurate one to adjust for our data. We save the best model and create a function with this model to predict the stroke status of patients. The input value of this function should be Gender, Age, Hypertension, Heart Disease, Ever Married, Work Type, Residence Type, Avg Glucose Level, BMI, Smoking Status. The output will be whether the patient has high probability to have stroke. Then we test the availabilty of the function. If there is no problem, we can wrap up the function with a interface.
For interface, we are going to build a simple user_interface that could present a good experience for users when they use our small application. It should include all the avaliable input values, so that the users could select the values that could most accurately describe their status, including selection bars for categorized values and input value lines for numeric values. Moreover, adding valid ranges for numeric values would be prefer. Meanwhile, we are going to add some special things could reflect our interests, to make this small apllication more unique.
Instruction
To run the application, you should put the "healthcare-dataset-stroke-data.csv", "Model1.pkl", "Stroke_Prrediction.py", "test_Stroke_Prediction.py", "ModelSelection.py", "created.png", "Duke_Chapel.png", "duke.png", "data_visualization.py" into one folder. Also, you need install all the packages in "requirement.txt"
Run "Stroke_Prediction.py", the user interface will show. You can choose and fill in some data in the interface, it will output the predicted result.
All these graphs in the main branch are Percentage plot, hypertension risk, heart disease risk, heart stroke and age, heart stroke and weight, gender risk, heart stroke and glutose which are all the graphs generated by “data_visualization.py”
Architecture
We used "healthcare-dataset-stroke-data.csv", which cited from Kaggle. We used the data to train sklearning models and predict the stroke status of patients. The whole process included data visualization, model selection, and user interface.
Data Visulization
In this part of project, we will first load our dataset "healthcare-dataset-stroke-data.csv" by using pandas. Then we will do some data visualization upon some variables in order to see the assocaition between variables and heart stroke. I have generated 7 plots which are the Percentage plot, hypertension risk, heart disease risk, heart stroke and age, heart stroke and weight, gender risk, heart stroke and glutose. These graphs really help us to understand which variables have a strong association with heart stroke and it is helpful for us to build up the prediction model.
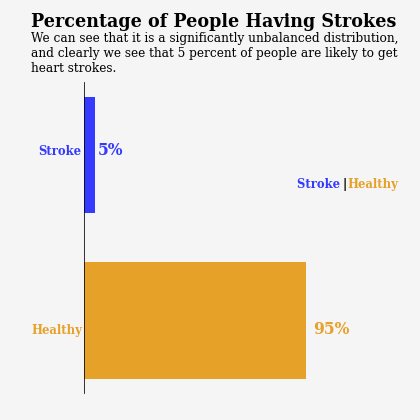
The first graph above is about the percentage of people have strokes and people do not have strokes. From the graph, we can easily see that it is a significantly unbalanced distribution, and clearly we see that 5 percent of people from dataset are likely to get heart strokes.
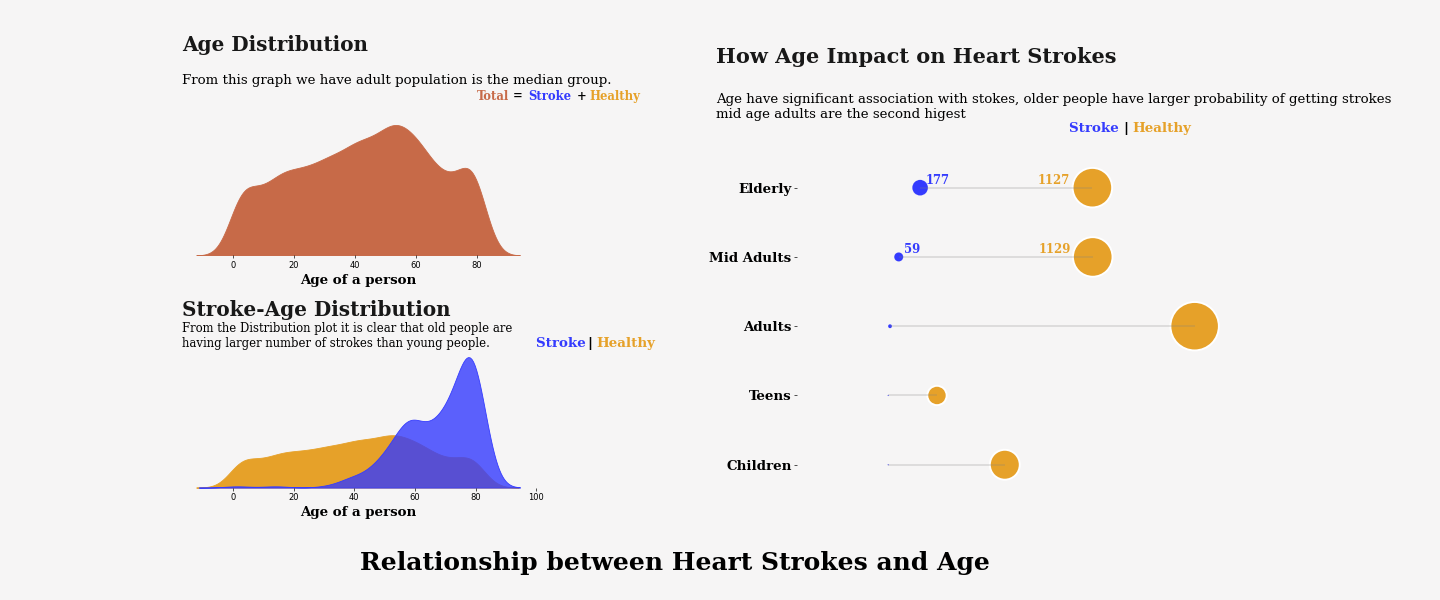
The second graph above is about Relationship between Heart Strokes and Age. From the graph we can conclude that Age have significant association with stokes, older people have larger probability of getting strokes while the mid age adults are the second higest.
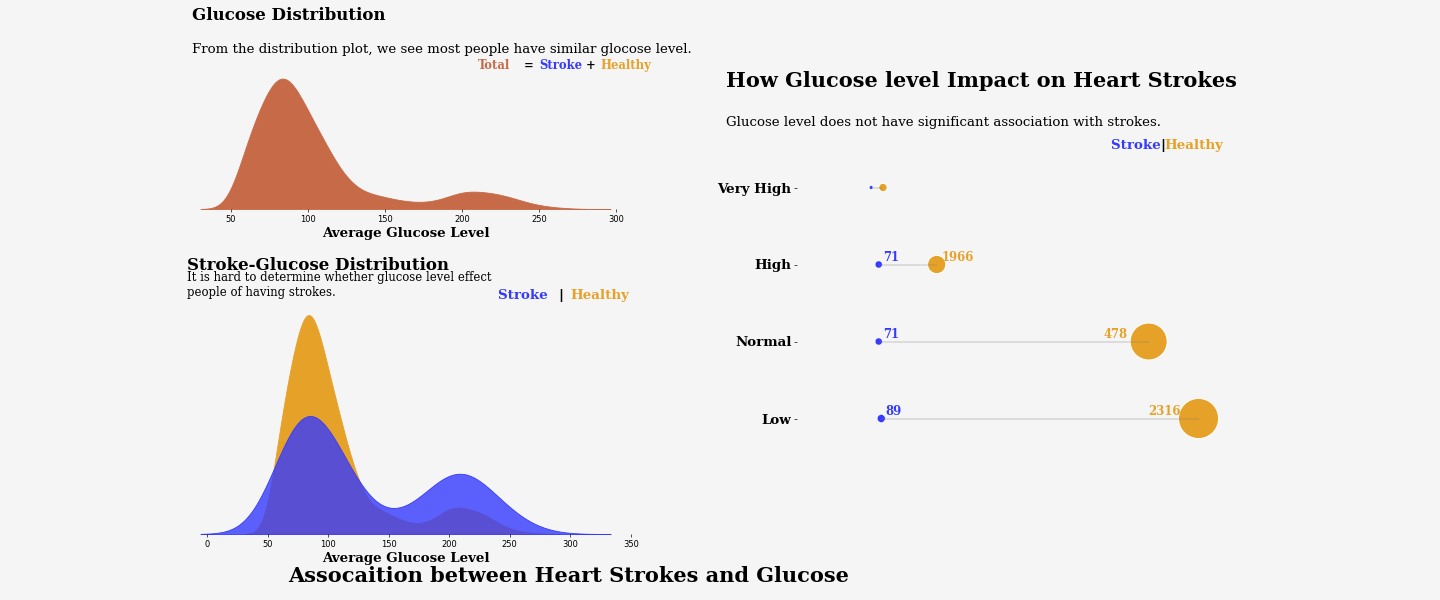
The third graph above is about Assocaition between Heart Strokes and Glucose. From the graph, we conclude that Glucose level does not have significant association with heart strokes.
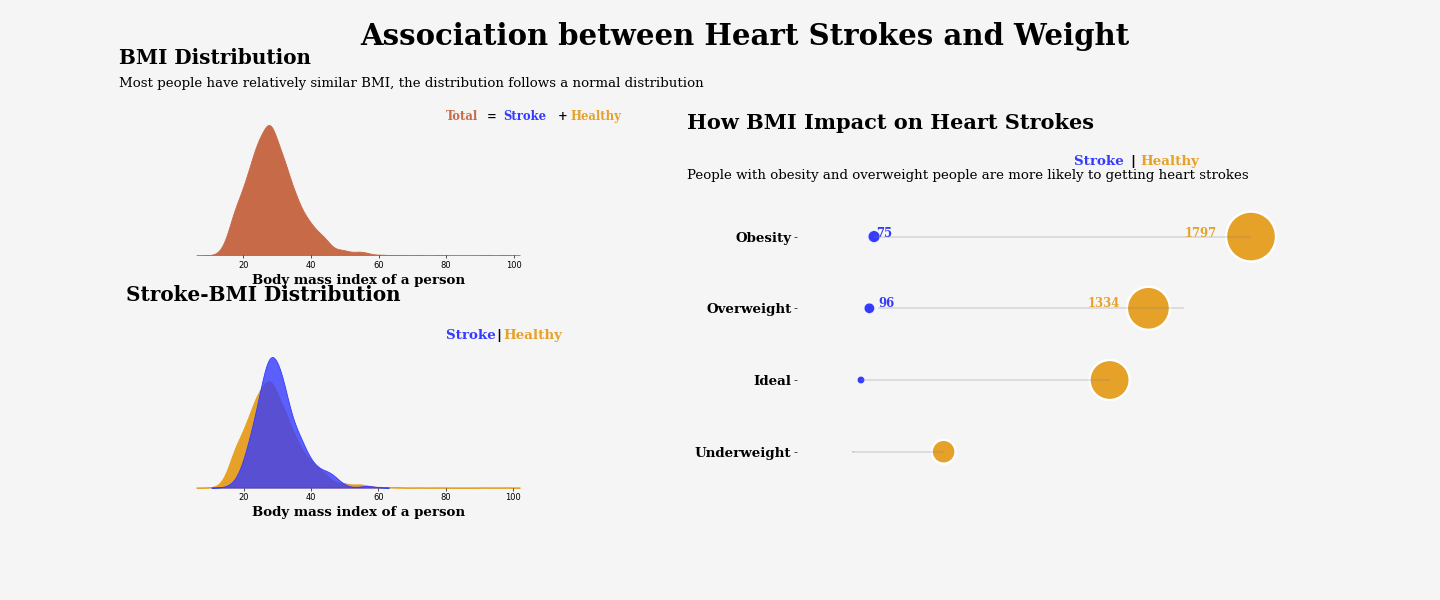
This graph above is about Association between Heart Strokes and Weight. And from the graph we can conclude people with obesity and overweight people are more likely to getting heart strokes.
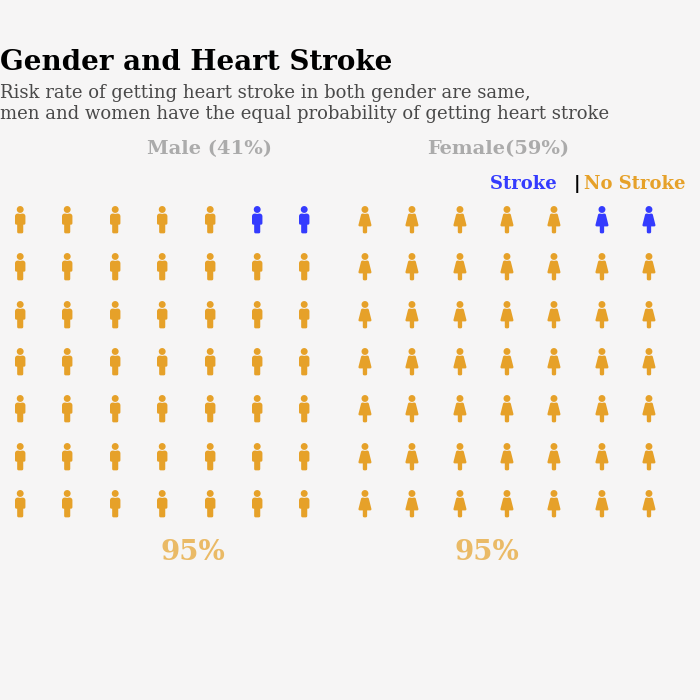
This graph above is about the Association between gender and heart stroke. From the graph we conclude Risk rate of getting heart stroke in both gender are same, men and women have the equal probability of getting heart stroke
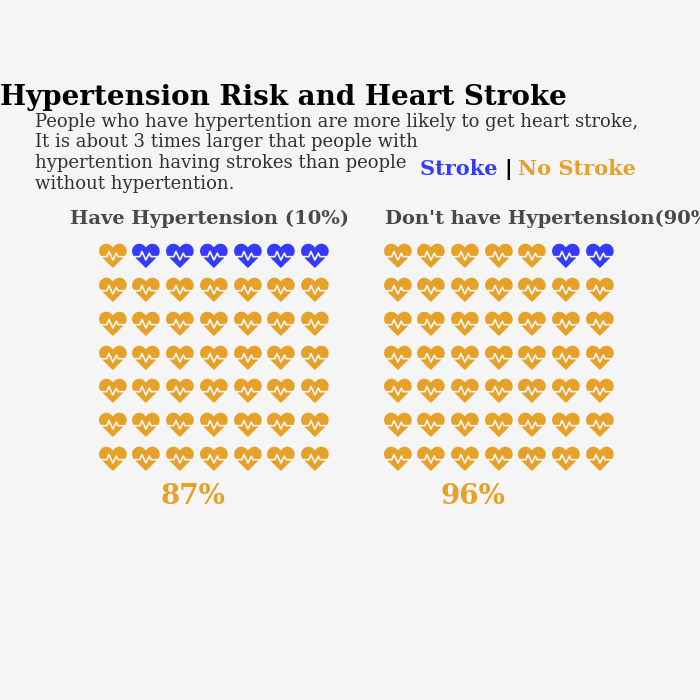
This graph above is about the association between Hypertension Risk and Heart Stroke. From the graph we conclude people who have hypertention are more likely to get heart stroke, It is about 3 times larger that people with hypertention having strokes than people without hypertention.
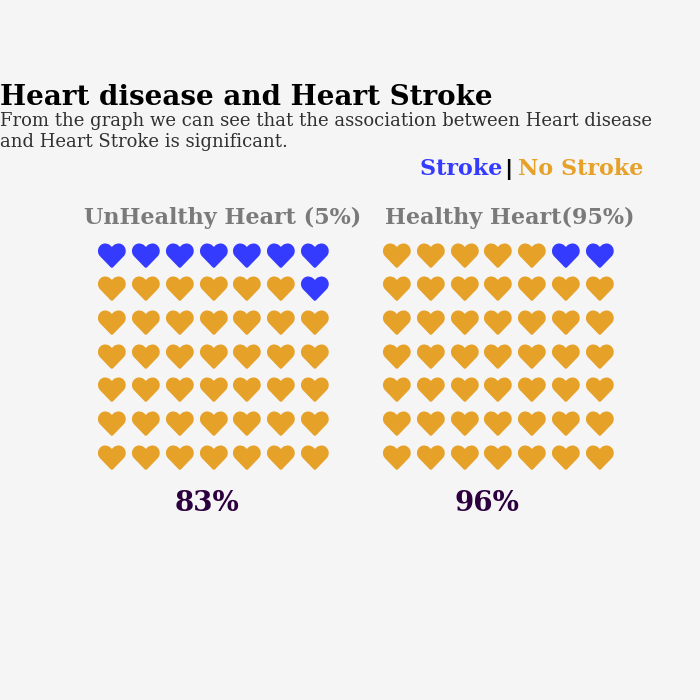
The last graph above is about the association between Heart disease and Heart Stroke. By looking at the graph we conclude that association between Heart disease and Heart Stroke is significant.
Model Selection and Function
Firstly, we read and cleaned the data by removing all NA in BMI. In order to fit the model, we converted all the strings like ['Yes', 'No'] to [1, 0] and created dummy variables to form a new table.
Secondly, for data preprocessiong, we found that the cleaned data are extremely unbalanced, because 4700 people were not stroke but 209 people were stroke in the data. If we use this data to fit the models, models will be extremely skewed to the 'Not Stroke'. Therefore, to get an accurate prediction model, we chose to decrease the sample size to a balanced one by randomly select 209 people from people who are not stroke. After that, our data was formed by 209 people who were stroke and 209 people who were not stroke. Then, we splitted the data to test data and train data.
Thirdly, we imported model functions from sklearn, and chose to fit 3 models, including logistic regression model, random forest and decision tree. To diagnose models, we also created a funtion named 'model_diagnosis'. After fitting, we could see that for logistic regression, the accuracy was 0.80 and the F1 score was 0.80. For random forest, the accuracy was 0.76 and the F1 score was 0.76. For decision treee, the accuracy was 0.71 and the F1 score was 0.72. Since logistic regression had the highest accuracy score and F1 score, so we chose to use Logistic Regression model and saved it as 'Model1.pkl'.
At last, we created a function named 'Predict'. The input value should be a list including the patient's gender, age, hypertension, heart_disease, ever_married, work_type, Residence_type, avg_glucose_level, bmi and smorking_status. We imported 'Model1.pkl' in the function to predict the stroke status.
User Interface
The stroke prediction user-interface has three windows:
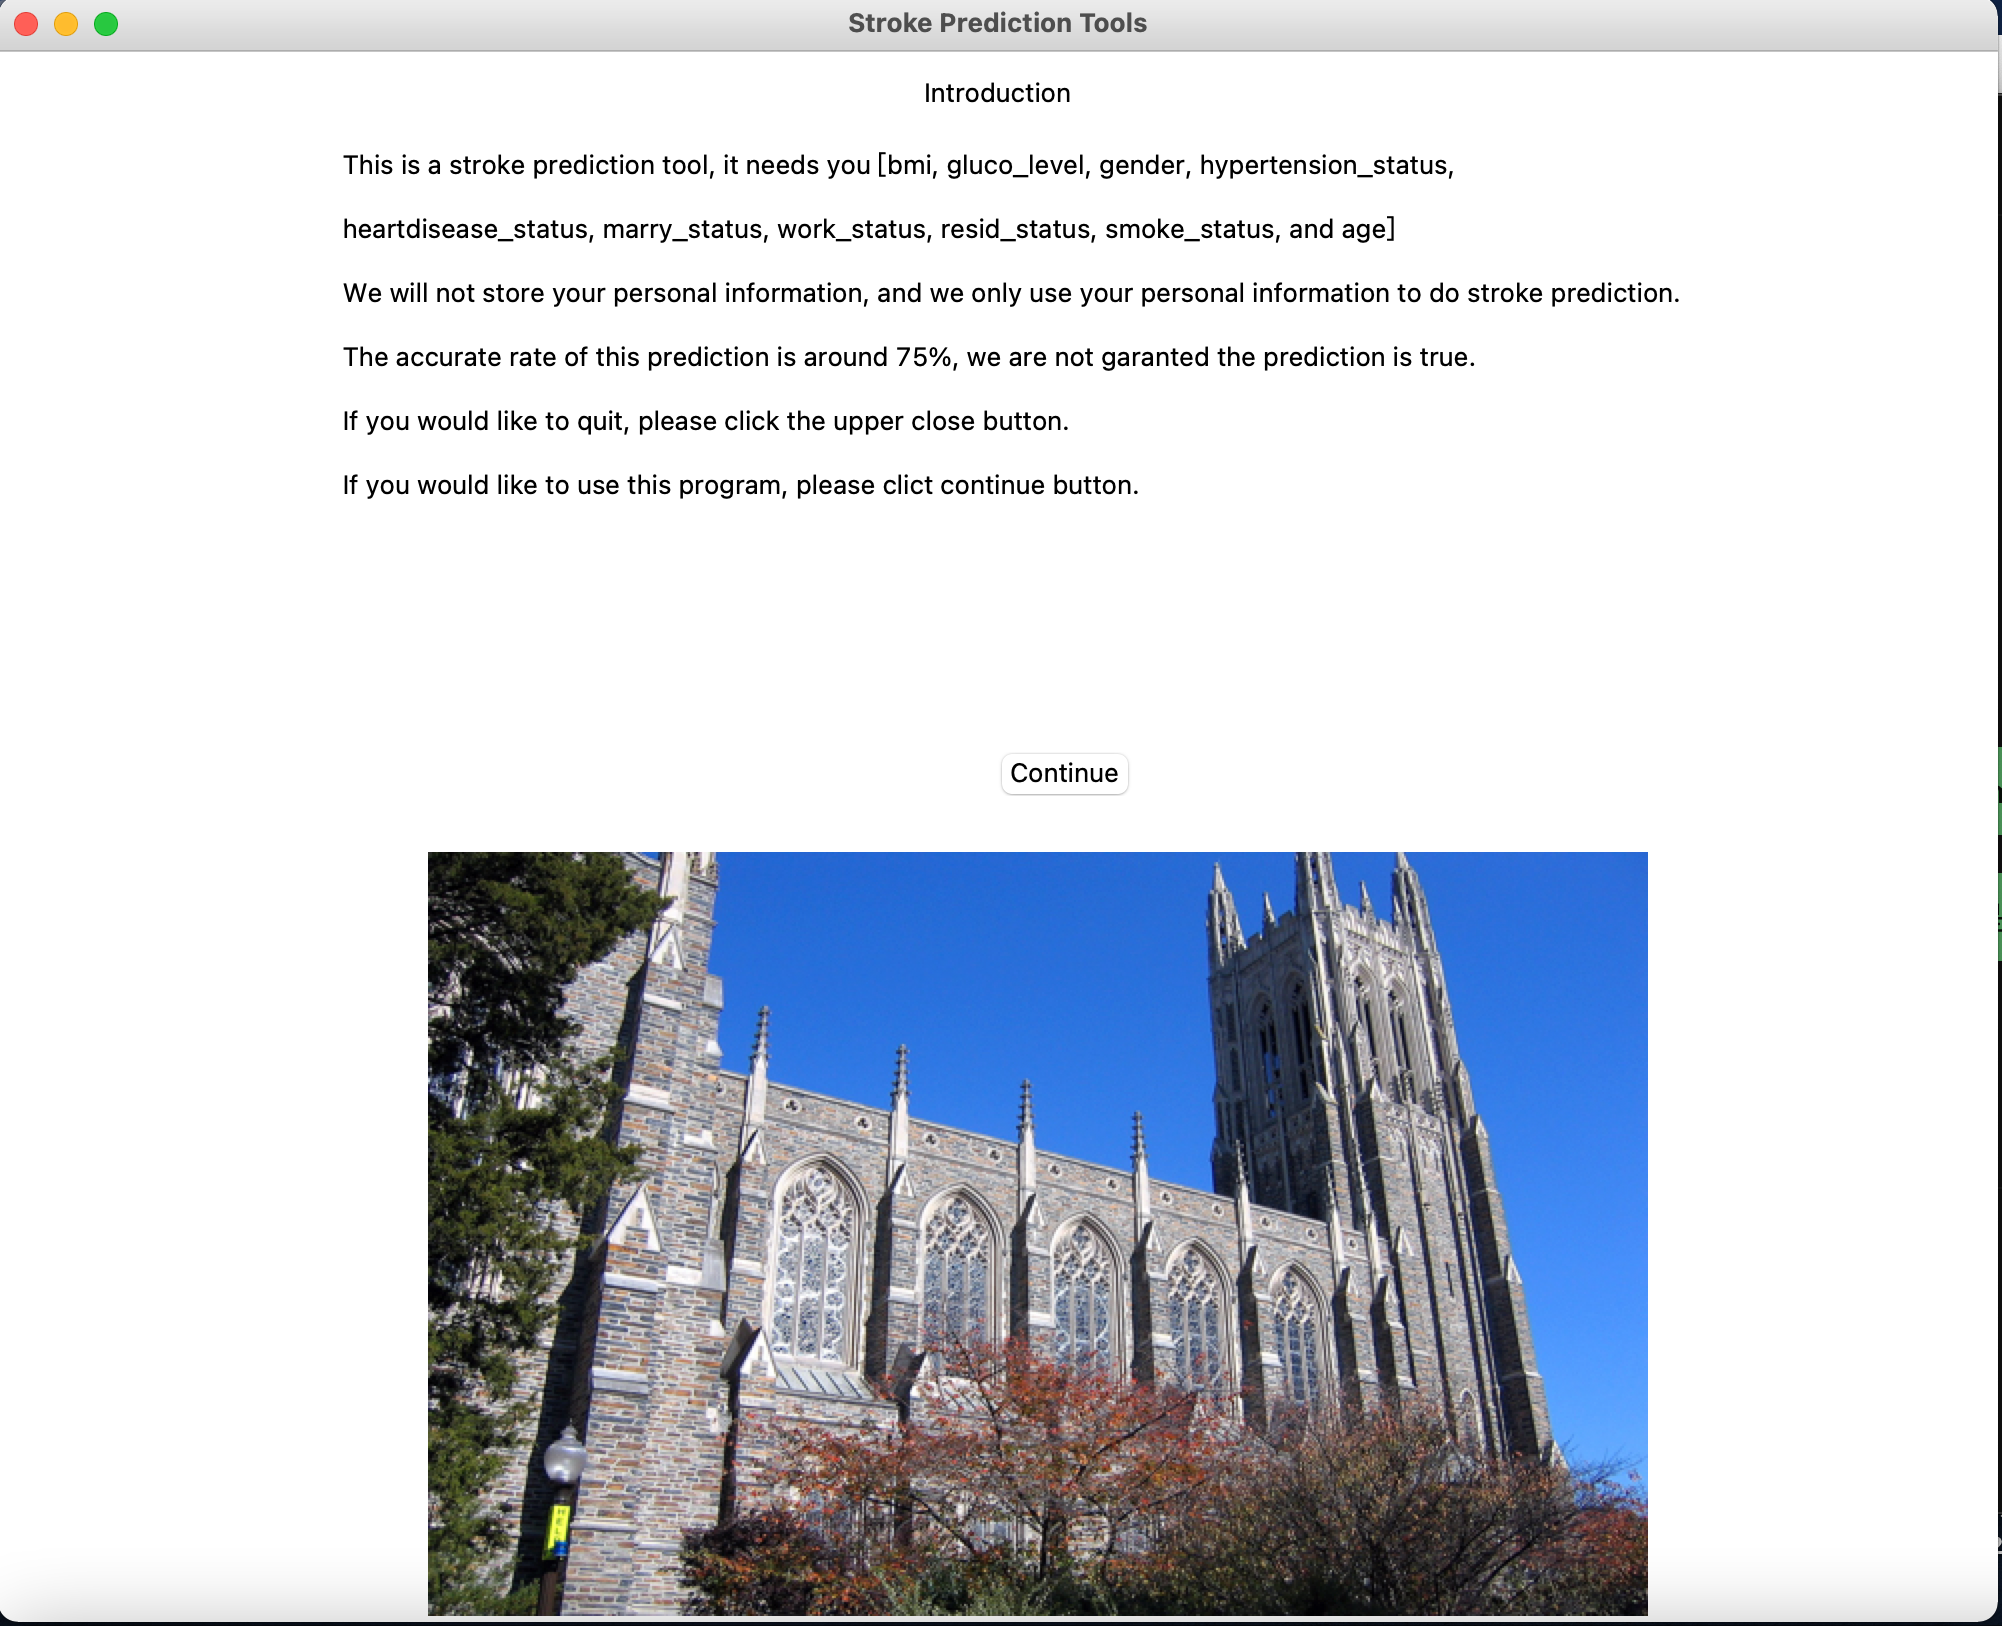
- Initial-introduction window
- Main window (includes input boxes)
- Result window
Initial-introduction window includes basic information of this tool and disclaimer.
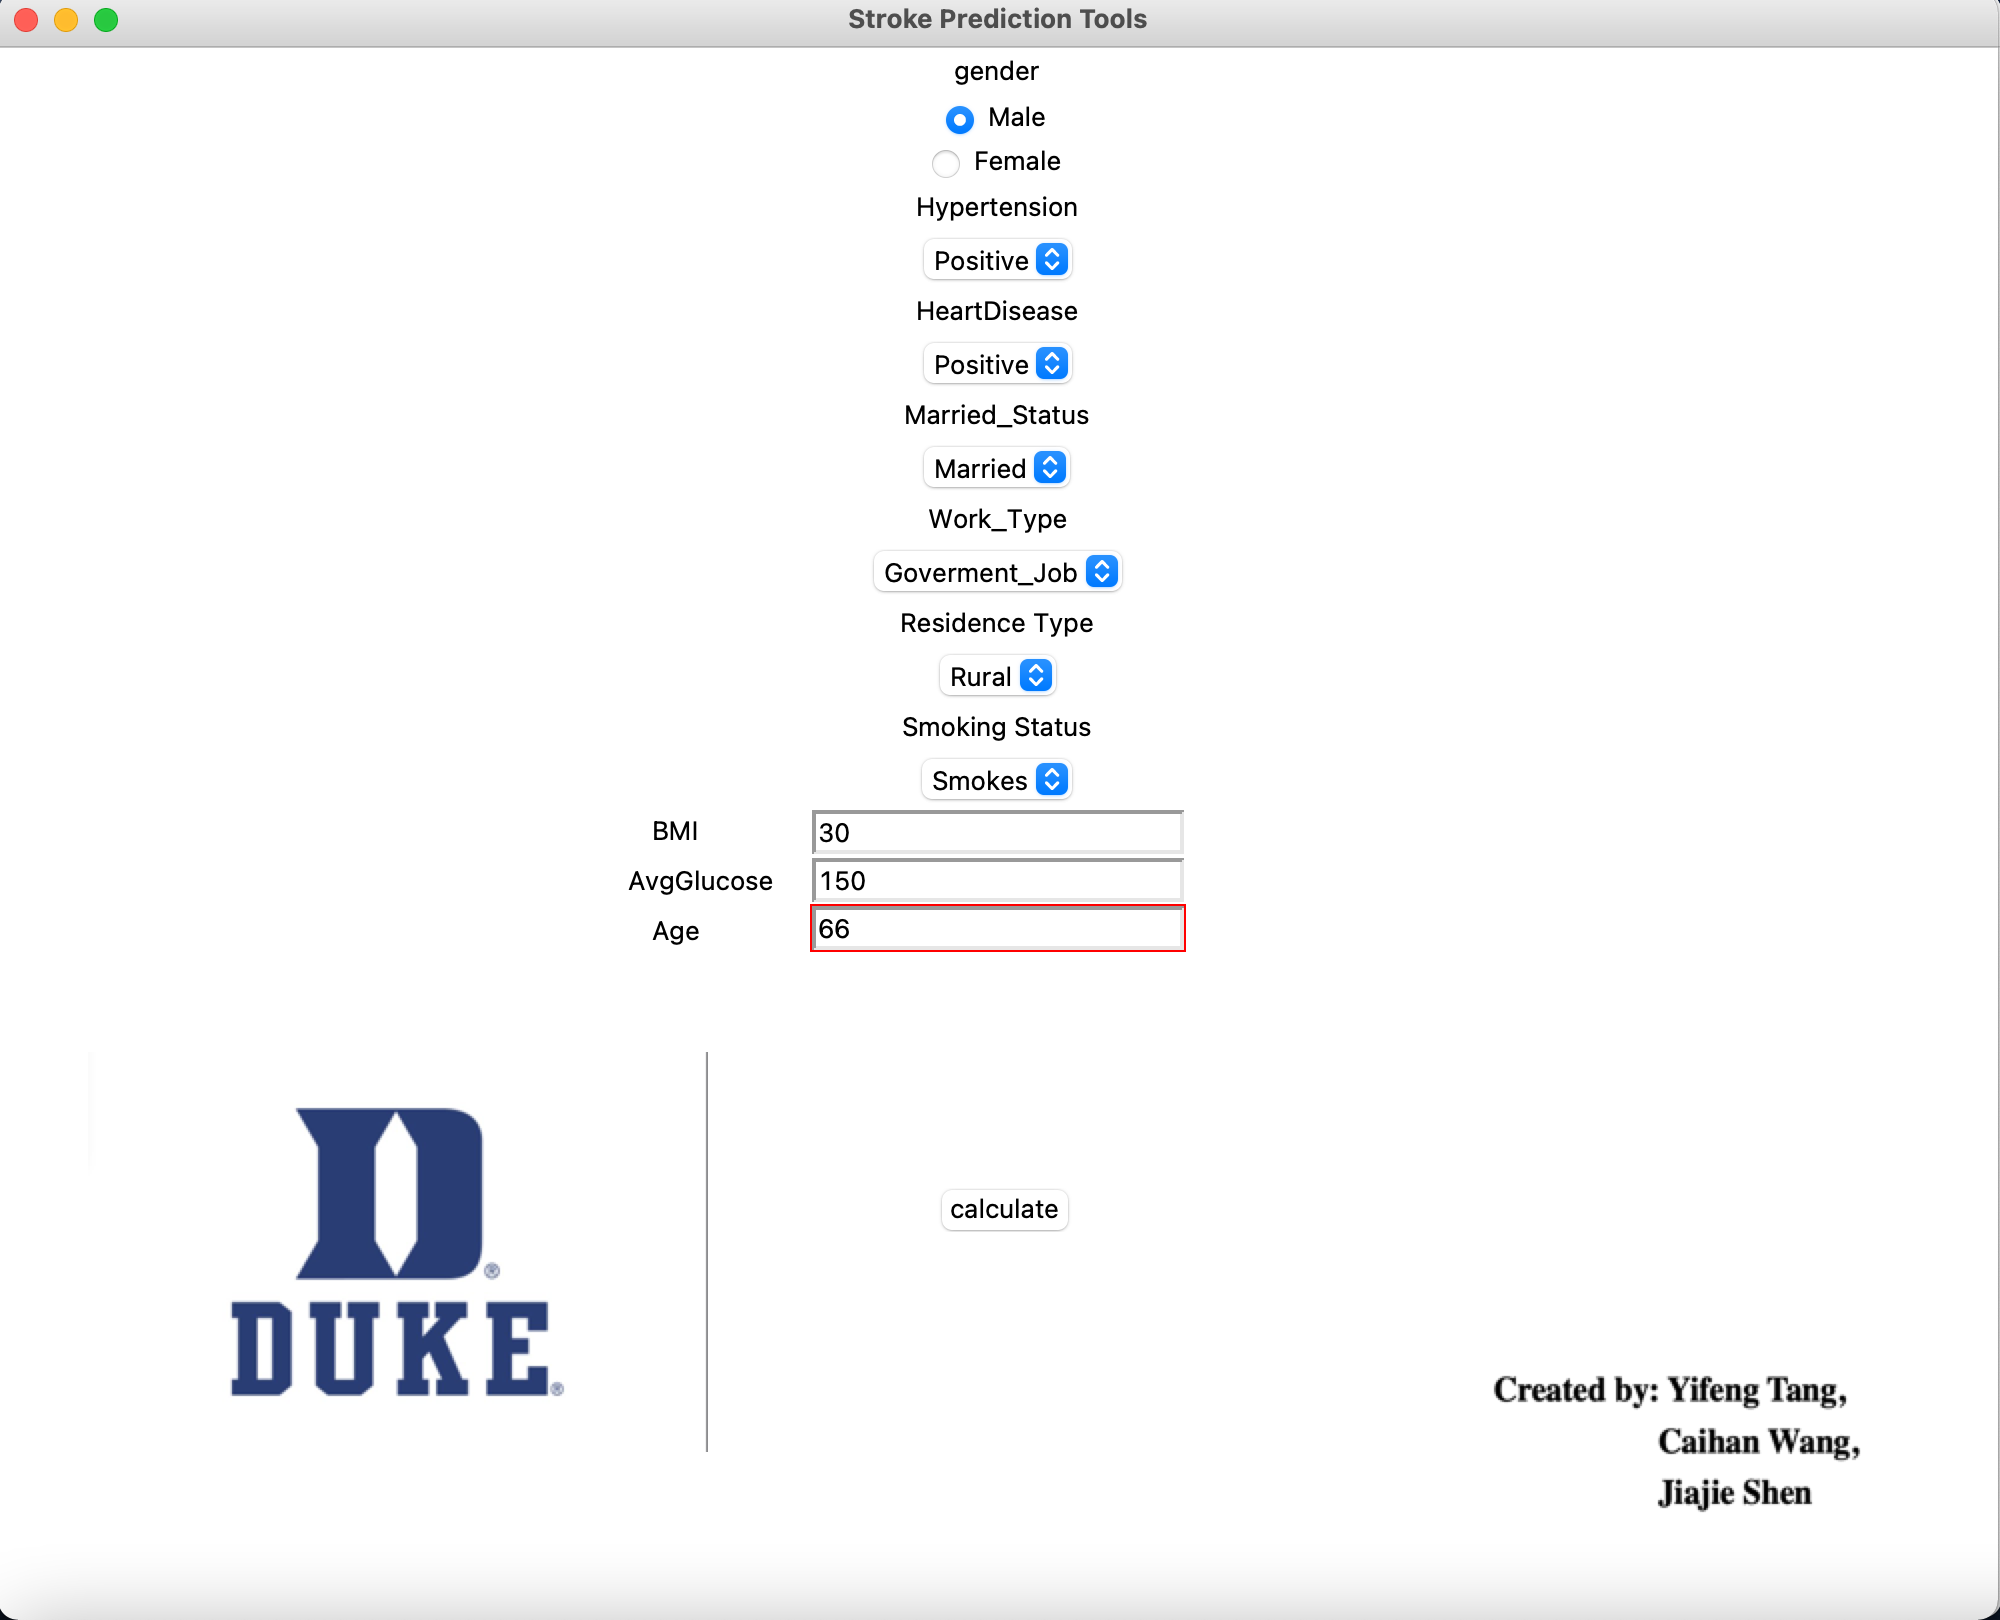
In the main window, we have many selection bars and input value boxes. Users could select the most accurate options that described their status. Also, we have set the valid range of three numeric input values:
- Age: [0, 100]
- Glucose_average_level:[20, 300]
- BMI: (0,150]
The following is a screen shot of main window:
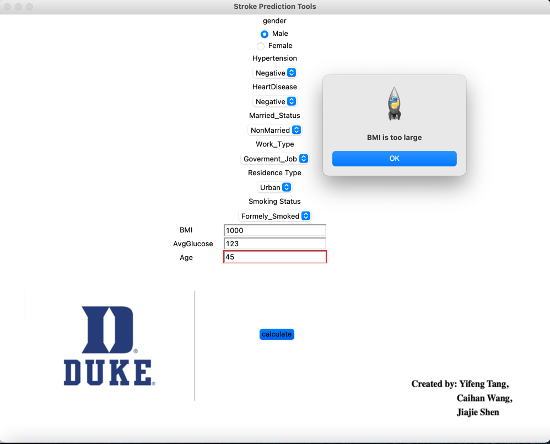
If your numeric input value is not within the valid range, there would be a message warning that.
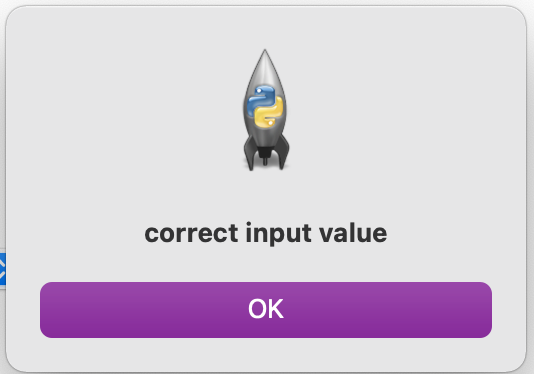
If your numeric input values are all satisfied the requirements, there would be a message to say all input values are valid:
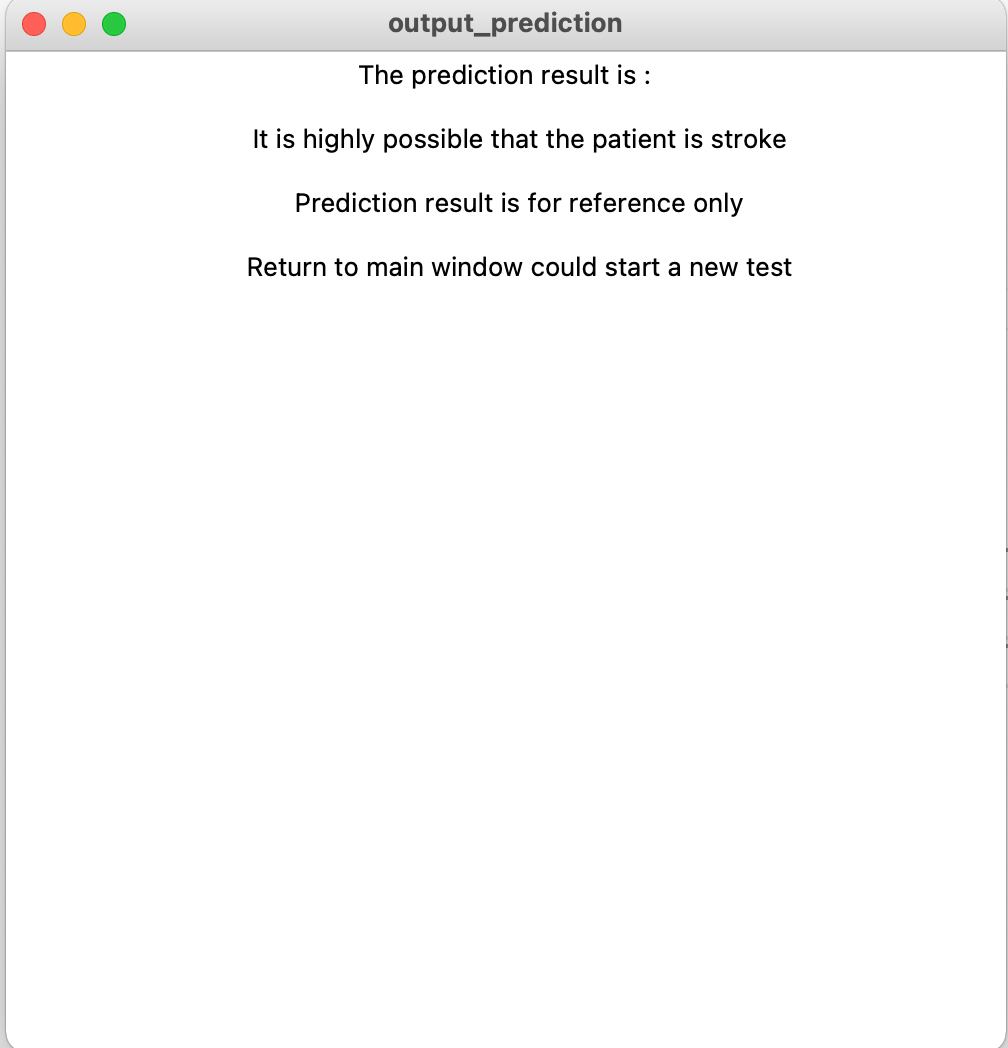
Then, you will see the result:
Examples
Limitation & Discussion
The number of people who are stroke is small, so that the model is not so accurate. And the predict result is only for reference and not absolute. If we can get the more comprehensive data, the model will be much better.