CanvGauge
Pure HTML5/JavaScript gauge implementation now for Qlik Sense.
Description
This visualization extension brings Mikhus implementation of gauge using pure JavaScript and HTML5 canvas to be integrated with Qlik Sense.
Original souce: https://github.com/Mikhus/canv-gauge/wiki
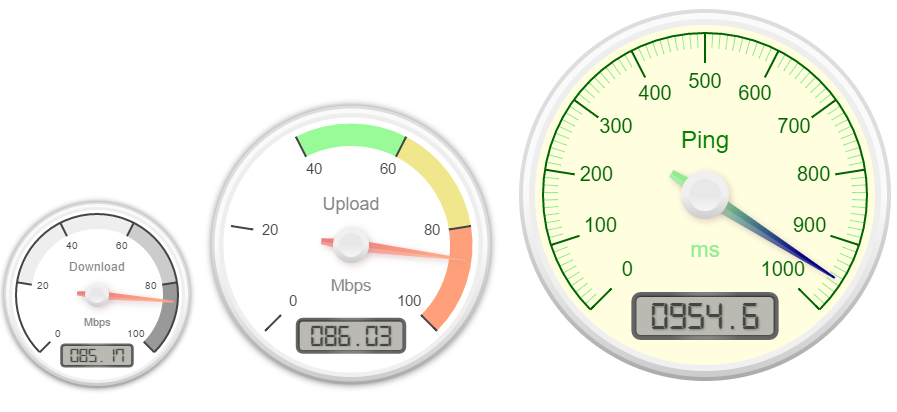
Screenshots

Installation
- Download the content.
- Deploy the extension to your Qlik Sense environment.
- Qlik Sense Desktop: Copy the entire contents of the .zip file to
"C:\Users\
\Documents\Qlik\Sense\Extensions\CanvGauge" - Qlik Sense Server: Follow the instructions for "Deploying visualizations in Qlik Sense"
- Qlik Sense Desktop: Copy the entire contents of the .zip file to
"C:\Users\
Usage
Open a Qlik Sense app sheet, start Edit mode, then drag and drop CanvGauge from the Charts menu onto the sheet.

Settings

About Color Settings
The colors in the settings can be specified by the following methods:
- Hexadecimal colors
- RGB colors
- RGBA colors
- HSL colors
- HSLA colors
- Predefined/Cross-browser color names
More info about the methods follow the link:
http://www.w3schools.com/cssref/css_colors_legal.asp
Layout Settings
In this section we can define the background color of the Gauge and if have a glow or not.

Ticks Settings
In this section we can define the color of the Major and Minor ticks, stroke line or not, the number of minor ticks visible
and also define the Major ticks.
If the Major ticks is empty the gauge calculate them automatically

Below one example with Stroke Ticks (the left one) and other Without (the right one)

Values Settings
In this section we can define values color and format (number of decimal places and leading zeros), also the minimum and the maximum value presented by the gauge.

Titles & Units Settings
In this section we can define the title (notice that this is the inside gauge title) and it's color and a unit label.

Needle Settings
In this section we can define the color of the Needle and it's animation.
By default the needle always have define animation (elastic) but through this section we can override this animation.

Highlights Settings
The Highlights must be defined as the follow:
"from" : < tick number >, "to" : < tick number >, "color" : "< color >"

License
Copyright © 2015 Bruno Silva
Released under the MIT license.