afCEC
Active function cross-entropy clustering partitions the n-dimensional data into the clusters by finding the parameters of the mixed generalized multivariate normal distribution, that optimally approximates the scattering of the data in the n-dimensional space, whose density. The above-mentioned generalization is performed by introducing so called "f-adapted Gaussian densities" (i.e. the ordinary Gaussian densities adapted by the "active function"). Additionally, the active function cross-entropy clustering performs the automatic reduction of the unnecessary clusters. For more information please refer to P. Spurek, J. Tabor, K.Byrski, "Active function Cross-Entropy Clustering" (2017) . The afCEC package is a part of CRAN repository and it can be installed by the following command:
install.packages("afCEC")
library("afCEC")
The basic usage comes down to the function afCEC with two required arguments: input data (points) and the initial number of centers (maxClusters):
afCEC (points= , maxClusters= )Below, a simple session with R is presented, where the component (waiting) of the Old Faithful dataset is split into two clusters:
library(afCEC)
data(fire)
plot(fire, asp=1, pch=20)

result <- afCEC(fire, 5,  numberOfStarts=10);
print(result)
plot(result)
As the main result, afCEC returns data cluster membership cec$cluster. The following parameters of
clusters can be obtained as well:
- means (
result$means) - covariances (
result$covariances) - cardinalities (
result$cardinalities)
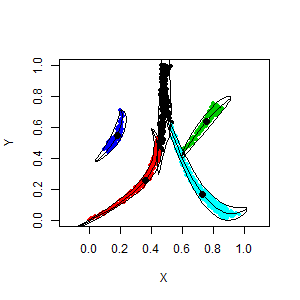
Below, a simple session with R is presented, where 2d dataset is split into 5 clusters:
library(afCEC)
data(fire)
plot(fire, asp=1, pch=20)
result <- afCEC(fire, 5,  numberOfStarts=10);
plot(result)
library(afCEC)
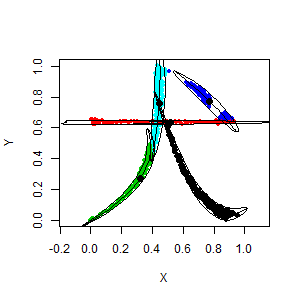
data(dog)
plot(dog, asp=1, pch=20)
result <- afCEC(dog, 5,  numberOfStarts=10);
plot(result)
library(afCEC)
data(airplane);
plot3d(airplane,col="black",aspect=FALSE)

result <- afCEC(airplane, 17,  numberOfStarts=30);
plot(result)
plot(result, draw_points=TRUE, draw_means=TRUE, draw_ellipsoids=F, draw_surfaces=F)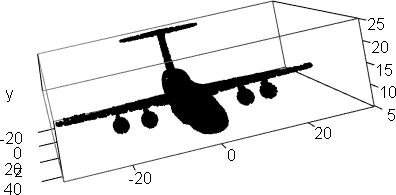
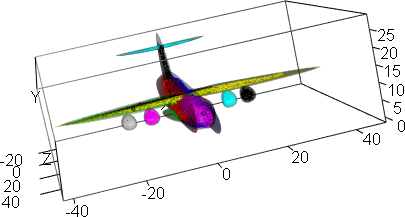

library(afCEC)
data(ship);
plot3d(ship,col="black",aspect=FALSE)

result <- afCEC(ship, 20,  numberOfStarts=30);

plot(result, draw_points=T, draw_means=F, draw_surfaces=F,pointsSize3D=0.001)
plot3d(ship,col=result$labels+1)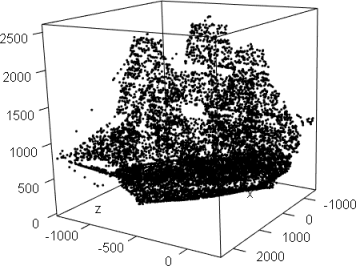
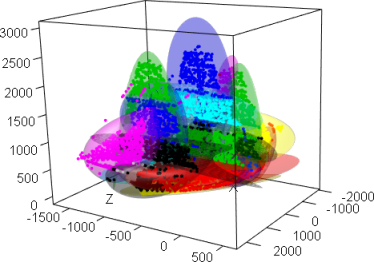
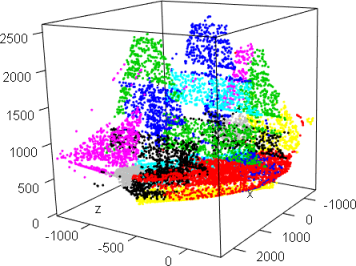
library(afCEC)
data(iris)
pairs(iris[,1:4], pch =18, cex=1)

result <- afCEC(as.matrix(iris[,1:4]), 3,  numberOfStarts=30);
pairs(iris[,1:4], col=result$labels+1, pch =18, cex=1)

library(afCEC)
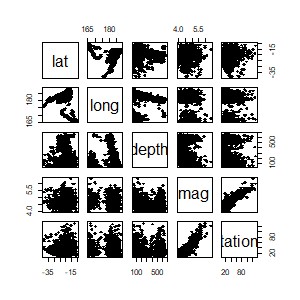
data(quakes)
pairs(quakes[,1:5], pch =18, cex=1)

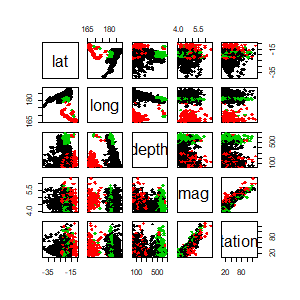
result <- afCEC(as.matrix(quakes[,1:5]), 3,  numberOfStarts=30);
pairs(quakes[,1:5], col=result$labels+1, pch =18, cex=1)