Surface Morphometrics Pipeline
Quantification of Membrane Surfaces Segmented from Cryo-ET or other volumetric imaging.
Author: Benjamin Barad/benjamin.barad@gmail.com.
Developed in close collaboration with Michaela Medina
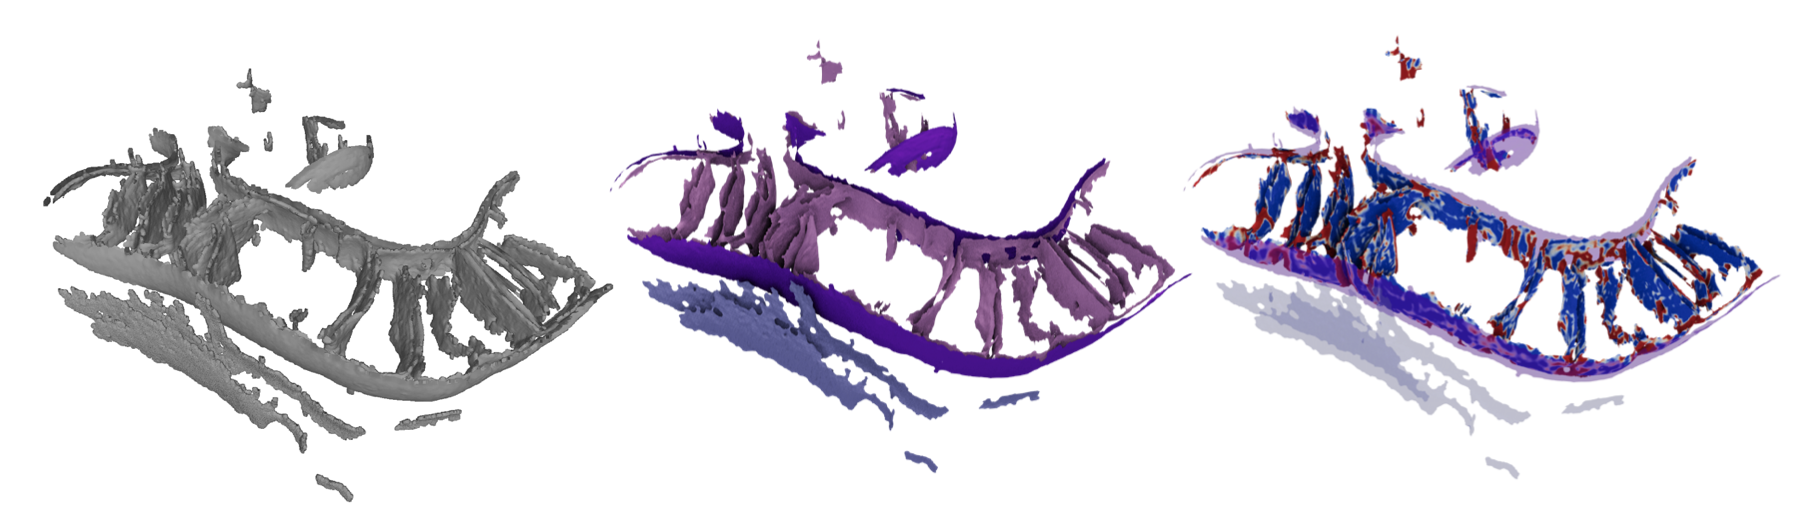
A pipeline of tools to generate robust open mesh surfaces from voxel segmentations of biological membranes using the Screened Poisson algorithm, calculate morphological features including curvature and membrane-membrane distance using pycurv's vector voting framework, and tools to convert these morphological quantities into morphometric insights.
Installation:
- Clone this git repository:
git clone https://github.com/grotjahnlab/surface_morphometrics.git - Install the conda environment:
conda env create -f environment.yml - Activate the conda environment:
conda activate morphometrics - Install additional dependencies:
pip install -r pip_requirements.txt
Example data
There is tutorial data available in the example_data folder. Uncompress the tar file with:
cd example_data
tar -xzvf examples.tar.gz
There are two example datasets: TE1.mrc and TF1.mrc.
You can open them with mrcfile, like so:
import mrcfile

with mrcfile.open('TE1.mrc', permissive=True) as mrc:
    print(mrc.data.shape)  # TE1.mrc has shape (312, 928, 960)
In some cases the file header may be non-standard (for example, mrc files exported from Amira software). In these cases, the permissive=True keyword argument is required, and you can ignore the warning that the file may be corrupt. All the surface morphometrics toolkit scripts will still run correctly.
Running the configurable pipeline
Running the full pipeline on a 4 core laptop with the tutorial datasets takes about 8 hours (3 for TE1, 5 for TF1), mostly in steps 3 and 4. With cluster parallelization, the full pipeline can run in 2 hours for as many tomograms as desired.
-
Edit the
config.ymlfile for your specific project needs. -
Run the surface reconstruction for all segmentations:
python segmentation_to_meshes.py config.yml -
Run pycurv for each surface (recommended to run individually in parallel with a cluster):
python run_pycurv.py config.yml ${i}.surface.vtpYou may see warnings aobut the curvature, this is normal and you do not need to worry.
-
Measure intra- and inter-surface distances and orientations (also best to run this one in parallel for each original segmentation):
python measure_distances_orientations.py config.yml ${i}.mrc -
Combine the results of the pycurv analysis into aggregate Experiments and generate statistics and plots. This requires some manual coding using the Experiment class and its associated methods in the
morphometrics_stats.py. Everything is roughly organized around working with the CSVs in pandas dataframes. Runningmorphometrics_stats.pyas a script with the config file and a filename will output a pickle file with an assembled "experiment" object for all the tomos in the data folder. Reusing a pickle file will make your life way easier if you have dozens of tomograms to work with, but it doesn't save too much time with just the example data...
Examples of generating statistics and plots:
python single_file_histogram.py filename.csv -n featurewill generate an area-weighted histogram for a feature of interest in a single tomogram. I am using a variant of this script to respond to reviews asking for more per-tomogram visualizations!python single_file_2d.py filename.csv -n1 feature1 -n2 feature2will generate a 2D histogram for 2 features of interest for a single surface.mitochondria_statistics.pyshows analysis and comparison of multiple experiment objects for different sets of tomograms (grouped by treatment in this case). Every single plot and statistic in the preprint version of the paper gets generated by this script.
Running individual steps without pipelining
Individual steps are available as click commands in the terminal, and as functions
- Robust Mesh Generation
mrc2xyz.pyto prepare point clouds from voxel segmentationxyz2ply.pyto perform screened poisson reconstruction and mask the surfaceply2vtp.pyto convert ply files to vtp files ready for pycurv
- Surface Morphology Extraction
curvature.pyto run pycurv in an organized way on pregenerated surfacesintradistance_verticality.pyto generate distance metrics and verticality measurements within a surface.interdistance_orientation.pyto generate distance metrics and orientation measurements between surfaces.- Outputs: gt graphs for further analysis, vtp files for paraview visualization, and CSV files for pandas-based plotting and statistics
- Morphometric Quantification - there is no click function for this, as the questions answered depend on the biological system of interest!
morphometrics_stats.pyis a set of classes and functions to generate graphs and statistics with pandas.- Paraview for 3D surface mapping of quantifications.
File Descriptions:
- Files with.xyz extension are point clouds converted, in nm or angstrom scale. This is a flat text file with
X Y Zcoordinates in each line. - Files with .ply extension are the surface meshes (in a binary format), which will be scaled in nm or angstrom scale, and work in many different softwares, including Meshlab.
- Files with surface.vtp extension are the same surface meshes in the VTK format.
- Files with .gt extension are triangle graph files using the
graph-toolpython toolkit. These graphs enable rapid neighbor-wise operations such as tensor voting, but are not especially useful for manual inspection. - Files with .csv extension are quantification outputs per-triangle. These are the files you'll use to generate statistics and plots.
- Files with .log extension are log files, mostly from the output of the pycurv run.
- Quantifications (plots and statistical tests) are output in csv, svg, and png formats.
Troubleshooting
- If installation fails, you may want to reference
Install.mdfor advanced installation tips (this is especially relevant for M1/M2 macs and Centos7 linux machines) - Warnings of the type
Gaussian or Mean curvature of X has a large computation error... can be ignored, as they get cleaned up by pycurv - MRC files that are output by AMIRA don't have proper machine stamps by default. They need to be imported with
mrcfile.open(filename, permissive=True)
Dependencies
- Numpy
- Scipy
- Pandas
- mrcfile
- Click
- Matplotlib
- Pymeshlab
- Pycurv
- Pyto
- Graph-tool
Citation
The development of this toolkit and examples of useful applications can be found in the following manuscript. Please cite it if you use this software in your research, or extend it to make improvements!
A surface morphometrics toolkit to quantify organellar membrane ultrastructure using cryo-electron tomography.
Benjamin A. Barad†, Michaela Medina†, Daniel Fuentes, R. Luke Wiseman, Danielle A. Grotjahn
bioRxiv 2022.01.23.477440; doi: https://doi.org/10.1101/2022.01.23.477440
All scientific software is dependent on other libraries, but the surface morphometrics toolkit is particularly dependent on PyCurv, which provides the vector voted curvature measurements and the triangle graph framework. As such, please also cite the pycurv manuscript:
Reliable estimation of membrane curvature for cryo-electron tomography.
Maria Salfer,Javier F. Collado,Wolfgang Baumeister,Rubén Fernández-Busnadiego,Antonio Martínez-Sánchez
PLOS Comp Biol August 2020; doi: https://doi.org/10.1371/journal.pcbi.1007962