⚠️ Notice of Delay: IEEE ITSS Student Competition on Pedestrian Behavior Prediction ⚠️
Dear Participants,
We regret to inform you that due to unforeseen paperwork delays, we are unable to annotate and prepare the competition data on time. As a result, the IEEE ITSS Student Competition on Pedestrian Behavior Prediction will be postponed.
We understand the inconvenience this may cause and sincerely apologize for it. We expect the data to be ready in another 1-2 months, and the competition is likely to resume in September when the fall semester begins. However, at this moment, we are unable to provide an exact timeline.
We greatly appreciate your interest and enthusiasm for the IEEE ITSS Student Competition on Pedestrian Behavior Prediction. We ask for your patience and understanding as we work through these delays. Please keep an eye out for further updates and additional notices.
Thank you for your continued support.
Welcome to the 2nd IEEE ITSS Student Competition on Pedestrian Behavior Prediction!
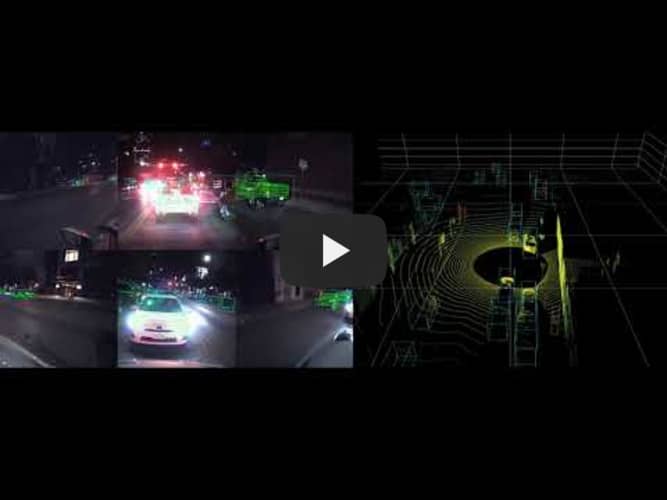
Video Demo
❓ Q&A Session
❔ Question 1: How to register for the competition?
- Answer: When the training and validation data are ready to be released, registration for the competition will open in Mid-July via the Codalab platform. Please first register account on Codalab with official email, the competition registration link will be released soon.
❔ Question 2: Where to download the data?
- Answer: As of June 15th, we have released the sample data with annotations. Full competition training and validation data will be released in Mid-July. Final testing data will be released in early September (September 4th as the tentative date).
Background
Pedestrian behavior prediction is one of the most critical challenges for fully automated driving in urban settings. It requires autonomous vehicles to interact safely and efficiently with pedestrians in diverse and dynamic environments. Accurate and robust pedestrian behavior prediction is crucial to ensure the safety of both pedestrians and autonomous vehicles.
Competition Tasks
- Short-Term Pedestrian Trajectory Prediction (ST-PTP)
- Long-Term Pedestrian Trajectory Prediction (LT-PTP)
PTP forecasts a pedestrian's future trajectory from a bird's-eye view, using observed data from six surrounding cameras and lidar. The Short-Term Prediction (ST) targets a 3-second future path, while the Long-Term Prediction (LT) extends to 7 seconds.
Eligibility
We invite competitors from all around the world. Each team's leader must be a current undergraduate or graduate student. Teams are limited to entering one track only.
Winning teams are expected to present their results in the IEEE ITSC 2024 conference.
Prizes

Important Dates
We postponed the competition's starting date by a month due to data preparation delays. Demo data with labels have now been released. We encourage interested teams to start preparing algorithms and use public benchmark datasets to pretrain their models.
-
Data Demo: June 15th
-
Competition Begins: July 15th
-
Submission Deadline: September 5th
Get Started
Data Description
Our dataset consists of a total of 500 scenarios, which are split into training, validation, and test sets with a ratio of 70%, 10%, and 20%, respectively. Each scenario is at least 20 seconds long. The data provided includes:
-
Lidar Frame: Captured at 10 FPS, with annotations provided at 1 FPS.
-
Surrounding Cameras: Six camera images captured at 10 FPS.
-
Extrinsic and Intrinsic Matrix: Provided for calibration.
The annotations on the lidar frame include the following objects:
- Pedestrian
- E-scooter
- Bicyclist
- Vehicle
- Bus
- Traffic light/sign
Sample Data
Training and Validation Data
Training and Validation Data will be released by July 15th when the competition starts.
Evaluation Guidelines
All the metrics are averaged over the test samples.
To ensure the accuracy and robustness of the pedestrian behavior prediction models, the following evaluation metrics will be used:
Metrics for Evaluation
-
Average Displacement Error (ADE)
- Definition: ADE measures the average Euclidean distance between the predicted trajectory and the ground truth trajectory over all annotated key points.
- Formula:
ADE = (1 / K) * Σ[ sqrt((x_k - x̂_k)² + (y_k - ŷ_k)²) ]where
Kis the total number of annotated key points,(x_k, y_k)is the ground truth position at key pointk, and(x̂_k, ŷ_k)is the predicted position at key pointk.
-
Final Displacement Error (FDE)
- Definition: FDE measures the Euclidean distance between the predicted final position and the ground truth final position at the last annotated key point.
- Formula:
FDE = sqrt((x_K - x̂_K)² + (y_K - ŷ_K)²)where
Kis the final annotated key point,(x_K, y_K)is the ground truth final position, and(x̂_K, ŷ_K)is the predicted final position.
-
Miss Rate (MR)
- Definition: MR is the proportion of predicted trajectories that are further away from the ground truth trajectory by a certain threshold at the final annotated key point.
- Formula:
MR = (1 / N) * Σ[ 1(sqrt((x_K^i - x̂_K^i)² + (y_K^i - ŷ_K^i)²) > δ) ]where
Nis the total number of predicted trajectories,1is the indicator function, andδis the distance threshold.
-
Collision Rate (CR)
- Definition: CR measures the percentage of predicted trajectories that collide with the other agents in the environment, calculated based on all points of the trajectories.
- Formula:
CR = (1 / N) * Σ[ 1(collision(i)) ]where
collision(i)indicates whether thei-th predicted trajectory collides with any obstacle.Important Notes
-
Submission Format
- Participants must submit their predicted trajectories in a predefined format. Each submission should include the predicted coordinates for each pedestrian at each time step within the prediction horizon.
-
Data Splitting
- The dataset will be divided into training, validation, and test sets. The training and validation sets will be provided to participants for model development and tuning. We will run a dry run on the validation set in our competition platform for you to test your results format, while the test set will be used for final evaluation.
-
Prediction Horizon
- Short-Term Prediction (ST-PTP): Predicting the pedestrian trajectory for the next 3 seconds.
- Long-Term Prediction (LT-PTP): Predicting the pedestrian trajectory for the next 7 seconds.
-
Frame Rate Adjustment
- The annotated data are provided at 1 FPS, but the output trajectory needs to be at 5 FPS. Participants must ensure their predicted trajectories are interpolated to meet this requirement.
Evaluation Procedure
- Submissions will be evaluated based on all metrics, where ADE, FDE, and MR are calculated only on the annotated key points. The CR will be calculated based on all the points of the trajectories.
- The final ranking will be based on the average ranking of all metrics.
Steering Committee
 |
Nobuyuki Ozaki Nagoya University |
 |
Lingxi Li Purdue University |
 |
Jing Chen Rice University |
Organizers
 |
Yaobin Chen Purdue University |
 |
Zhengming Ding Tulane University |
 |
Xin Hu Tulane University |
 |
Renran Tian North Carolina State University |
 |
Shaozhi Wang North Carolina State University |
 |
Zhengming Zhang Purdue University |

:bulb: This competition focuses on Short-Term Pedestrian Trajectory Prediction (ST-PTP) and Long-Term Pedestrian Trajectory Prediction (LT-PTP). PTP forecasts a pedestrian's future trajectory from a bird's-eye view, utilizing observed data from six surrounding cameras and lidar. The Short-Term Prediction (ST) targets a 3-second future path, while the Long-Term Prediction (LT) extends to 7 seconds.