![]()
![]()
![]()
![]()
![]()
![]()

pynsee gives a quick access to more than 150 000 macroeconomic series,
a dozen datasets of local data, numerous sources available on insee.fr,
geographical limits of administrative areas taken from IGN
as well as key metadata and SIRENE database containing data on all French companies.
Have a look at the detailed API page api.insee.fr.
This package is a contribution to reproducible research and public data transparency. It benefits from the developments made by teams working on APIs at INSEE and IGN.
Installation & API subscription
The files available on insee.fr and IGN data, i.e. the use of download and geodata modules, do not require authentication.
Credentials are necessary to access some of the INSEE APIs available through pynsee by the modules macrodata, localdata, metadata and sirene.
API credentials can be created here : api.insee.fr
# Download Pypi package
pip install pynsee[full]

# Get the development version from GitHub
# git clone https://github.com/InseeFrLab/pynsee.git
# cd pynsee
# pip install .[full]

# Subscribe to api.insee.fr and get your credentials!
# Save your credentials with init_conn function :
from pynsee.utils.init_conn import init_conn
init_conn(insee_key="my_insee_key", insee_secret="my_insee_secret")

# Beware : any change to the keys should be tested after having cleared the cache
# Please do : from pynsee.utils import clear_all_cache; clear_all_cache()
Data Search and Collection Advice
- Macroeconomic data :
First, use
get_dataset_listto search what are your datasets of interest and then get the series list withget_series_list. Alternatively, you can make a keyword-based search withsearch_macrodata, e.g.search_macrodata('GDP'). Then, get the data withget_datasetorget_series - Local data : use first
get_local_metadata, then get data withget_local_data - Metadata : e.g. function to get the classification of economic activities (Naf/Nace Rev2)
get_activity_list - Sirene (French companies database) : use first
get_dimension_list, then usesearch_sirenewith dimensions as filtering variables - Geodata : get the list of available geographical data with
get_geodata_listand then retrieve it withget_geodata - Files on insee.fr: get the list of available files on insee.fr with
get_file_listand then download it withdownload_file
For further advice, have a look at the documentation and gallery of the examples.
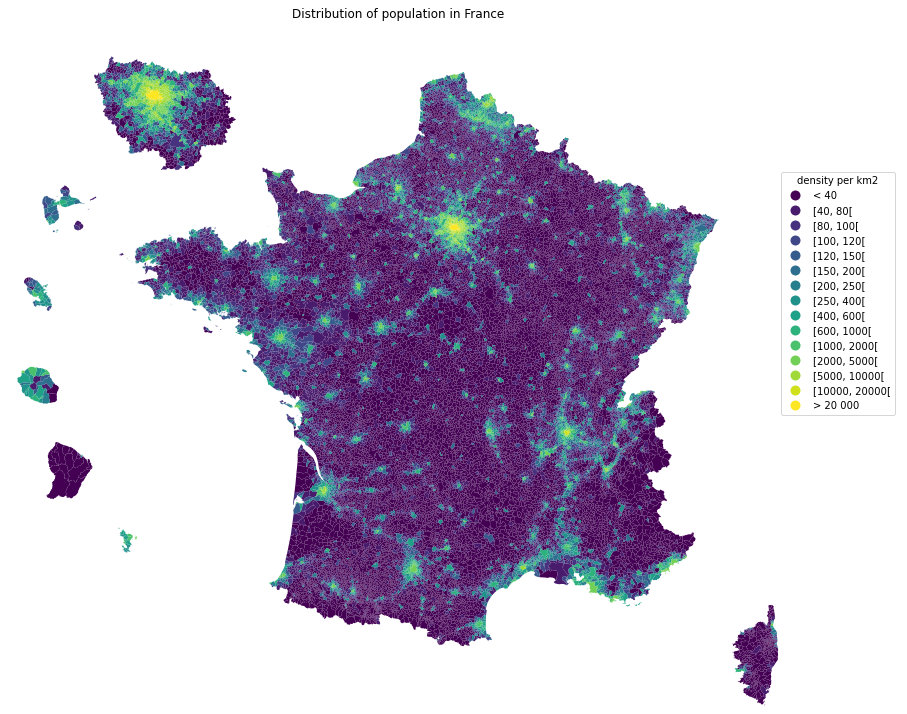
Example - Population Map
from pynsee.geodata import get_geodata_list, get_geodata, GeoFrDataFrame

import math
import geopandas as gpd
import pandas as pd
from pandas.api.types import CategoricalDtype
import matplotlib.cm as cm
import matplotlib.pyplot as plt
import descartes

import warnings
from shapely.errors import ShapelyDeprecationWarning
warnings.filterwarnings("ignore", category=ShapelyDeprecationWarning)

# get geographical data list
geodata_list = get_geodata_list()
# get departments geographical limits
com = get_geodata('ADMINEXPRESS-COG-CARTO.LATEST:commune')

mapcom = gpd.GeoDataFrame(com).set_crs("EPSG:3857")

# area calculations depend on crs which fits metropolitan france but not overseas departements
# figures should not be considered as official statistics
mapcom = mapcom.to_crs(epsg=3035)
mapcom["area"] = mapcom['geometry'].area / 10**6
mapcom = mapcom.to_crs(epsg=3857)

mapcom['REF_AREA'] = 'D' + mapcom['insee_dep']
mapcom['density'] = mapcom['population'] / mapcom['area']

mapcom = GeoFrDataFrame(mapcom)
mapcom = mapcom.translate(departement = ['971', '972', '974', '973', '976'],
                          factor = [1.5, 1.5, 1.5, 0.35, 1.5])

mapcom = mapcom.zoom(departement = ["75","92", "93", "91", "77", "78", "95", "94"],
                 factor=1.5, startAngle = math.pi * (1 - 3 * 1/9))
mapcom

mapplot = gpd.GeoDataFrame(mapcom)
mapplot.loc[mapplot.density < 40, 'range'] = "< 40"
mapplot.loc[mapplot.density >= 20000, 'range'] = "> 20 000"

density_ranges = [40, 80, 100, 120, 150, 200, 250, 400, 600, 1000, 2000, 5000, 10000, 20000]
list_ranges = []
list_ranges.append( "< 40")

for i in range(len(density_ranges)-1):
    min_range = density_ranges[i]
    max_range = density_ranges[i+1]
    range_string = "[{}, {}[".format(min_range, max_range)
    mapplot.loc[(mapplot.density >= min_range) & (mapplot.density < max_range), 'range'] = range_string
    list_ranges.append(range_string)

list_ranges.append("> 20 000")

mapplot['range'] = mapplot['range'].astype(CategoricalDtype(categories=list_ranges, ordered=True))

fig, ax = plt.subplots(1,1,figsize=[15,15])
mapplot.plot(column='range', cmap=cm.viridis,
legend=True, ax=ax,
legend_kwds={'bbox_to_anchor': (1.1, 0.8),
             'title':'density per km2'})
ax.set_axis_off()
ax.set(title='Distribution of population in France')
plt.show()

fig.savefig('pop_france.svg',
            format='svg', dpi=1200,
            bbox_inches = 'tight',
            pad_inches = 0)
How to avoid proxy issues ?
# Use the proxy_server argument of the init_conn function to change the proxy server address
from pynsee.utils.init_conn import init_conn
init_conn(insee_key="my_insee_key",
         insee_secret="my_insee_secret",
         http_proxy="http://my_proxy_server:port",
         https_proxy="http://my_proxy_server:port")

# Beware : any change to the keys should be tested after having cleared the cache
# Please do : from pynsee.utils import *; clear_all_cache()

# Alternativety you can use directly environment variables as follows.
# Beware not to commit your credentials!
import os
os.environ['insee_key'] = 'my_insee_key'
os.environ['insee_secret'] = 'my_insee_secret'
os.environ['http_proxy'] = "http://my_proxy_server:port"
os.environ['https_proxy'] = "http://my_proxy_server:port"
Support
Feel free to open an issue with any question about this package using the Github repository.
Contributing
All contributions, whatever their forms, are welcome. See CONTRIBUTING.md