
[](https://circleci.com/gh/JohnCoene/coronavirus)
[](https://travis-ci.org/JohnCoene/coronavirus)
[](https://ci.appveyor.com/project/JohnCoene/coronavirus)

[](https://www.tidyverse.org/lifecycle/#stable)

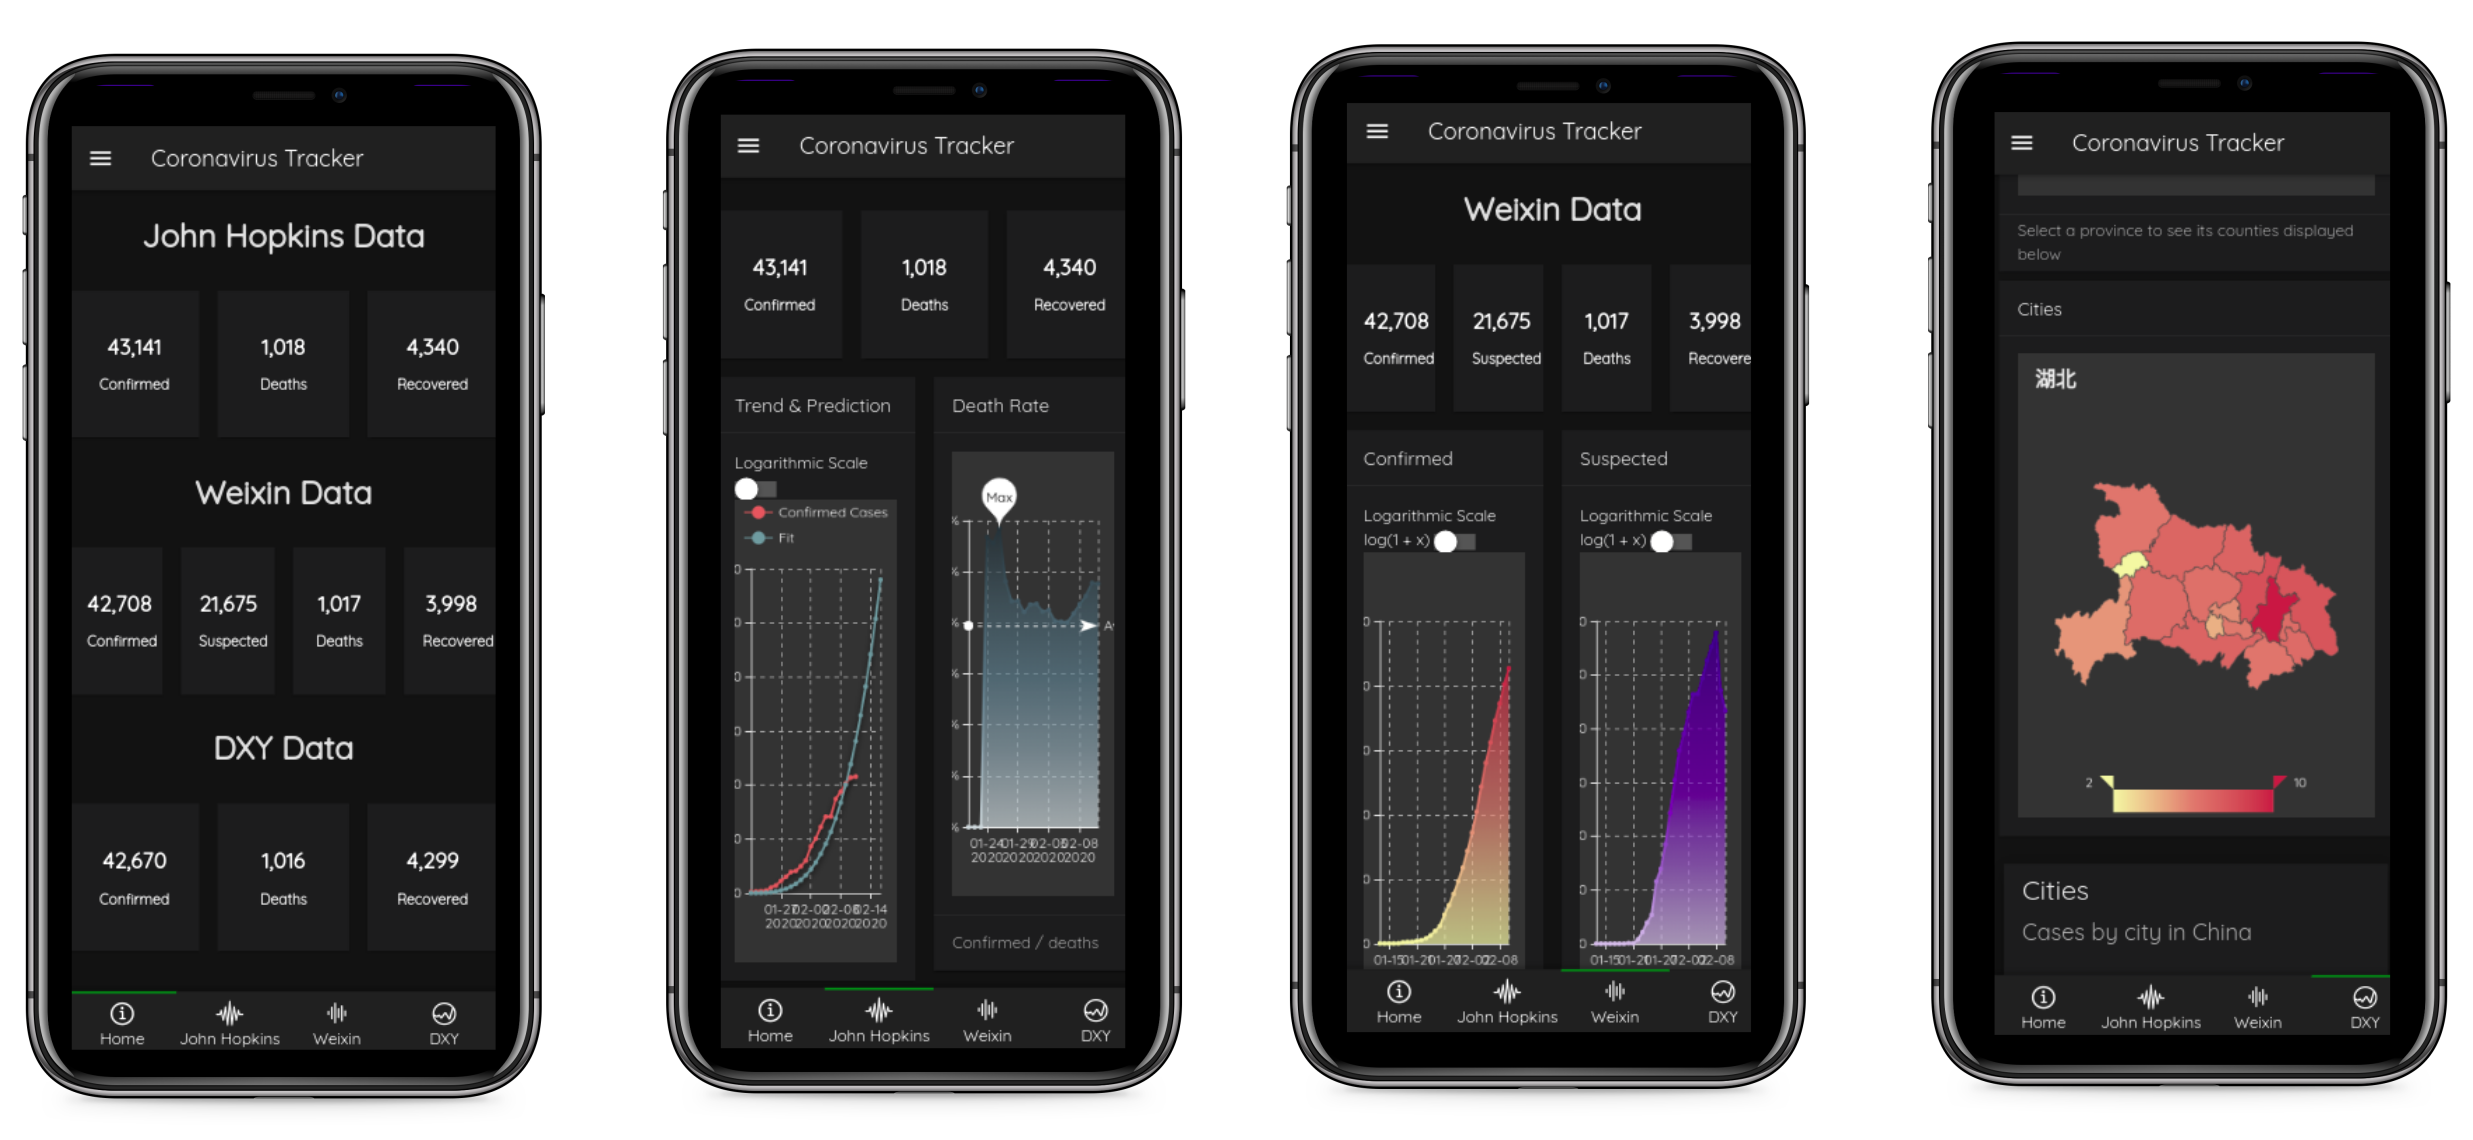
Dashboard to track the spread of the coronavirus, based on three data sources, built with [shinyMobile](https://rinterface.github.io/shinyMobile/) and [echarts4r](https://echarts4r.john-coene.com/).
[Tracker](https://shiny.john-coene.com/coronavirus) | [Docs](https://coronavirus.john-coene.com) | [API](https://coronavirus.john-coene.com/#/api) | [Changelog](NEWS.md)
Test
You can test the app before preparing any kind of deployment (e.g.: set up a database), visit the docs if you want to deploy it.
library(coronavirus)

virus <- crawl_coronavirus()
run_app(virus)
Get it
You can view the dashboard online or download the package to run it locally or deploy it.
# install.packages("remotes")
remotes::install_github("JohnCoene/coronavirus")
Contribute
Please note that this project is released with a Contributor Code of Conduct. By contributing to this project, you agree to abide by its terms.