PyPalettes
A large (+2500) collection of color maps for Python.
- All available palettes can be found on the dedicated website.
- To learn more about how to use
pypalettes, please refer to the official documentation.
This package is based on the R package paletteer, and all associated sub-packages (with original palettes) mentioned in the file LICENSE.
Installation
Note: pypalettes requires Python 3.9 or above.
You can install pypalettes directly from PyPI with:
pip install --upgrade pypalettesAlternatively you can install the development version with:
pip install git+https://github.com/JosephBARBIERDARNAL/pypalettes.gitQuick start
Once the cmap is loaded, you can use it as any other color map in matplotlib or seaborn.
import matplotlib.pyplot as plt
from pypalettes import load_cmap
import seaborn as sns
import numpy as np

data = np.random.rand(10, 12)

cmap = load_cmap('Anemone', cmap_type='continuous')

sns.heatmap(data, cmap=cmap)
plt.show()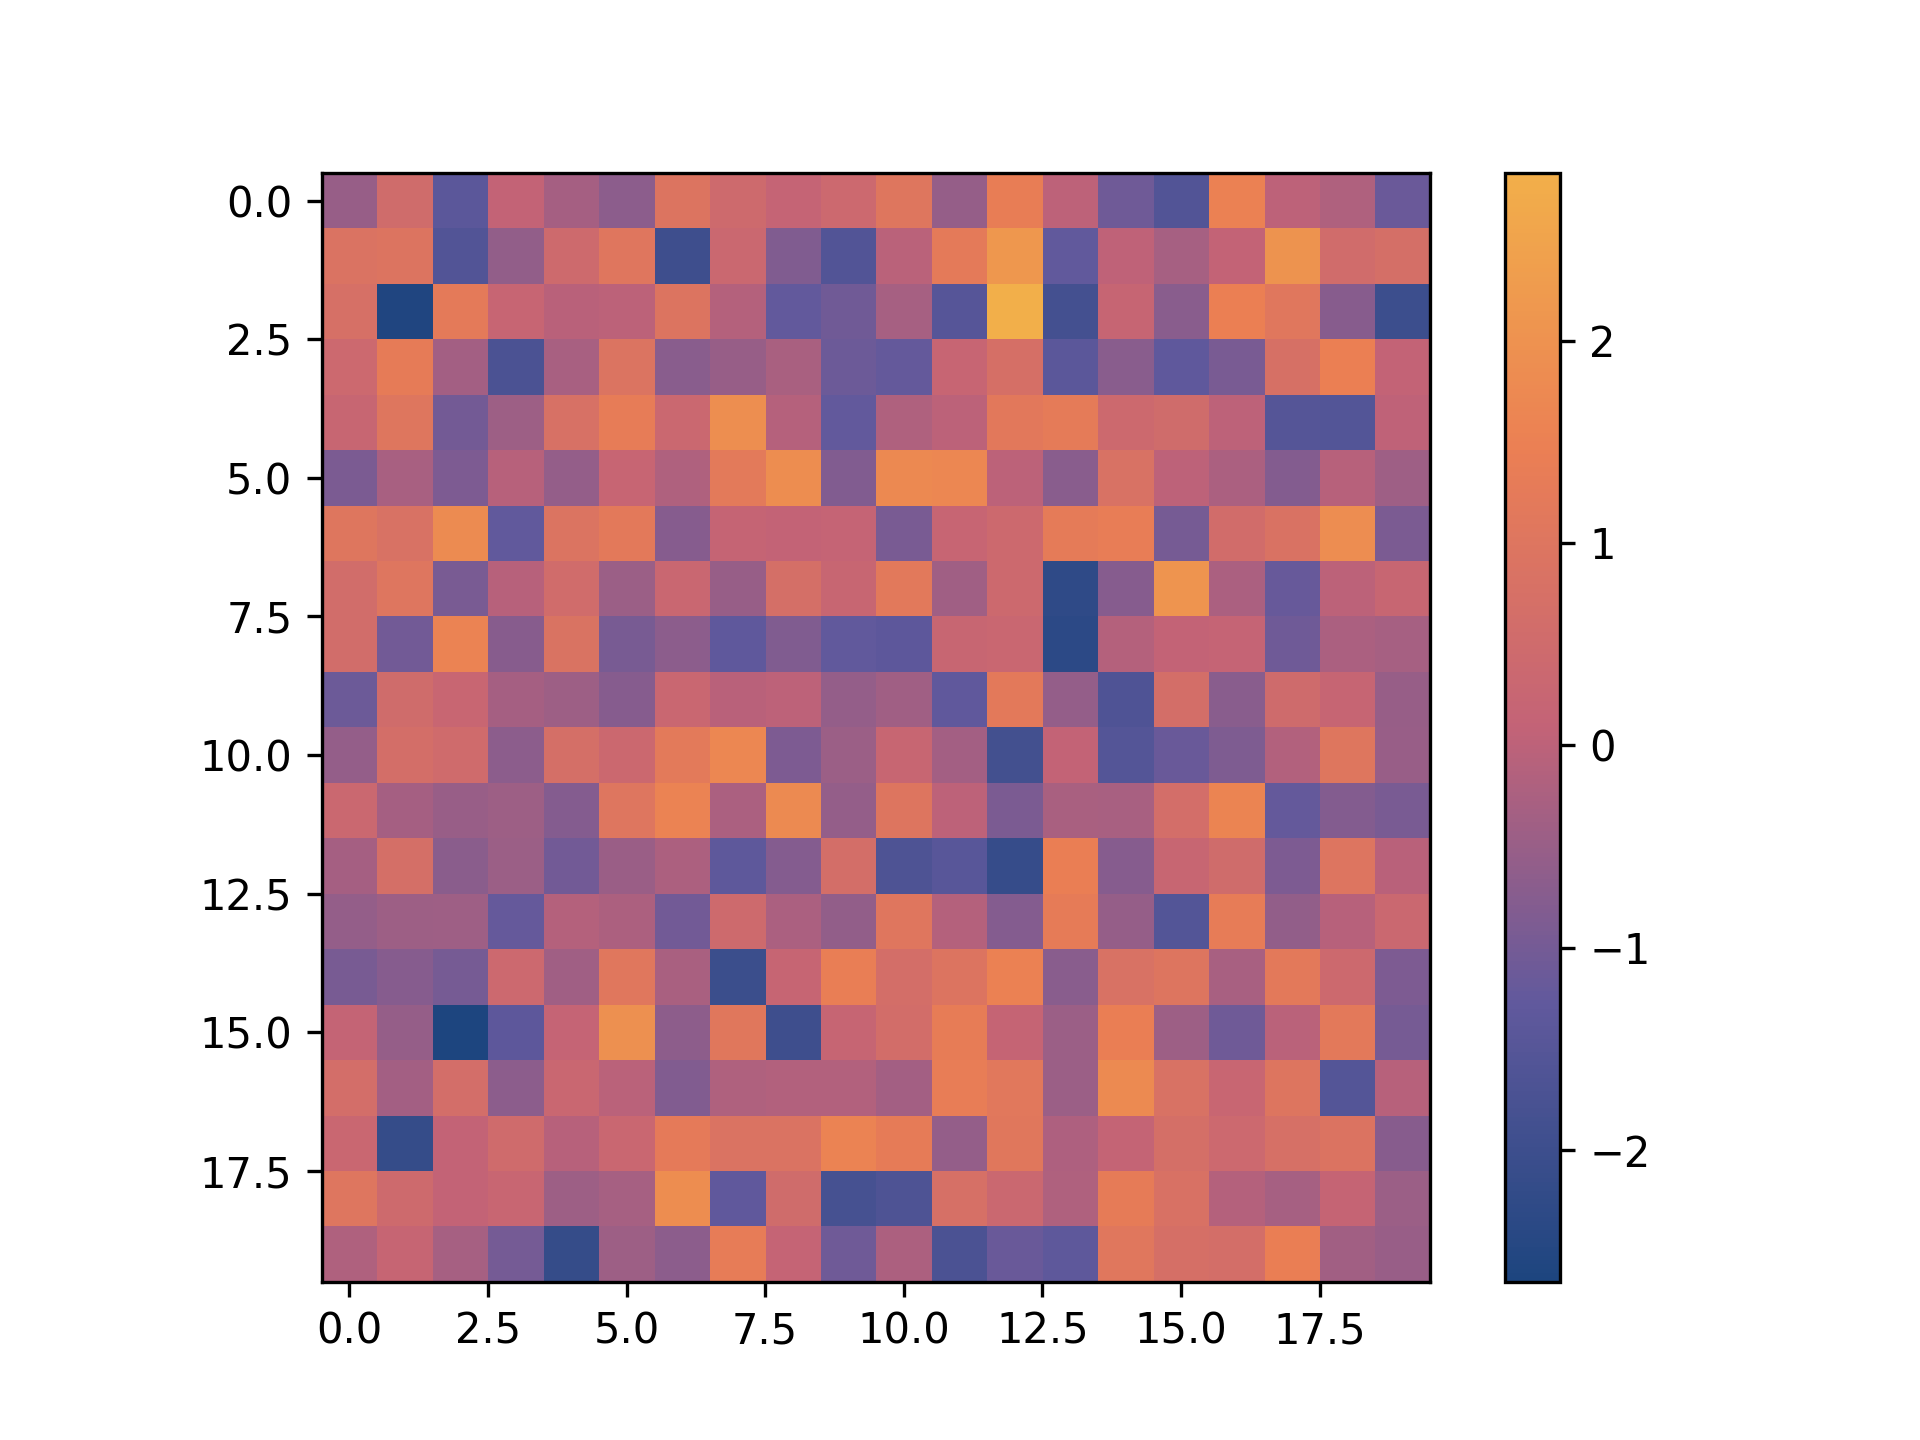
Getting started
- Load a color map:
from pypalettes import load_cmap
cmap = load_cmap('Chaetodon_sedentarius')
cmap
- Transform a qualitative color map into a continuous one:
from pypalettes import load_cmap
cmap = load_cmap('Chaetodon_sedentarius', cmap_type='continuous')
cmap
- Invert a color map:
from pypalettes import load_cmap
cmap = load_cmap('Chaetodon_sedentarius', reverse=True)
cmap
- Get hex values of a color map:
from pypalettes import get_hex
get_hex('pupitar')
['#7098C0FF', '#88C0E8FF', '#285880FF', '#B8E0F8FF', '#F8F8F8FF', '#404060FF', '#A8A8A8FF', '#C8C8D0FF', '#B04000FF']
- Get rgb values of a color map:
from pypalettes import get_rgb
get_rgb('AirNomads')
[(255, 153, 51), (194, 72, 65), (255, 255, 51), (139, 91, 69), (135, 175, 209), (238, 176, 90), (219, 197, 160)]
- Combine multiple colormaps
from pypalettes import get_hex
get_hex(['Alacena', 'Antique'])
['#693829FF', '#894B33FF', '#A56A3EFF', '#CFB267FF', '#D9C5B6FF', '#9CA9BAFF', '#5480B5FF', '#3D619DFF', '#405A95FF', '#345084FF', '#855C75FF', '#D9AF6BFF', '#AF6458FF', '#736F4CFF', '#526A83FF', '#625377FF', '#68855CFF', '#9C9C5EFF', '#A06177FF', '#8C785DFF', '#467378FF', '#7C7C7CFF']
More examples can be found in this introduction to PyPalettes.
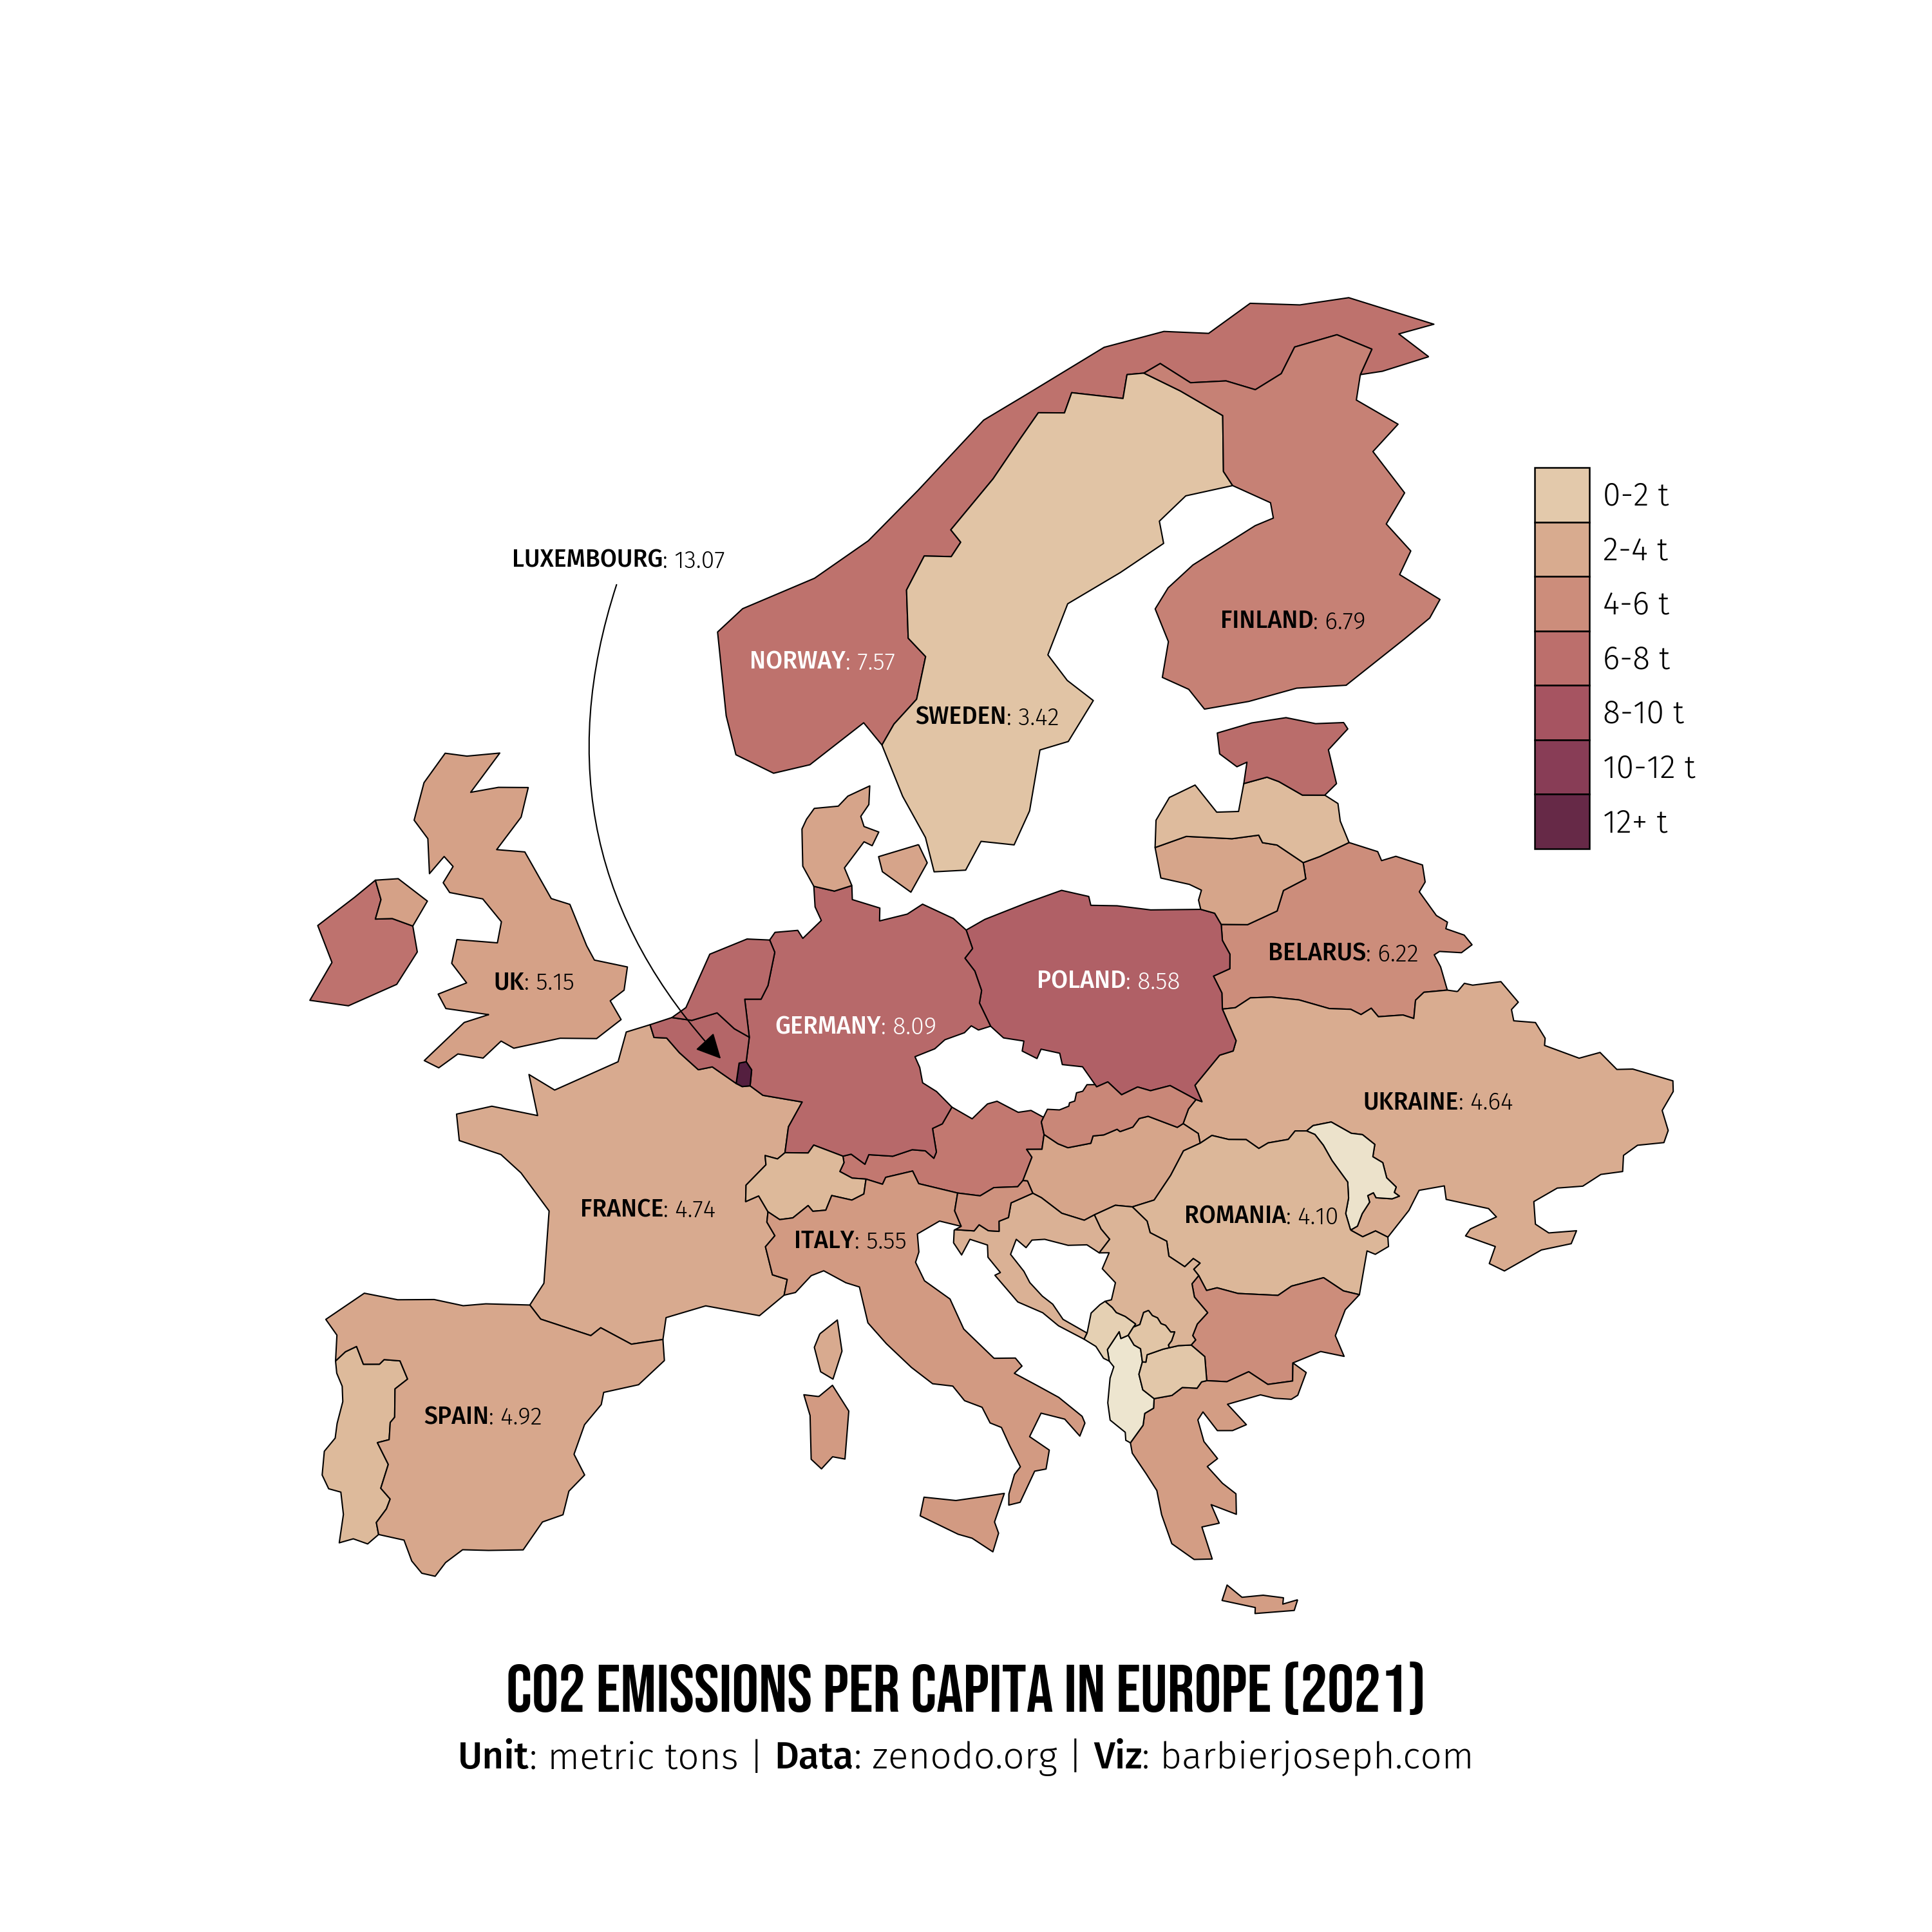
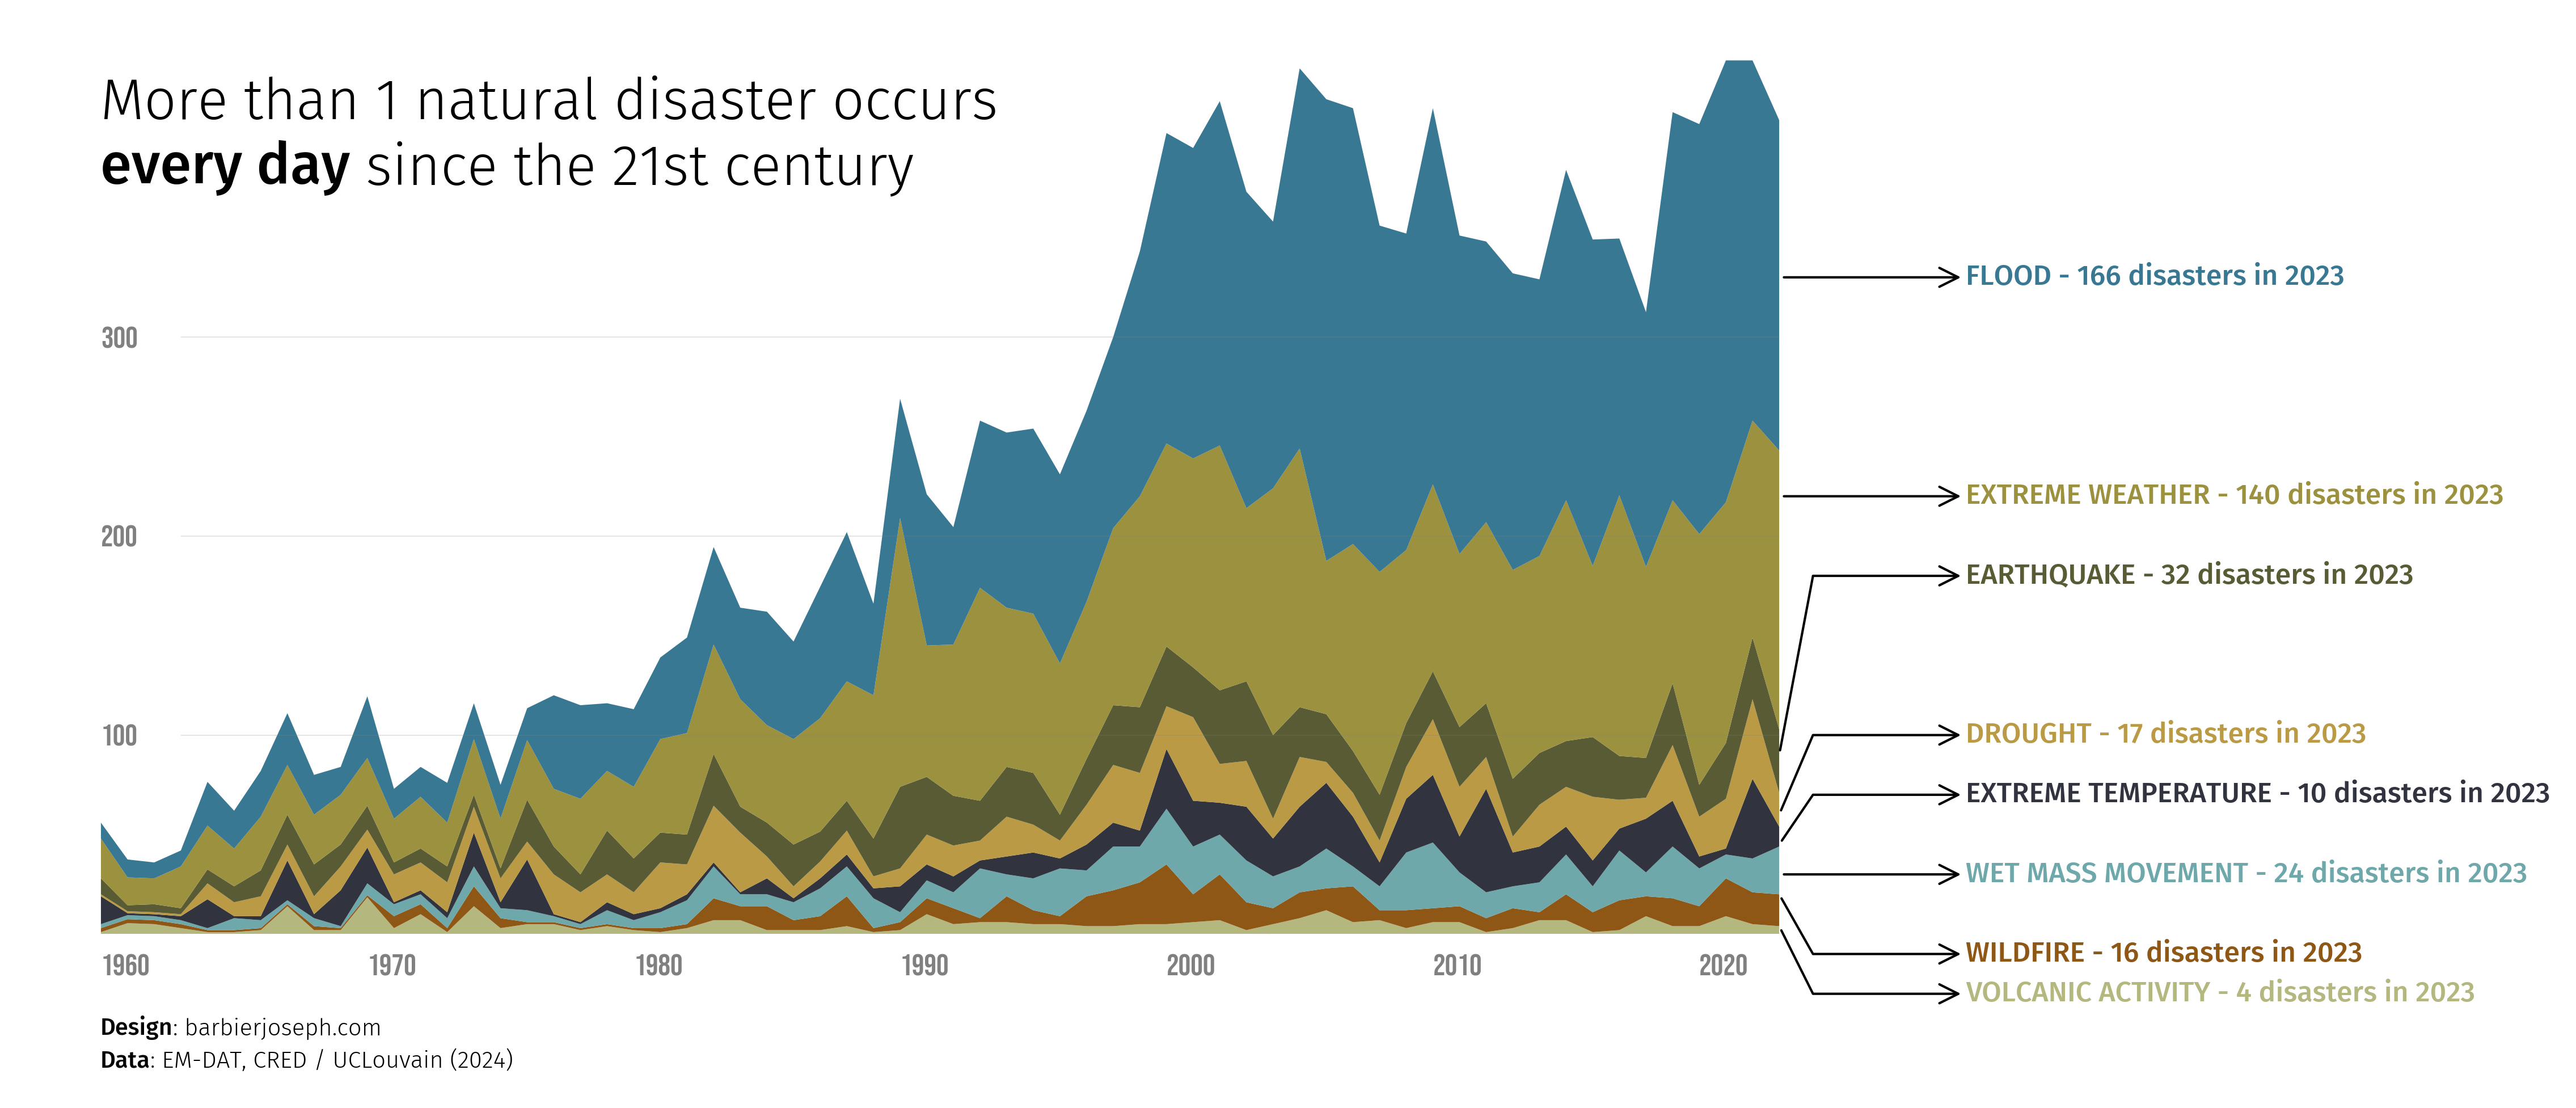
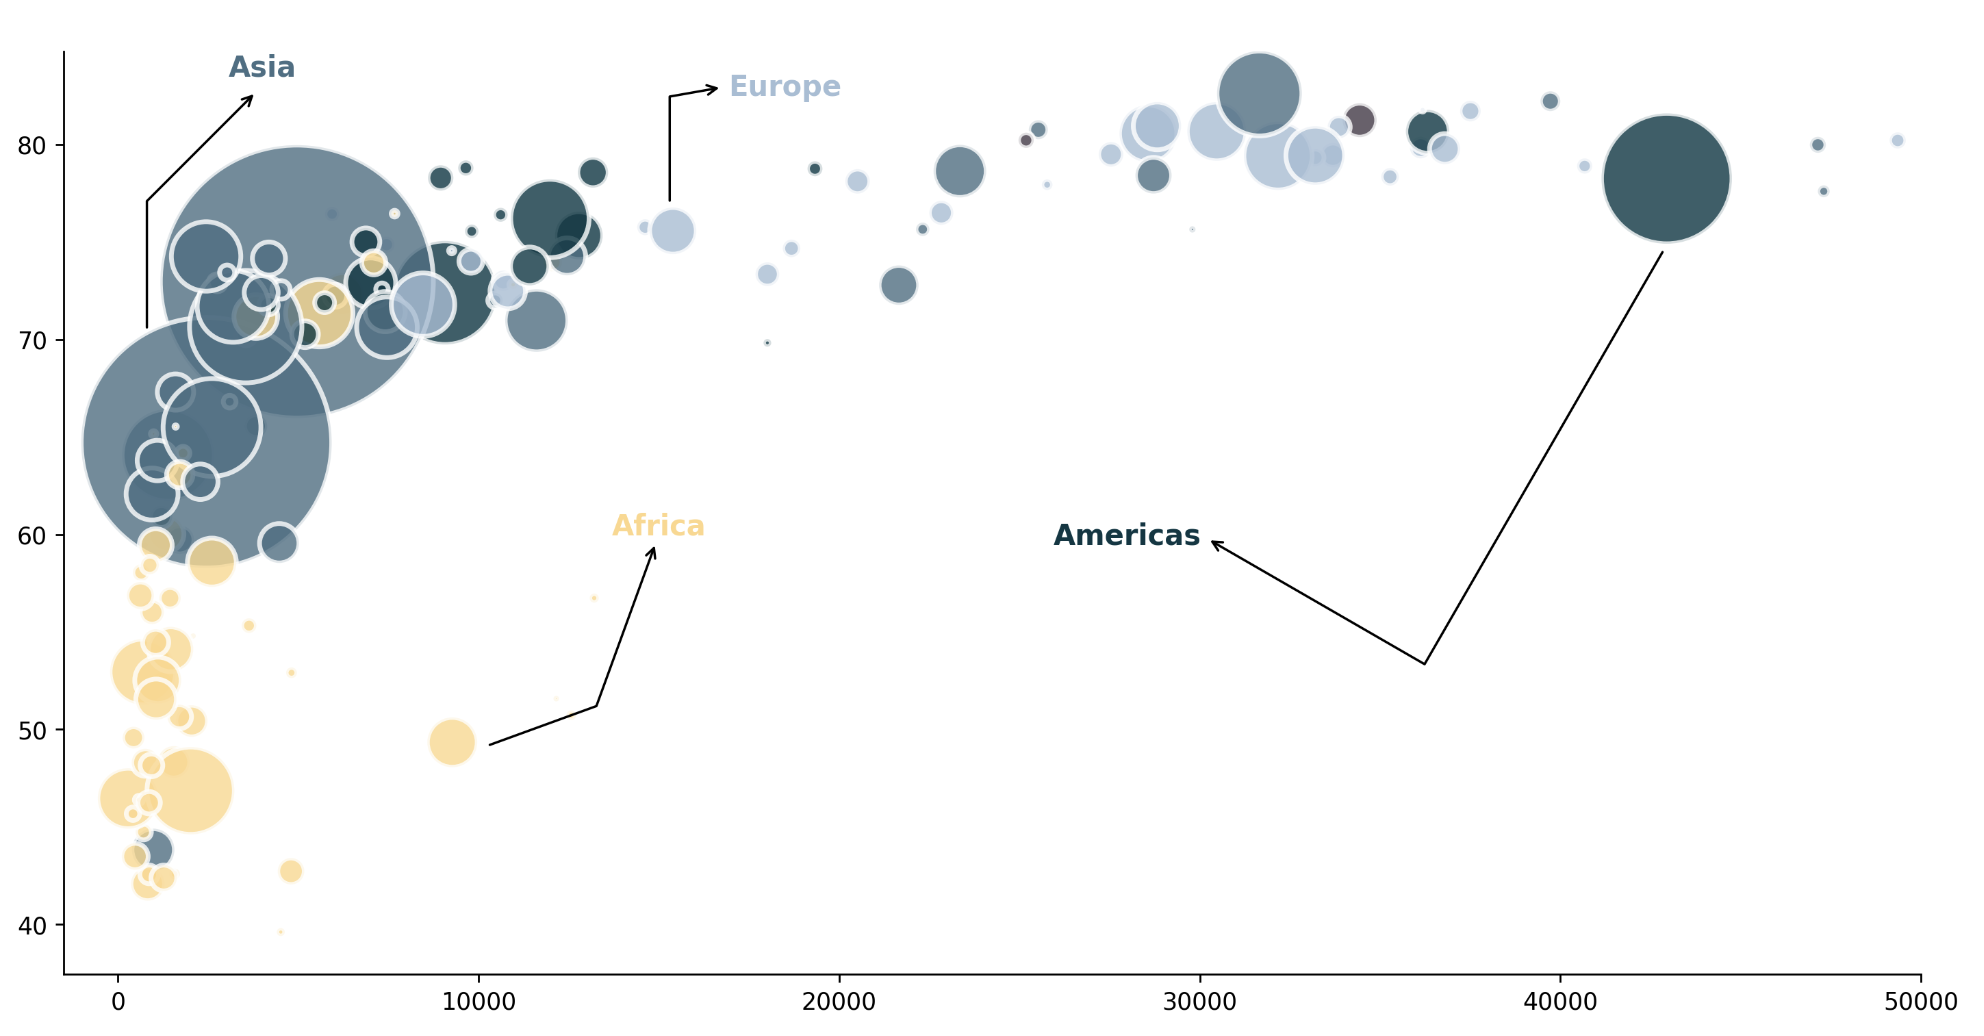
Chart made with pypalettes
Click on the image to get the associated code!
![]()
Contributing
Installation for contributions
-
Fork the Repository: Fork this repository to your GitHub account.
-
Clone the Repository:
git clone https://github.com/JosephBARBIERDARNAL/pypalettes.git cd pypalettes -
Set Up a Virtual Environment:
- Mac/Linux:
python3 -m venv venv source venv/bin/activate - Windows:
python -m venv venv
venv\Scripts\activate
- Mac/Linux:
-
Install Dependencies:
pip install -r requirements-dev.txt pip install -e . -
Create a Feature Branch:
git checkout -b feature-name -
Start Coding!
Since the core code of the library is currently quite short and simple, it does not require any major changes. However, if you feel like you have a good idea/suggestion, please open an issue.
BUT, more palettes is one easy way to make pypalettes better! Here is the best way to get started:
Then open your code editor and open parsers/list_manual_palettes.py. You will find a dictionnary of dictionnary of manually defined palettes. Add yours at the end with the following elements:
"name": the name of your palette"palette": the colors of your palette, in the following format:["['#123456', '#654321', '#162534']"]"source": where does your palette come from? If you created it, your name or a link to your portfolio is valid!"kind": the kind of your palette. View examples here"paletteer-kind": just put"unknown"
For a large number of palettes, please open an issue first.
Acknowledgements
PyPalettes is highly inspired (and relies on for the first one) from
- the R package paletteer
- the python library palettable.
A big thanks to Yan Holtz for:
- Creating the web app for browsing palettes
- Hosting the documentation and examples on the Python Graph Gallery
- Providing valuable feedback on the code and design of the API
How data has been collected
99% of the palettes come from the Paletteer R package.
Learn more in the dedicated directory.