Markov Affinity-based Graph Imputation of Cells (MAGIC)
Markov Affinity-based Graph Imputation of Cells (MAGIC) is an algorithm for denoising high-dimensional data most commonly applied to single-cell RNA sequencing data. MAGIC learns the manifold data, using the resultant graph to smooth the features and restore the structure of the data.
To see how MAGIC can be applied to single-cell RNA-seq, elucidating the epithelial-to-mesenchymal transition, read our publication in Cell.
MAGIC has been implemented in Python, Matlab, and R.
To get started immediately, check out our tutorials:
Python
- Epithelial-to-Mesenchymal Transition Tutorial
- Bone Marrow Tutorial
R
- Epithelial-to-Mesenchymal Transition Tutorial
- Bone Marrow Tutorial

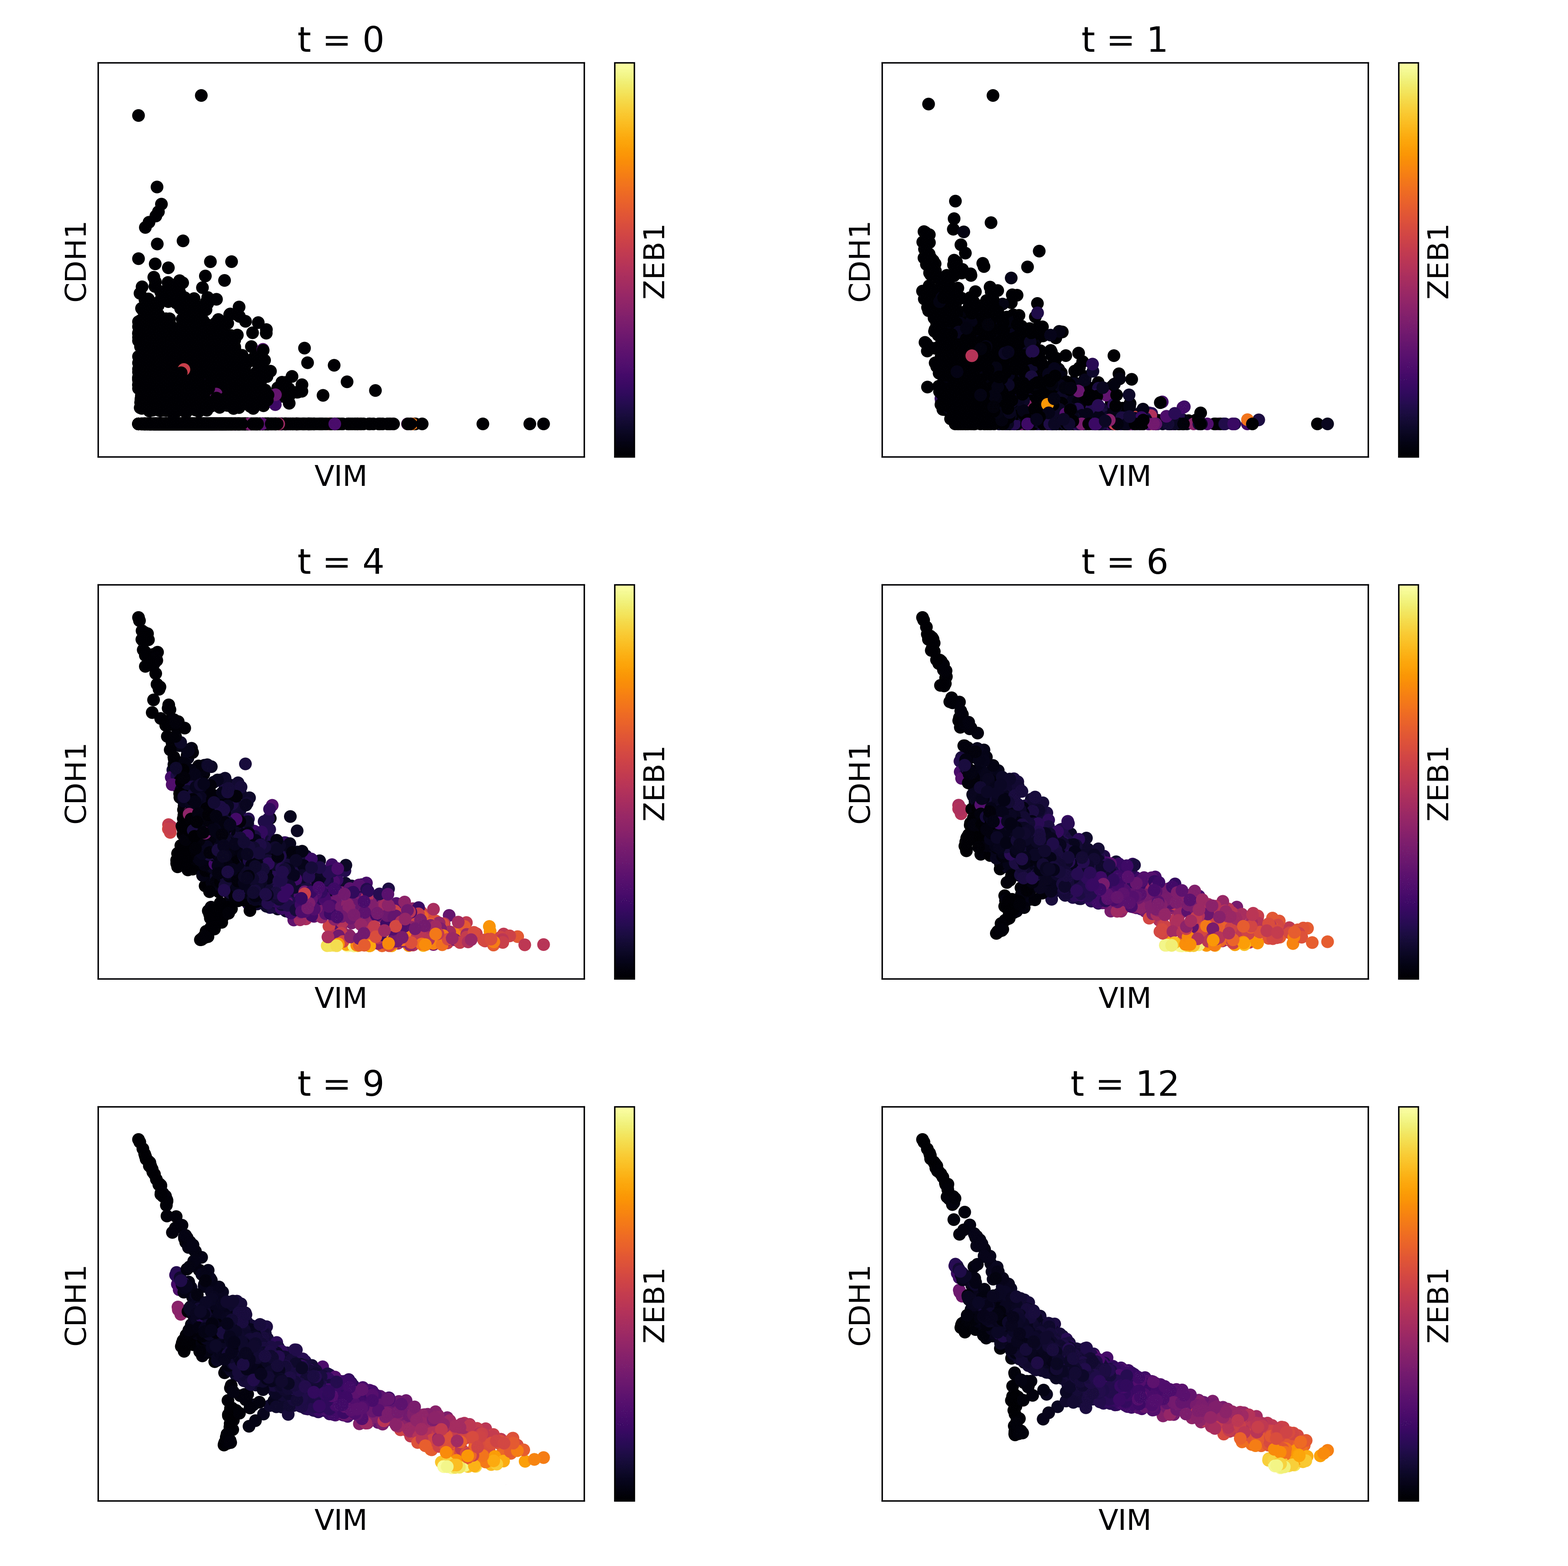
Magic reveals the interaction between Vimentin (VIM), Cadherin-1 (CDH1), and Zinc finger E-box-binding homeobox 1 (ZEB1, encoded by colors).
Table of Contents
Python
Installation
Installation with pip
To install with pip, run the following from a terminal:
pip install --user magic-imputeInstallation from GitHub
To clone the repository and install manually, run the following from a terminal:
git clone git://github.com/KrishnaswamyLab/MAGIC.git
cd MAGIC/python
python setup.py install --user
Usage
Quick Start
The following code runs MAGIC on test data located in the MAGIC repository.
import magic
import pandas as pd
import matplotlib.pyplot as plt
X = pd.read_csv("MAGIC/data/test_data.csv")
magic_operator = magic.MAGIC()
X_magic = magic_operator.fit_transform(X, genes=['VIM', 'CDH1', 'ZEB1'])
plt.scatter(X_magic['VIM'], X_magic['CDH1'], c=X_magic['ZEB1'], s=1, cmap='inferno')
plt.show()
magic.plot.animate_magic(X, gene_x='VIM', gene_y='CDH1', gene_color='ZEB1', operator=magic_operator)
Tutorials
You can read the MAGIC documentation at https://magic.readthedocs.io/. We have included two tutorial notebooks on MAGIC usage and results visualization for single cell RNA-seq data.
EMT data notebook: http://nbviewer.jupyter.org/github/KrishnaswamyLab/MAGIC/blob/master/python/tutorial_notebooks/emt_tutorial.ipynb
Bone Marrow data notebook: http://nbviewer.jupyter.org/github/KrishnaswamyLab/MAGIC/blob/master/python/tutorial_notebooks/bonemarrow_tutorial.ipynb
Matlab
Instructions for the Matlab version
- run_magic.m -- MAGIC imputation function
- test_magic.m -- Shows how to run MAGIC. Also included is a function for loading 10x format data (load_10x.m)
R
Installation
To use MAGIC, you will need to install both the R and Python packages.
If python or pip are not installed, you will need to install them. We recommend
Miniconda3 to install Python and pip together,
or otherwise you can install pip from https://pip.pypa.io/en/stable/installing/.
Installation from CRAN
In R, run this command to install MAGIC and all dependencies:
install.packages("Rmagic")In a terminal, run the following command to install the Python repository.
pip install --user magic-imputeInstallation from GitHub
To clone the repository and install manually, run the following from a terminal:
git clone git://github.com/KrishnaswamyLab/MAGIC.git
cd MAGIC/python
python setup.py install --user
cd ../Rmagic
R CMD INSTALL .
Usage
Quick Start
After installing the package, MAGIC can be run by loading the library and calling magic():
library(Rmagic)
library(ggplot2)
data(magic_testdata)
MAGIC_data <- magic(magic_testdata, genes=c("VIM", "CDH1", "ZEB1"))
ggplot(MAGIC_data) +
  geom_point(aes(x=VIM, y=CDH1, color=ZEB1))
Tutorials
You can read the MAGIC tutorial by running help(Rmagic::magic). For a working example, see the Rmarkdown tutorials at http://htmlpreview.github.io/?https://github.com/KrishnaswamyLab/MAGIC/blob/master/Rmagic/inst/examples/bonemarrow_tutorial.html and http://htmlpreview.github.io/?https://github.com/KrishnaswamyLab/MAGIC/blob/master/Rmagic/inst/examples/emt_tutorial.html or in Rmagic/inst/examples.
Help
If you have any questions or require assistance using MAGIC, please contact us at https://krishnaswamylab.org/get-help.


