 peterlynton
commented
7 years ago
peterlynton
commented
7 years ago I'm happy to attempt to add this (new to all of it actually) but cannot find the curve calculation in Xcode .
Closed CrushingT1D closed 7 years ago
peterlynton
commented
7 years ago I'm happy to attempt to add this (new to all of it actually) but cannot find the curve calculation in Xcode .
 bashem
commented
7 years ago
bashem
commented
7 years ago There is a suggestion on Gitter to just shorten the DIA instead of touching the code.
bashem
commented
7 years ago Class that computes is evidently called InsulinMath
peterlynton
commented
7 years ago @bashem It's early days so happy to shorten the DIA for the moment, but it may be better to generate new code for the curve as FIAsp has a very quick initial absorption rate and is currently a bit of an unknown on high doses.
You're correct regarding InsulinMath, which is based upon Glucodyn code written by Ken Stack https://github.com/kenstack/GlucoDyn. I've messaged him on Gitter to see if he can help but otherwise we need someone who can convert 4th-order polynomials to algebra.
If we're able to generate new algebra more suited to FIAsp I foresee it initially being used / tested by end users editing the code, with the potential of adding it as a secondary option to Master as FIAsp becomes more available worldwide as @CrushingT1D suggested.
 jeremybarnum
commented
7 years ago
jeremybarnum
commented
7 years ago I've spent a couple of days playing with this. While I agree with the comments that shortening the DIA is a good initial approach, the seemingly much higher insulin availability of Fiasp in the first 30 minutes does mean that a new algorithm would probably be a good idea. I'll try to synthesize what I've done and upload it - it's just the math part (not that fancy - just using LINEST() in excel to match the data in the graphs of the PK from the studies), not the code. It is clear that the current approach in Loop is a bit ugly - 3 different fourth order polynomials for DIA = 3,4,5 and then the InsulinMath does a linear interpolation of the IOB depending on the DIA input by the user. It's relatively simple to take the output IOB from those functions, manually generate a new IOB curve by taking the "treatment ratios" (AUC(t) for fiasp/AUC(t) for novolog) from the Fiasp studies, and do a new fit, which I've done. But if we're going to do this I wonder if while we're at it we should look at [https://github.com/LoopKit/LoopKit/issues/90] at the same time. @scottleibrand explains here [https://groups.google.com/forum/#!msg/openaps-dev/w_YNAmaguoc/0R00sksCU4wJ] how the oref0 approach works - I want to try that for Fiasp, using the earlier peak and generating an IOB curve using with that approach and see what treatment ratios that produces. Useful references: [http://onlinelibrary.wiley.com/doi/10.1111/dom.12803/full] [https://www.hindawi.com/journals/cmmm/2015/281589/#B18]
 scottleibrand
commented
7 years ago
scottleibrand
commented
7 years ago Heh, that is an old thread. But as surprised as I would have been at the time to learn it, we're still using that approach in OpenAPS, and rather successfully. The curves we use have peak activity at 75m for a 3h DIA, and all other DIAs are simply stretched from that. So 4h peaks at 100m, and 2h peaks at 50m. Because of that peak time, @tim2000s has been using the OpenAPS 2h-DIA curve with Fiasp, and rather successfully thus far as I understand it.
bashem
commented
7 years ago Looking at the code in LoopKit/InsulinMath, there is no DIA for 2hrs, so the 3h model would be used
switch nearestModeledDuration {
            case TimeInterval(hours: 3):
                return -3.2030e-9 * pow(minutes, 4) + 1.354e-6 * pow(minutes, 3) - 1.759e-4 * pow(minutes, 2) + 9.255e-4 * minutes + 0.99951
            case TimeInterval(hours: 4):
                return -3.310e-10 * pow(minutes, 4) + 2.530e-7 * pow(minutes, 3) - 5.510e-5 * pow(minutes, 2) - 9.086e-4 * minutes + 0.99950
            case TimeInterval(hours: 5):
                return -2.950e-10 * pow(minutes, 4) + 2.320e-7 * pow(minutes, 3) - 5.550e-5 * pow(minutes, 2) + 4.490e-4 * minutes + 0.99300
            case TimeInterval(hours: 6):
                return -1.493e-10 * pow(minutes, 4) + 1.413e-7 * pow(minutes, 3) - 4.095e-5 * pow(minutes, 2) + 6.365e-4 * minutes + 0.99700
            default:
                assertionFailure()
                return 0
}Well here goes nothing. I tried to create new curves for both Loop and OpenAPS. The work is in enclosed spreadsheet. I tried to document everything clearly. Eager for any feedback anyone has. My conclusion is that assuming we believe that Fiasp starts hitting a lot faster, as Novo Nordisk claims and as people have reported, shortening the DIA as a way to approximate the curve shape is better than nothing (and as mentioned seems to be working fine for some). But that approach would appear to involve compromises between matching activity in the first 45 minutes versus matching the tail. And since the whole point of Fiasp is to avoid post-prandial excursions, it seems worthwhile to consider adjusted curve shapes. Example for loop DIA = 4, all the other DIAs are in the spreadsheet.
a^4 2.58154E-10 b^3 -5.56237E-08 c^2 -8.06366E-07 d -0.004278433 intercept 0.987630373
I am doing some more work on the OpenAPS curve to see if we can get a "purer" curve that is produced from user inputs that are intuitive and testable empirically, and does a good job of matching - in line with what @scottleibrand said about the original thinking behind the OpenAPS curves. I'll post that shortly.
 tim2000s
commented
7 years ago
tim2000s
commented
7 years ago I'd be careful on this one at the moment. I started off with DIA of two hours being very effective, and effectively almost no tail, but I've since seen some changes to my body's absorption characteristics with fiasp and until I'm sure what's going on, I'd be loathe to say that the Novo curves are 100% effective every time. By all means do the work but be wary of this factor, as I'm not sure I'm seeing the same level of front loading on the absorption.
jeremybarnum
commented
7 years ago Thanks Tim - yeah for sure this is obviously to be treated with great caution. Mostly I wanted to establish the framework - but it needs to be validated with experience clearly. And as you point out, it's all based on the published "Treatment Ratios" showing ratio of AUC between fiasp and novolog at different points in time. If those are wrong, then my curves will be wrong. And if the starting curves are wrong before getting transformed, then the new curves will also be wrong. I want to experiment with some parameterization to allow the user to create custom shapes based on DIA test that a person can do for themselves - essentially adding some other "dials" to drive curve shape beyond just the DIA.
peterlynton
commented
7 years ago @jeremybarnum Thanks so much for the FiaspCurve excel file - I am aiming to trial it. Am I correct in editing the 4hr line to the following:
return 2.58153954561464E-10 pow(minutes, 4) -5.56237306749063E-08 pow(minutes, 3) -8.06365857215448E-07 pow(minutes, 2) 0.00427843253655648 minutes + 0.98763037314288
jeremybarnum
commented
7 years ago @upsetter looks like you are missing a negative sign in the last term, so the linear term before the intercept? should be -.004278...etc.
Also a few additional things:
-please be careful as I haven't been able to test it. It's just math, trivial change, should be fine, but...
-I assume you were just asking about DIA=4 as an example. If you're going to go through the trouble, you might as well change all 3 DIAs, so that if you change your DIA to something other than 4, it produces reasonable answer.
-if you're willing to do the experiment and are changing the code anyway, I would argue for doing a personalized curve shape test. Recall that everything I did presumes that the existing Novolog curve shapes are right, and that the academic data is right. It's so easy to generate a new polynomial based on your actual experience with the insulin, and update the code accordingly, it's probably worth it...of course the experiment is a pain, and arguably you would want to do it under a few different conditions, and average the result, and you should definitely read @tim2000s blog if you haven't already, but anyway. I was working on a template to facilitate the generation of the polynomial coefficients based on an experiment, I'll try to finish that and upload it. I'm hoping we can do the experiment in my house too, I'm just waiting for the right conditions.
peterlynton
commented
7 years ago Thanks Jeremy, I see the missing negative sign in the last term. I will change the three DIAs at once as suggested. This is a trial and I will be careful. I appreciate that the curves have not been tested in the wild but I'm a willing guinea pig! I will look into a personalised curve shape test, I'm not sure what's involved yet.
jeremybarnum
commented
7 years ago Here is the custom DIA template I mentioned for the personalized curve shape test. Should be pretty self explanatory. Any views/feedback welcomed.
 dm61
commented
7 years ago
dm61
commented
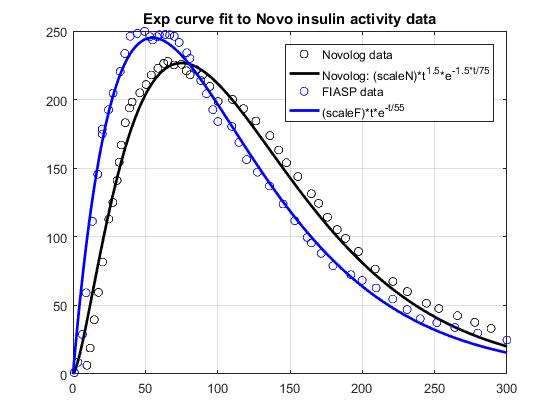
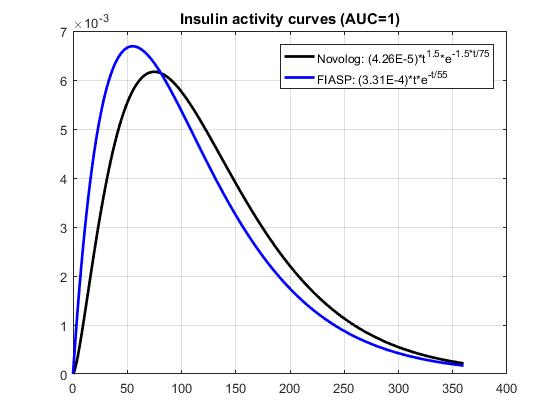
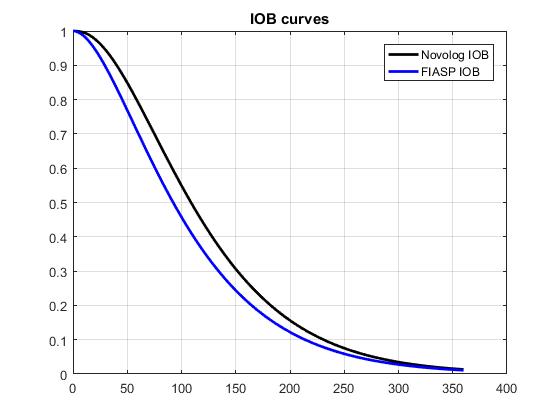
7 years ago Based on Novo data shown in Figure 2 of this document, I fitted exp curves suggested by @tepidjuice. A general form of the curve is: (scale)(t^n)exp(-n*t/tau), where tau = time of peak insulin activity, and n is a parameter that may be used to adjust DIA. Taking the underlying system dynamics into account, n is expected to be 1 or 2. For Novolog, tau = 75 minutes, while n=1.5 gives a better fit to the data than 1 or 2. For FIASP, tau = 55 minutes, and n = 1. The results shown below include 1. a comparison of the data and the curve fits, 2. a comparison of insulin activity curves normalized to AUC=1, and 3. a comparison of the corresponding IOB curves.
jeremybarnum
commented
7 years ago That is really cool @dm61 -- seems like it achieves all the goals at the same time: simple, intuitive functional form with limited number of variables; good fit to published data; and (presumably) ability to easily fit individualized empirical experience as well. Consider me persuaded! If this is the way forward it would also be worth comparing to the current loop Walsh curves so that people know what to expect. Notably, the published data suggests activity all the way out to 6 hours, whereas I believe most users are using DIA between 3 and 4. So perhaps the most appropriate comparison is to compare the output of the Walsh curve for DIA = 4 to a curve that tries to fit that output with appropriate values for n and tau. I'll have a try tonight if I get a second.
 ps2
commented
7 years ago
ps2
commented
7 years ago Yes, I need to see a comparison to the Walsh curves, like I generated for the simple exponential version of this, preferably normalized by AUC, as you've done in the two top graphs.
Another remaining issue is truncating the tail of the decay curve. It's a bit sharp to just lop it off, but maybe that's ok. Might make small kinks in the forecast graphs.
Finally, depending on how we truncate the tail, I'm thinking we'll want to have actual insulin activity out to 5-6 hours, which is probably a reasonable choice for those who had 4 hour DIA set before. The tail is smaller in effect intensity, and should go out a bit longer.
 trixing
commented
7 years ago
trixing
commented
7 years ago Do you have the data to play with somewhere? The curve in the Novolog curve doesn't very well cover the first 10 - 15 minutes of non-activity. You might want to play with shifting the zero point by this time.
On Thu, Jul 6, 2017 at 8:30 PM, Pete Schwamb notifications@github.com wrote:
Yes, I need to see a comparison to the Walsh curves, like I generated for the simple exponential version of this, preferably normalized by AUC, as you've done in the two top graphs.
The other remaining thing is truncating the tail of the decay curve. It's a bit sharp to just lop it off, but maybe that's not an issue. Might make small kinks in the forecast graphs.
— You are receiving this because you are subscribed to this thread. Reply to this email directly, view it on GitHub https://github.com/LoopKit/Loop/issues/388#issuecomment-313480990, or mute the thread https://github.com/notifications/unsubscribe-auth/AAE2arBrYVGIPntPla5-Jwwnk2F387C6ks5sLSfdgaJpZM4MPcQq .
-- Jan Dittmer jdi@l4x.org, http://l4x.org
ps2
commented
7 years ago The charts actually show activity by 10 minutes, and I do observed effects at that point for us as well.
trixing
commented
7 years ago I meant for Novorapid. Talking about this corner of the graph.
On Thu, Jul 6, 2017 at 10:10 PM, Pete Schwamb notifications@github.com wrote:
The charts actually show activity by 10 minutes, and I do observed effects at that point for us as well.
— You are receiving this because you commented. Reply to this email directly, view it on GitHub https://github.com/LoopKit/Loop/issues/388#issuecomment-313505795, or mute the thread https://github.com/notifications/unsubscribe-auth/AAE2al87uFy2fMsucNxuknjpffUxRZoDks5sLT9FgaJpZM4MPcQq .
-- Jan Dittmer jdi@l4x.org, http://l4x.org
ps2
commented
7 years ago Yes, the novorapid graph in the cited paper shows activity by 10 minutes. That's what we use, and I do see activity at that point usually. It may need to be moved over 5 minutes from where it is now. But you can see that even though the activity seems to shoot up fast in the activity curve, it also looks like were still at > 99% IOB at 10 minutes in the COB decay curve.
dm61
commented
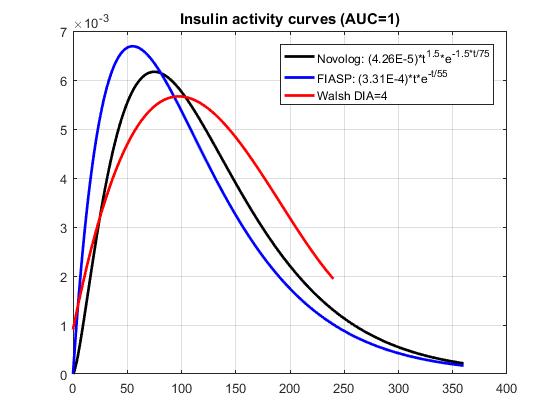
7 years ago Here is a comparison of the exp curves to the Walsh DIA=4h curves.

scottleibrand
commented
7 years ago One idea for dealing with the tail is to shift the entire activity curve downward by the amount of the remaining activity at DIA, and then normalize the resulting curve to AUC=1. That would also end up shifting the early activity slightly right (by subtracting a constant, you end up truncating to activity=0 the first few minutes when activity is lower than at DIA), which might make the early part of the curve more accurate.
dm61
commented
7 years ago Here is a zoom-in plot of the above IOB curves, to see how much error in AUC results from just chopping off the curves at a certain point in time.

ps2
commented
7 years ago So if we lop at 6 hours, we'll be chopping off a little more than 1%. Thanks.
 tepidjuice
commented
7 years ago
tepidjuice
commented
7 years ago Looks promising. I'm travelling at the moment and don't have access to my computer but I have some questions/comments about this. I'd like to try my own fit when I get time. Would someone be able to post the FIAsp and novorapid data?
dm61
commented
7 years ago For reference, attached are excel files with insulin activity data for Novolog and fiasp (digitized by @elnjensen). fiasp_novolog.zip
ps2
commented
7 years ago Ok, @dm61, can you give me the integral (IOB decay) of your curve? :) That is ultimately what Loop uses.
dm61
commented
7 years ago Thought you'd ask for these at some point :)
Novolog: 1-erf(0.1*sqrt(2*t))+0.00212769*sqrt(t)*(t+75)*(exp(-t/50))
FIASP: (t/55+1)*exp(-t/55)
These functions return fraction of IOB remaining after t minutes, just as the Walsh polynomials currently do in InsulinMath. Fortunately, looks like swift Foundation includes erf function.
ps2
commented
7 years ago @dm61 The integral for novolog actually rises for the first 3-4 minutes or so. Any idea why?
Also, there are more mystery values in there as well. What is the 0.1, 2, 0.00213, and 50?
dm61
commented
7 years ago The rise was because the coefficients (0.00213) was rounded up. I've updated the formula so the novolog integral drops monotonically. Here is that coefficient with lots of digits, so you may try to round however you like (but down not up to avoid the initial rise): 0.0021276921621409742961528177573882. The mystery coefficients come from integration of the exp curve for n=1.5, where 50 = 75/1.5, while that 0.00212769... is numerically computed so that the integral of the novolog activity curve from 0 to infinity evaluates to 1. For positive integer n everything comes out nicer, no need for numerically computed coefficients.
ps2
commented
7 years ago I don't think we care that the integral evaluates to 1. It just needs to start near 1 and end near 0 around 6 hours. Does that simplify it? Can we avoid a numerically computed solution that way?
ps2
commented
7 years ago I think that having a model that allows specification of the peak, and some scaling of the tail of the activity curve, and a way to turn that into an integral from 1 to 0, roughly fitting the the exponential model t*exp(-t/tau), would be sufficient. It's less important that we match the published curves closely.
I know the "turn that into an integral" is the tricky part. :)
dm61
commented
7 years ago Would you be open to storing activity curves instead of the integrals? That would imo be the cleanest way to make use of the exp curves, but would unfortunately require more substantial changes in the code.
Or, maybe stick to n=1, and have just one adjustable parameter: the peak time tau? Then the integral would be very easy (t/tau+1)*exp(-t/tau)
ps2
commented
7 years ago I think even if we store activity curves, we need some way of scaling it so that it maps to a unit of insulin in a consistent way, and I think that ultimately means we have to figure out the integral over some period of time.
dm61
commented
7 years ago Scaling activity curves should be much easier using tau (for peak time) and n to control the tail. If there is interest, I'd be happy to give that a try.
dm61
commented
7 years ago Yet another option would be adjustable peak time tau, and a choice of n=1 (shorter tail) or n=2 (longer tail). Those integral would be easy.
dm61
commented
7 years ago ok, I've experimented a bit with a modified exponential activity curve of the form scale*t*(1-t/td)*exp(-t/tau) where tau is no longer the peak time, but can easily be found in terms of peak time and td, and td is set to be 50% longer than Walsh-style DIA. Advantages: activity is guaranteed to be 0 at td, DIA and peak time can be independently adjusted, the shape looks similar to the exp curves we've been looking at, and integral can be found in closed form, so everything is completely scalable, with peak time and DIA being two parameters. A disadvantage is that the fit to the published data is not as great as it was for the original exp curves. Compared below are the curves for Novolog, including the modified scalable exp, the original exp, and the Walsh (DIA = 4); td = 4*1.5*60 = 360 minutes in his case.

 zoom in on the IOB tail:

 sulkaharo
commented
7 years ago
sulkaharo
commented
7 years ago Some of us are now testing @dm61's formulas above with OpenAPS and it seems to work extremely well. My PR for OpenAPS is here: https://github.com/openaps/oref0/pull/568 - let's see if we change these to something completely different before actually merging.
ps2
commented
7 years ago @sulkaharo You've been testing the scalable exponential version?
ps2
commented
7 years ago @dm61 Thanks! That looks great, and I think it will work well. The reason I think scaleability is important is that I've been doing some fitting of coefficients against observed data, and I think that for us, we're seeing even faster peaks, like 45-50 minutes with novolog. So far, based on the (few) datasets I've run the fit on, it seems like that might be common for younger t1ds. For adults, I've been seeing around 75 minutes.
dm61
commented
7 years ago Completely agree that scalability of both peak time and duration is highly desirable. I'll work out details of the above scalable version - more equations coming :)
 mgranberryto
commented
7 years ago
mgranberryto
commented
7 years ago @ps2 I have been using the Novolog exponential curve (((4.26E-5) * Math.pow(minAgo, 1.5) * Math.exp(-1.5 * minAgo / 75))) for several days, but I believe that the duration is a bit long for me, although the peak is in essentially the right place. It has been a marked improvement. The scalable version looks like it is going to be a marked improvement on things, letting me tune the tail end a little bit to remove some falsely-predicted lows. The tail I see in my own data is a little narrower than the non-scaleable curve.
sulkaharo
commented
7 years ago @ps2 we're on Fiasp with the (t/55+1)*exp(-t/55) curve with DIA of 5 hours and it's working extremely well. See my linked oref0 PR for an attempt at allowing peak time customization.
@dm61 scaling the activity curve so AUC is (nearly) constant is easy, but I'd love pointers on how to allow peak time customization and scale the IOB curve sensibly at the same time. The activity curve is more important, but we should have both IOB and activity curves that match with the same parameters.
dm61
commented
7 years ago Scalable exponential curve details:
Parameters: td = duration, Ia(td)=0, IOB(td)=0, tp = peak activity time, both expressed in minutes.
Time constant of exp decay: tau = tp*(1-tp/td)/(1-2*tp/td)
Rise time factor: a = 2*tau/td
Auxiliary scale factor: S = 1/(1-a+(1+a)*exp(-td/tau))
Insulin activity curve: Ia(t) = (S/tau^2)*t*(1-t/td)*exp(-t/tau)
IOB curve: IOB(t) = 1-S*(1-a)*((t^2/(tau*td*(1-a)) - t/tau - 1)*exp(-t/tau)+1);
The above expressions are all exact, there are no approximations involved. Peak time tp, and duration td can be selected independently (within reason): first, td must be greater than 2*tp, otherwise the equations do not work. In reality, td should be significantly greater than 2*tp. If these parameters are left for a user to choose, we should include some restrictions on values allowed, otherwise one may end up with nonsensical insulin absorption models. Also, I am not sure if td should be treated as DIA, or should DIA entered by a user be multiplied by some factor greater than 1 to get td.
To illustrate independent adjustment of td and tp, below are two sets of families of Ia(t) and IOB(t) curves, one with td constant and tp varying, and another with td varying and tp constant.


ps2
commented
7 years ago Working on a notebook that compares this scalable model to existing Loop, and to the published charts.
ps2
commented
7 years ago Question about order of operations on the insulin activity curve:
(S/pow(tau,2))*t*(1-t/td)*exp(-t/tau)
or
(pow(2/tau,2))*t*(1-t/td)*exp(-t/tau)
? Seems to make only a small difference
dm61
commented
7 years ago (S/pow(tau,2))
dm61
commented
7 years ago I've just checked fits to Novolog and FIASP data, both look reasonable with td=360


ps2
commented
7 years ago If anyone wants to compare parameters in this exponential model against their current Loop curve, here is a python notebook to do so: https://github.com/ps2/LoopIOB/blob/master/ScalableExp.ipynb
Edit the params of the last block, and reevaluate
Add setting to select type of insulin A) Novo/Humalog B) FIAsp
If A selected use current curve calculation If B selected use maths to match curve as described on page 12 of http://www.ema.europa.eu/docs/en_GB/document_library/EPAR_-_Product_Information/human/004046/WC500220890.pdf