Deep Learning for the plant disease detection
This is the source code of the experiment described in chapter Deep Learning for Plant Diseases: Detection and Saliency Map Visualisation in a book Human and Machine Learning, 2018.
Training and evaluating state-of-the-art deep architectures for plant disease classification task using pyTorch.
Models are trained on the preprocessed dataset which can be downloaded here.
Dataset is consisted of 38 disease classes from PlantVillage dataset and 1 background class from Stanford's open dataset of background images - DAGS.
80% of the dataset is used for training and 20% for validation.
Usage:
- Train all the models with train.py and store the evaluation stats in stats.csv:
python3 train.py -
Plot the models' results for every archetecture based on the stored stats with plot.py:
python3 plot.pyResults:
The models on the graph were retrained on final fully connected layers only - shallow, for the entire set of parameters - deep or from its initialized state - from scratch.
Model Training type Training time [~h] Accuracy Top 1 AlexNet shallow 0.87 0.9415 AlexNet from scratch 1.05 0.9578 AlexNet deep 1.05 0.9924 DenseNet169 shallow 1.57 0.9653 DenseNet169 from scratch 3.16 0.9886 DenseNet169 deep 3.16 0.9972 Inception_v3 shallow 3.63 0.9153 Inception_v3 from scratch 5.91 0.9743 Inception_v3 deep 5.64 0.9976 ResNet34 shallow 1.13 0.9475 ResNet34 from scratch 1.88 0.9848 ResNet34 deep 1.88 0.9967 Squeezenet1_1 shallow 0.85 0.9626 Squeezenet1_1 from scratch 1.05 0.9249 Squeezenet1_1 deep 2.10 0.992 VGG13 shallow 1.49 0.9223 VGG13 from scratch 3.55 0.9795 VGG13 deep 3.55 0.9949
NOTE: All the others results are stored in stats.csv
Graph

Visualization Experiments
@Contributor: Brahimi Mohamed
Prerequisites:
Train the new model or download pretrained models on 10 classes of Tomato from PlantVillage dataset: AlexNet or VGG13.
Occlusion Experiment
Occlusion experiments for producing the heat maps that show visually the influence of each region on the classification.
Usage:
Produce the heat map and plot with occlusion.py and store the visualizations in output_dir:
python3 occlusion.py /path/to/dataset /path/to/output_dir model_name.pkl /path/to/image disease_name
Visualization Examples on AlexNet:
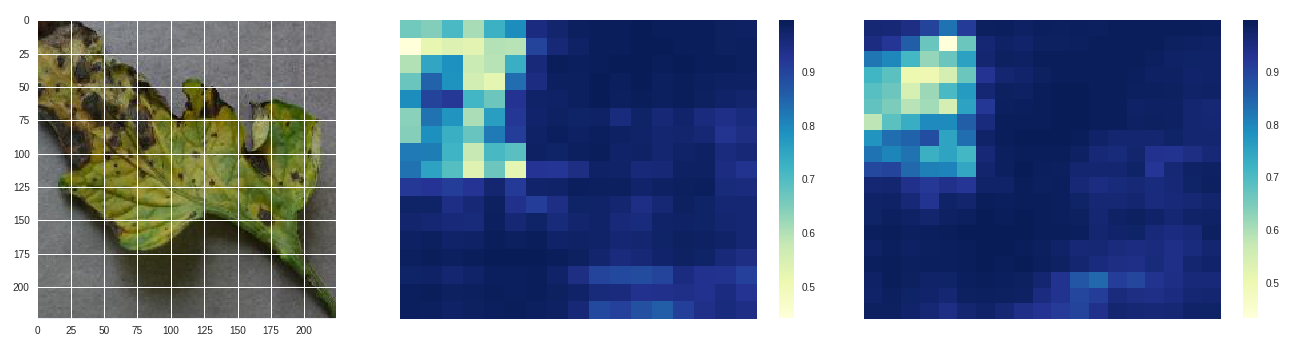 Early blight - original, size 80 stride 10, size 100 stride 10
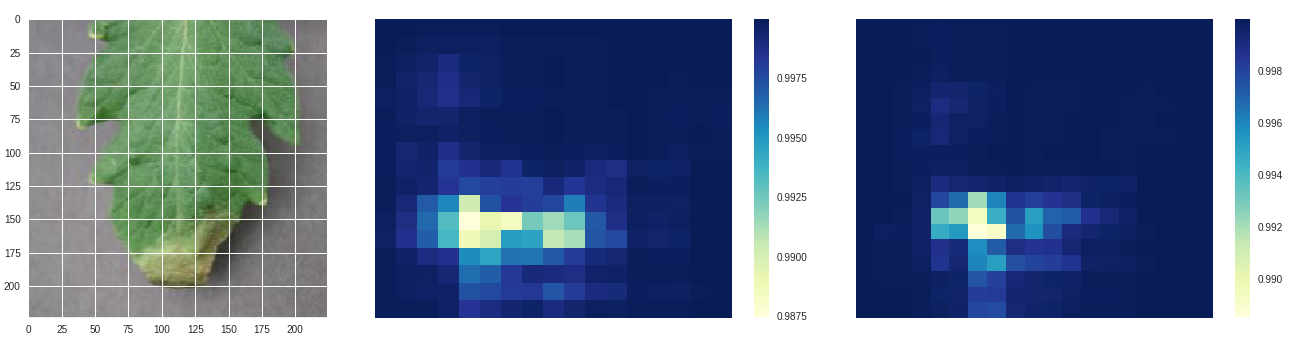 Late blight - original, size 80 stride 10, size 100 stride 10
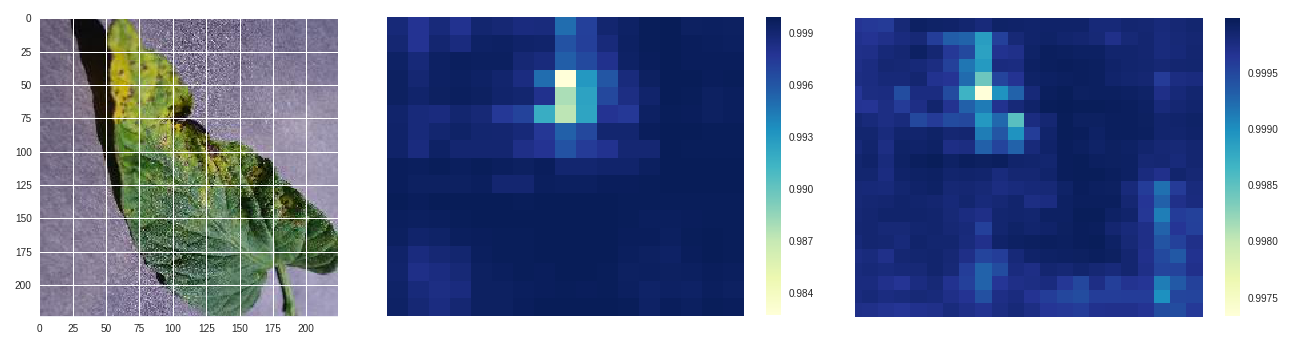 Septoria leaf spot - original, size 50 stride 10, size 100 stride 10
Saliency Map Experiment
Saliency map is an analytical method that allows to estimate theimportance of each pixel, using only one forward and one backward pass through the network.
Usage:
Produce the visualization and plot with saliency.py and store the visualizations in output_dir:
python3 occlusion.py /path/to/model /path/to/dataset /path/to/image class_name
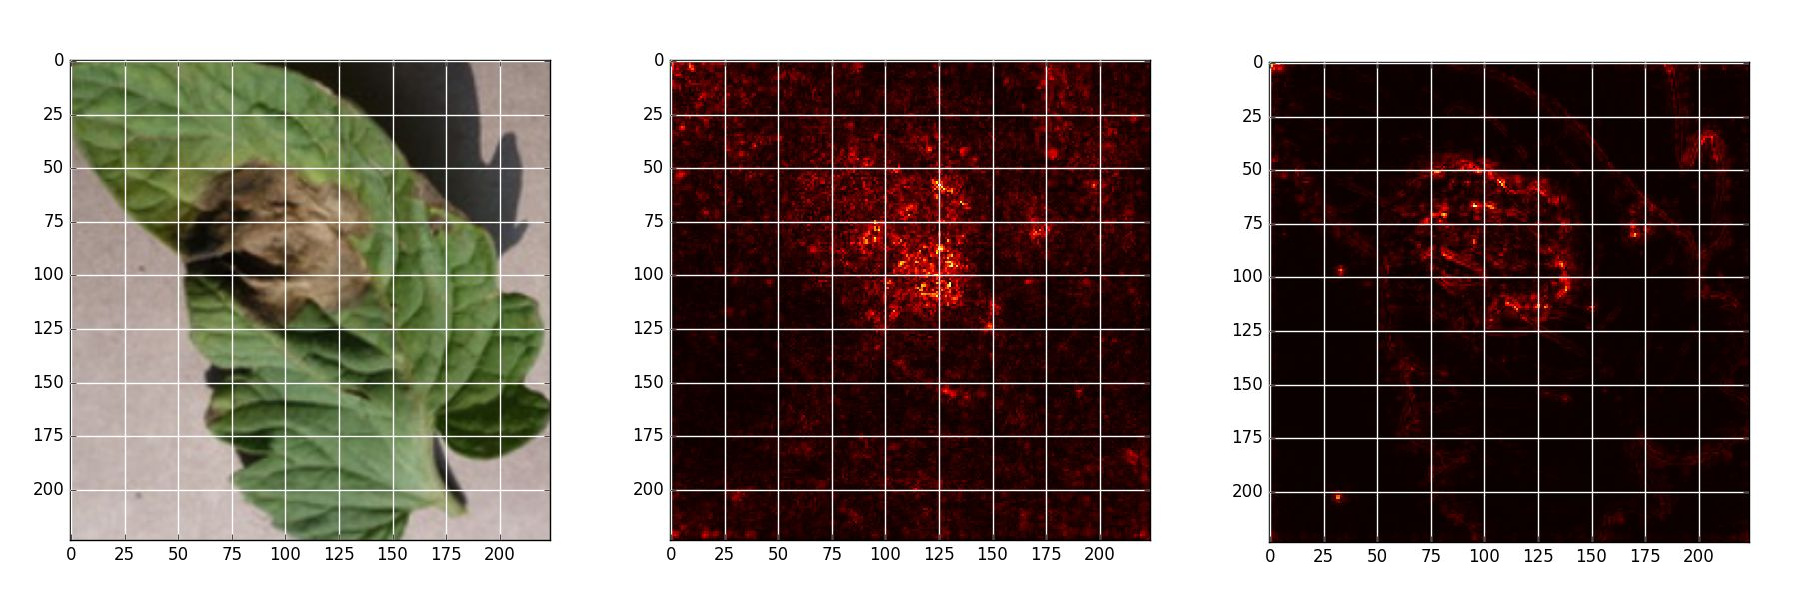
Visualization Examples on VGG13:
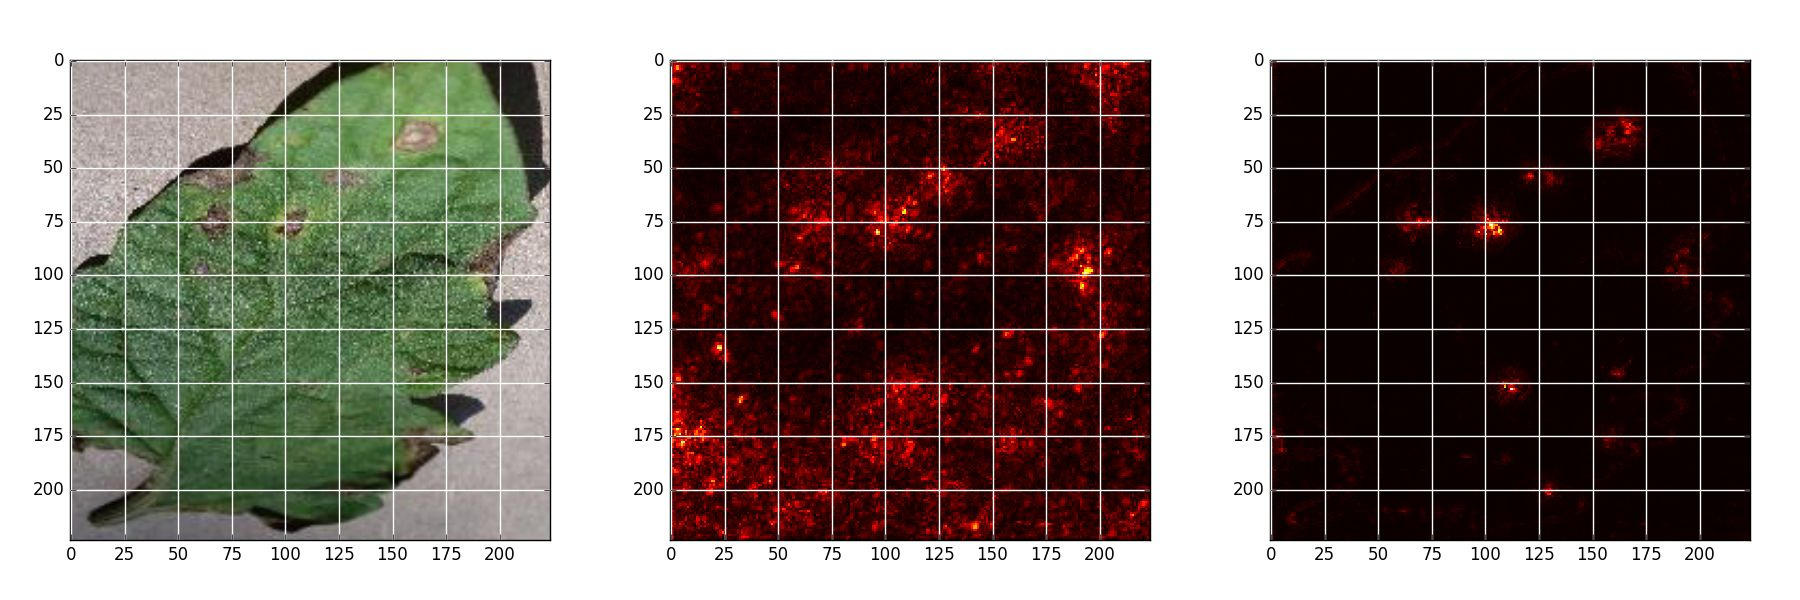 Early blight - Original, Naive backpropagation , Guided backpropagation
 Late blight - Original, Naive backpropagation , Guided backpropagation
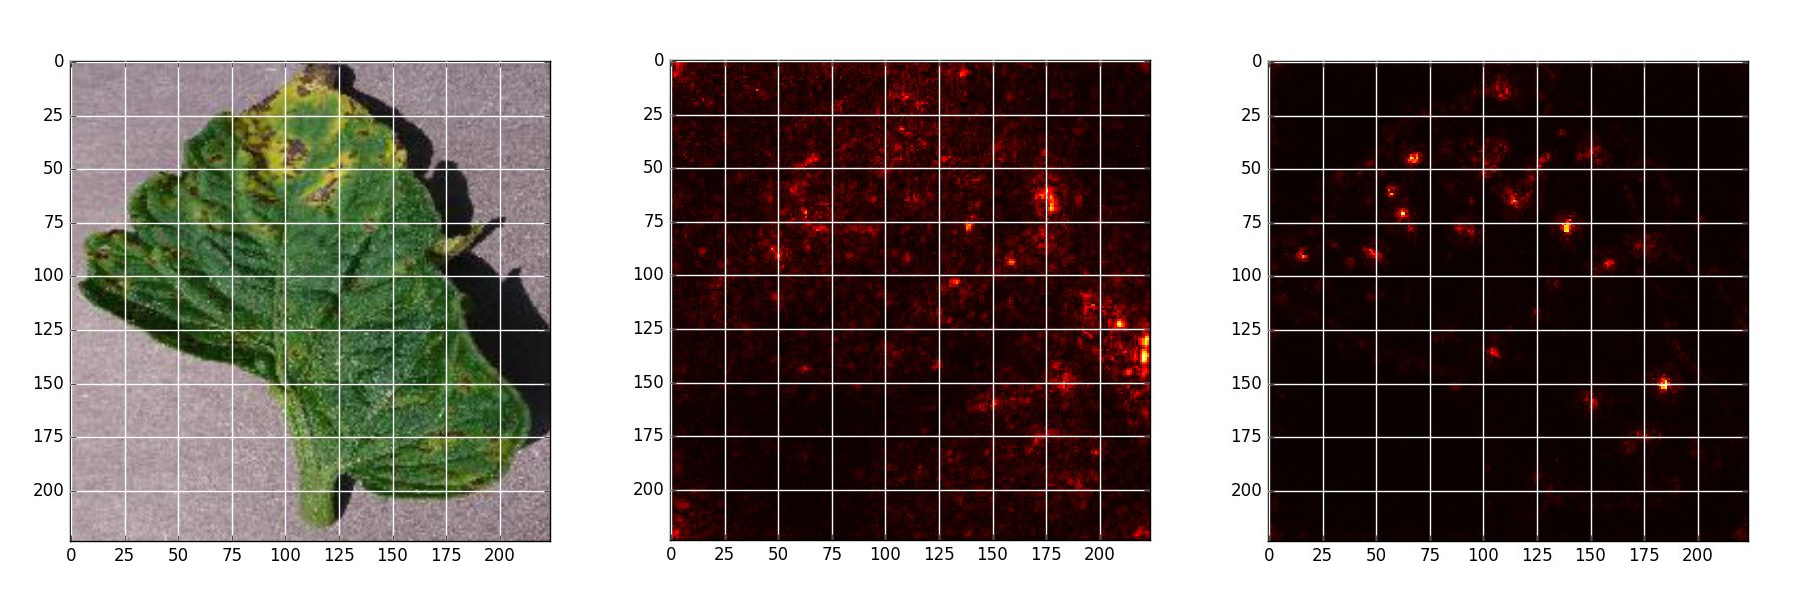 Septoria leaf spot - Original, Naive backpropagation , Guided backpropagation
NOTE: When using (any part) of this repository, please cite Deep Learning for Plant Diseases: Detection and Saliency Map Visualisation:
@Inbook{Brahimi2018,
  author     = "Brahimi, Mohammed and Arsenovic, Marko and Laraba, Sohaib and Sladojevic, Srdjan and Boukhalfa, Kamel and Moussaoui, Abdelouhab",
  editor     = "Zhou, Jianlong and Chen, Fang",
  title      = "Deep Learning for Plant Diseases: Detection and Saliency Map Visualisation",
  bookTitle  = "Human and Machine Learning: Visible, Explainable, Trustworthy and Transparent", year="2018",
  publisher  = "Springer International Publishing",
  address    = "Cham",
  pages      = "93--117",
  url        = "https://doi.org/10.1007/978-3-319-90403-0_6"
}