Overview
This site hosts source code, academic papers, and other resources for three related projects:
- Synoptic : a tool to infer an FSM model from a sequential log.
- CSight : a tool to infer a communicating FSM model from a distributed system's logs
- InvariMint : an approach to declaratively specify model inference algorithms
- Perfume : a tool to infer performance models from system logs.
Introduction
Systems are often difficult to debug and to understand. A typical way of gaining insight into system behavior is by inspecting execution logs. However, manual log analysis is often tedious and labor-intensive. Synoptic and CSight are tools that mine a model of the system that generated the log, thereby simplifying log analysis.
-
Synoptic mines a finite state machine (FSM) model representations of a sequential system from its logs. Two features distinguish Synoptic from other tools.
- Synoptic's models preserve key event ordering invariants mined from the log, making them more accurate.
- Synoptic uses refinement to derive the model, which is more efficient than traditional coarsening algorithms like kTails.
-
CSight mines a communicating FSM model to represent the distributed system that generated a set of logs. Like Synoptic, CSight mines models that preserve temporal properties of the system.
-
InvariMint is an approach to express FSM model inference algorithms in a common framework. The key idea is to encode properties of an algorithms as finite state machines. These properties can then be instantiated for a specific input log of observations and combined to generate/infer a model that describes the observations.
-
Perfume extends Synoptic to account for resource utilization information often available in system logs. Perfume-generated models are FSM models with resource information annotating the event transitions. The algorithm extends trivially to arbitrary integer-valued resources, such as time, memory utilization, network throughput, etc. Perfume mines temporal properties with performance constraints from the log and uses these properties to identify and remove imprecise generalizations in the Synoptic model inference process. See this page to learn more about Perfume.
For users
-
Synoptic
- Works on Linux/OSX/Windows.
- Try Synoptic in your browser (build a .war file from repository and deploy on your tomcat-based server)
- Tutorial explains how to use the various web app features
- Installation instructions
- Tutorial : explains how to get started with using Synoptic from scratch
- Fast-paced usage primer : includes many examples but not as detailed as the tutorial
- Help screen : command line usage reference
-
CSight
- Work on Linux and OSX, does not work on Windows (McScM dependency).
- Help screen : command line usage reference
-
InvariMint
- Works on Linux/OSX/Windows.
- Help screen : command line usage reference
-
Perfume
- Works on Linux/OSX/Windows.
- Help screen : command line usage reference
- A high-level description of Perfume (including a video)
For academics
-
Synoptic:
- FSE'11 conference paper : describes Synoptic's approach at length and evaluates Synoptic both formally and with a few case studies.
- SLAML'10 workshop paper : introduces Synoptic's algorithms
-
CSight:
- ICSE'14 conference paper : describes the approach and evaluates CSight formally and with a user-study.
- SLAML'11 workshop paper : motivates and defines temporal invariants for partially ordered logs, and gives three algorithms for mining these invariants.
-
InvariMint:
- ICSE'13 conference paper : describes the InvariMint approach in detail.
-
Perfume:
- ASE'14 conference paper : describes the Perfume algorithms and properties in detail; evaluates the tool in a user study and on TCP logs and on logs from related work.
- ICSE'14 NIER paper : motivates perfume and briefly overviews the approach.
For developers
-
Development guide : general overview for developers working on the project
-
Development practices : describes the project's socio-technical processes and workflows
-
GWT Development guide : describes how to get the GWT interface up and running
A synoptic example
1. Lets say you are implementing the two phase commit protocol. You wrote your code, and as part of debugging you included print statements that output a log like the following:
src : 2, dst : 0, timestamp : 16, type : propose, txid : 1
src : 2, dst : 1, timestamp : 17, type : propose, txid : 1
src : 0, dst : 2, timestamp : 18, type : abort, txid : 1
src : 1, dst : 2, timestamp : 19, type : commit, txid : 1
src : 2, dst : 0, timestamp : 20, type : tx_abort, txid : 1
src : 2, dst : 1, timestamp : 21, type : tx_abort, txid : 1
..
2. You then thoroughly tested and debugged the code, and eventually deployed it. After a week of executing thousands of two-phase commit rounds you discover an application-level inconsistency. This leads you to look at the accumulated log:
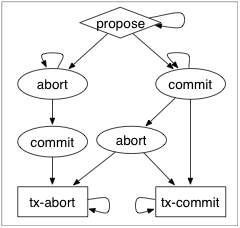
3. Uh oh. Your first challenge -- to make sense of the thousands of lines in front of you. Your second challenge -- find clues that might lead you to a potential root cause. You fire up Synoptic with:
$ ./synoptic.sh -r '.+ timestamp :(?<DTIME>), type :(?<TYPE>), txid :(?<txId>)' -m '\k<txId>' logfile.txt -o twopc-graphAnd you get the following output:
4. You realize that this graph output differs from the graph that you generated while testing your code:
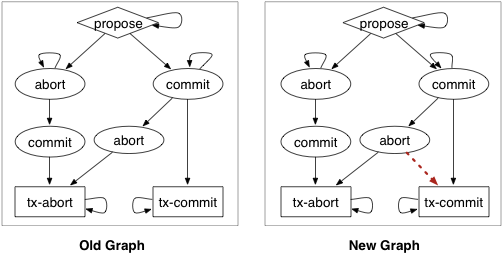
You then find exactly where this discrepancy occurs in the log file, and go on from there.
Related projects
- ShiVector : a tool to augment logs of distributed systems with partial ordering information
- ShiViz : a tool to visualize partially ordered distributed logs (try it!)
Support
YourKit is kindly supporting the Synoptic project with its full-featured Java Profiler. YourKit, LLC is the creator of innovative and intelligent tools for profiling Java and .NET applications. Take a look at YourKit's leading software products: YourKit Java Profiler and YourKit .NET Profiler.