ai_project_group_8
A data analysis class project for Columbia University's AI bootcamp.
An Outlook on AI Jobs
 *EDA on AI Jobs*[^1]
Project Team Members:
- Nathan Anecone
- Kalvin Anglin
- Peta-Gaye McKenzie
- Odele Pax
- Funda Subasi
Table of Contents
Abstract
Project Details
-
The objective of our EDA was to address concerns about the oversatuaration of applicants for AI jobs given the increased popularity of the field by examining the job market trends for these positions. Initially, our parameter for exploring AI jobs was broad and included how trends for this position have impacted many different job sectors, resulting in the following key questions:
- What industries are benefitting the most from AI?
- Where is the largest demand for AI Jobs? / Insight into workplace flexibility.
- How has education adapted to technical job needs?
- What skillsets are the most desirable for AI Jobs?
-
Thesis/Hypothesis: As we see continued growth in tech sectors, will we see education adapt to evolving skillset needs, along with organizations within the sector offering broader workplace flexibility.
The following term are used interchangeably throught the project given the overlap in definitions:
AI : Development of computer systems capable of performing tasks that typically require human intelligence
ML : Method of analyzing data to help AI computer systems optimize their functionatility as they learn from vast quantities of data-based scenarios.[^2]
Data
Datasets
We reviewed datasets that provided the most opportunity for a thorough exploration of our key questions:
-
Combined data from US Census API for 2012 - 2022: https://www.census.gov/data/developers/guidance.html
-
LinkedIn Job Postings for 2023: https://www.kaggle.com/datasets/joebeachcapital/linkedin-jobs
-
AI Companies and Profit by Sector for 2022: https://www.kaggle.com/datasets/hansrobertson/american-companies-profits-and-benefits-from-ai
-
AI Models Index: https://www.kaggle.com/datasets/manavgupta92/from-data-entry-to-ceo-the-ai-job-threat-index
| Data Phases | Details |
|---|---|
| Fetching | Google searches, Kaggle, LinkedIn, Census API search |
| Software Version Control | Repository created on GitHub, GitHub Projects used to create and track tasks based on key questions, Git branch used to upload files to from local computer to remote repository, utilized "compare & pull requests" to compare branch changes before merging into the main branch correlation, comparison, summary statistics, sentiment analysis, and time series analysis |
| Exploration | Imported CSV files, created dataframes, utlized pandas and python functions to search and select data related to AI jobs, identifying job sectors, experience levels, skills, and employment trends for further analysis |
| Preparation & Cleanup | Utilized dictionarys, list, loops, column slicing, string manipulation, to ensure high quality and structured data is visualized and fed into the machine to identify patterns, correlation, and predictive analysis |
Methods
AI Models
AI Jobs Index dataset was read into notebook to analyze the trends in AI model in comparison to the human workforce. Data was clean and grouped by Sector to calculate the proportion of Human Tasks to AI Models.
AI Sectors and Profits:
AI company and profit dataset was read into notebook to analyze AI trends in number of companies and profit by sector. Grouped certain AI sectors in the dataframe by creating a group_sector() function to loop through a keywords list and replace certain sectors with the appropriate keyword. Performed further analysis through aggregate functions to count the number of AI companies and sum of profits for the top twenty AI Sectors. Used visualization to explore results.
Tech Workplace Flexibility and Job Level:
LinkedIn dataset comprised of tech job postings was read into notebook to analyze trends in job levels and job types for the tech sector in the US and abroad. Grouped the dataframe by job level and job type to count the occurences and determine correlation between seriority and workplace flexibility. The job type represented a onsite, remote, or hybrid workplace model. Analyzed the concentration of the respective job types through visualizations. Investigated the top five AI skills required for Associate, Mid, and Senior level AI jobs by applying string match to the dataset to get all AI job listings based on a list of keywords for AI skills. Utilized the count_skill() function, passing in the AI job dataframe and the job level as parameters. Visualized the top three skills by job level for further analysis.
US Census Predictions
Imported Prophet and previously compiled data from US Census API for years 2012 - 2022 which was analyzed to determine the relationship between tech-related jobs, education levels, and unemployment rates.
Certain column fields from the source dataset were included in the import and other columns were sliced into dataframes to calculate necessary fields. The "Year" column was converted into Datetime format for future use with Prophet. All states were represented in each given year of the dataset, which allowed for grouping by "Year", aggregating by "mean()" , and plotting on a 10-year timeline to visualize national trends in education levels and the percentage of population working in the tech-related field.
Passed data slices into Prophet to provide a 5 years prediction for percentage change in Tech Fields, No Education, Profeessional Education, Unemployment, Bachelor's Degree Completion, Associates Degree Completion, High School Degree Completion, and GED Completion.
AI vs Non-AI Software Developers:
Used LinkedIn dataset for further exploration of employment trends. Performed a comparative analysis to determine the relative proportion of AI jobs to non-AI jobs by applying string match to the dataset to get all job listings based on a list of keywords for AI skills. AI listing and non-AI listings were assigned to separate dataframe for porportion calculation and visualization.
Investigated which skills were most in demand for AI jobs by using the list of keywords for AI skills and the dictionary() to construct a new dataframe using the keywords as keys and the frequencies of the skills within the dataset as the values. Created count_skill() function that passed in AI skills and a label_mapping dictionary to sum AI keyword labels together based on skill and account for the demand in AI skills that weren't controlled by the AI keywords term filter. Peformed comparative analysis on the demand for top twenty software skills, for AI and non-AI jobs to measure the degree of skills overlap in tech sector by applying a data mask.
Performed analysis to determine the relative proportion of the job level required for AI positions to job level required for non-AI positions using the respective dataframe and calling the "job level" column. Investigated the difference in minimum years of experience between AI-related and general tech roles by parsing out years of experience from the posting and a regex heursitic to handle the repetition of certain text in the job description. Analyzed the national distribution of AI and Non_AI jobs by State using a list of State abbreviations and a get_location() function, as well as the proportional distribution of AI to non_AI jobs by State.
Results
Findings
AI Sectors and Profits
Analysis of the number of companies and the respective profits showed that the tech sector had the most companies and the highest profit, justifying a deeper exploration into the tech field and AI trends.
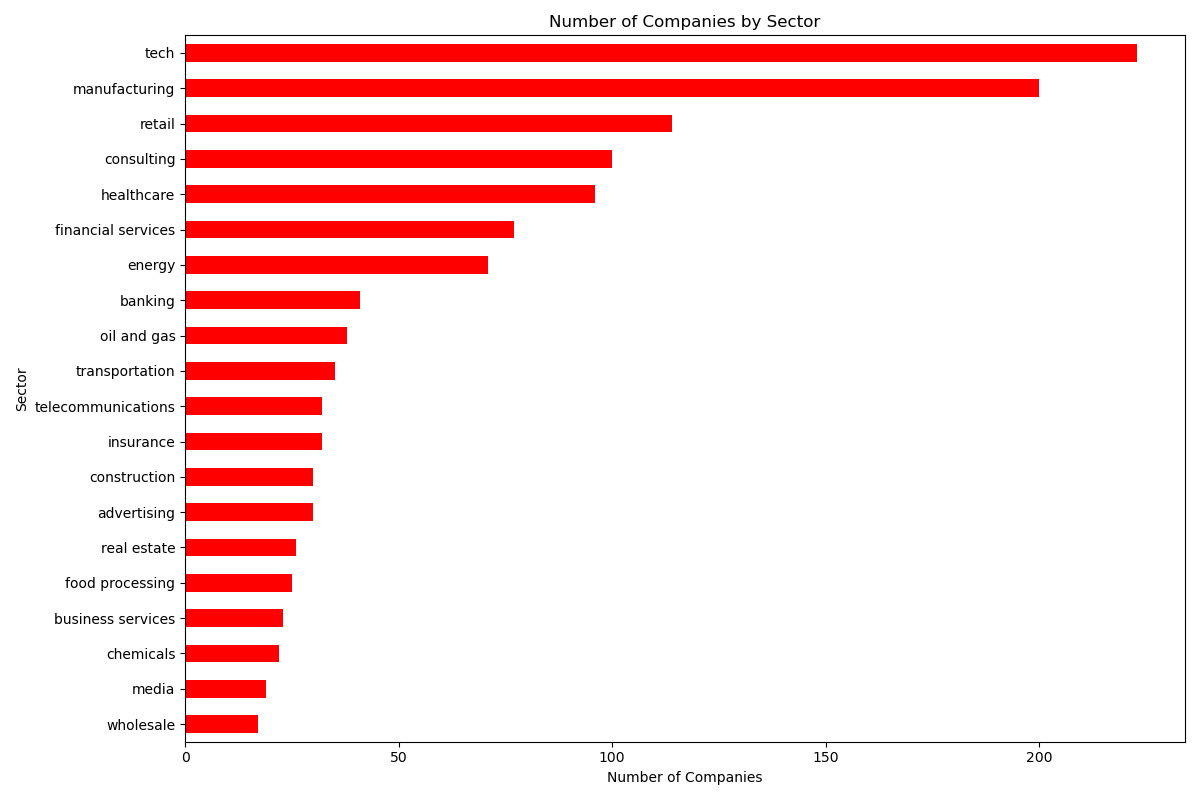
Number of AI Companies by Sector
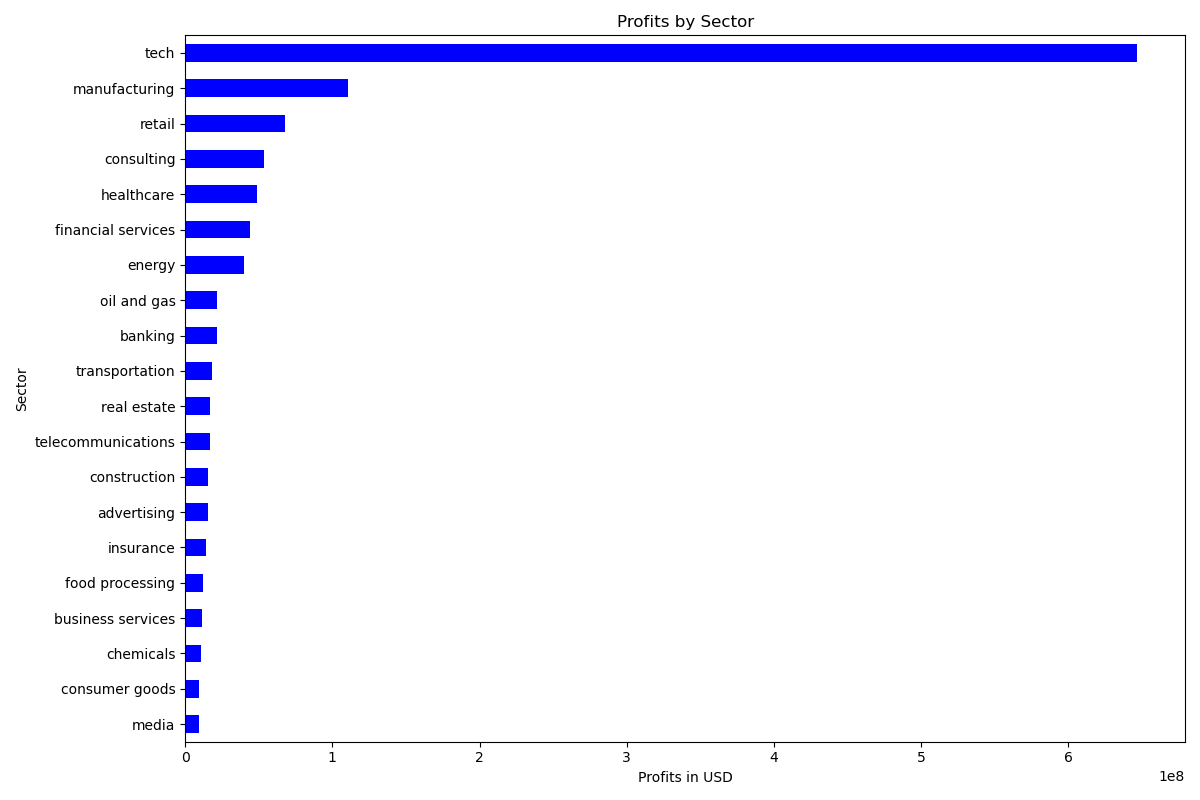
Number of AI Profits by Sector
AI Models
Analysis proportions of replaceable "Human Tasks" to "AI Models" revealed the increase in the workforce has resulted in 22% AI workload, meaning for every individual human task, there are 4-5 AI models being trained as replacements. This shift to a more technological landscape raises many questions while providing insight on future employment trends.
Tech Workplace Flexibility and Job Levels:
Analysis of workplace flexibility in correlation job level showed that the majority of postings for both Associate and Mid-Senior level roles were listed as 'onsite'; however but both job levels offered flexibilty with >40% of the total Associate roles and >50% of Mid-Senior roles falling in the Remote-Hybrid category.
Findings also pointed to a preference for on-site, mid-senior level candidates for the United States, Canada, United Kingdom, Australia, which were the four countries in the dataset. The samples for non-U.S. countries were not included in other parts of the project's analysis, but the data showed opportunities for tech positions across borders for U.S. candidates.
US Census Predictions:
Analysis showed a that although the percentage of the population earning a traditional Associates, Bachelors, or Masters Degree has remained steady, there has been an increase in the percentage of population exploring professional education opportunities similar to this AI Boot Camp. The correlation ratio between tech-related jobs and professional education was 1:0.997, which was one of the strongest correlations in the data.
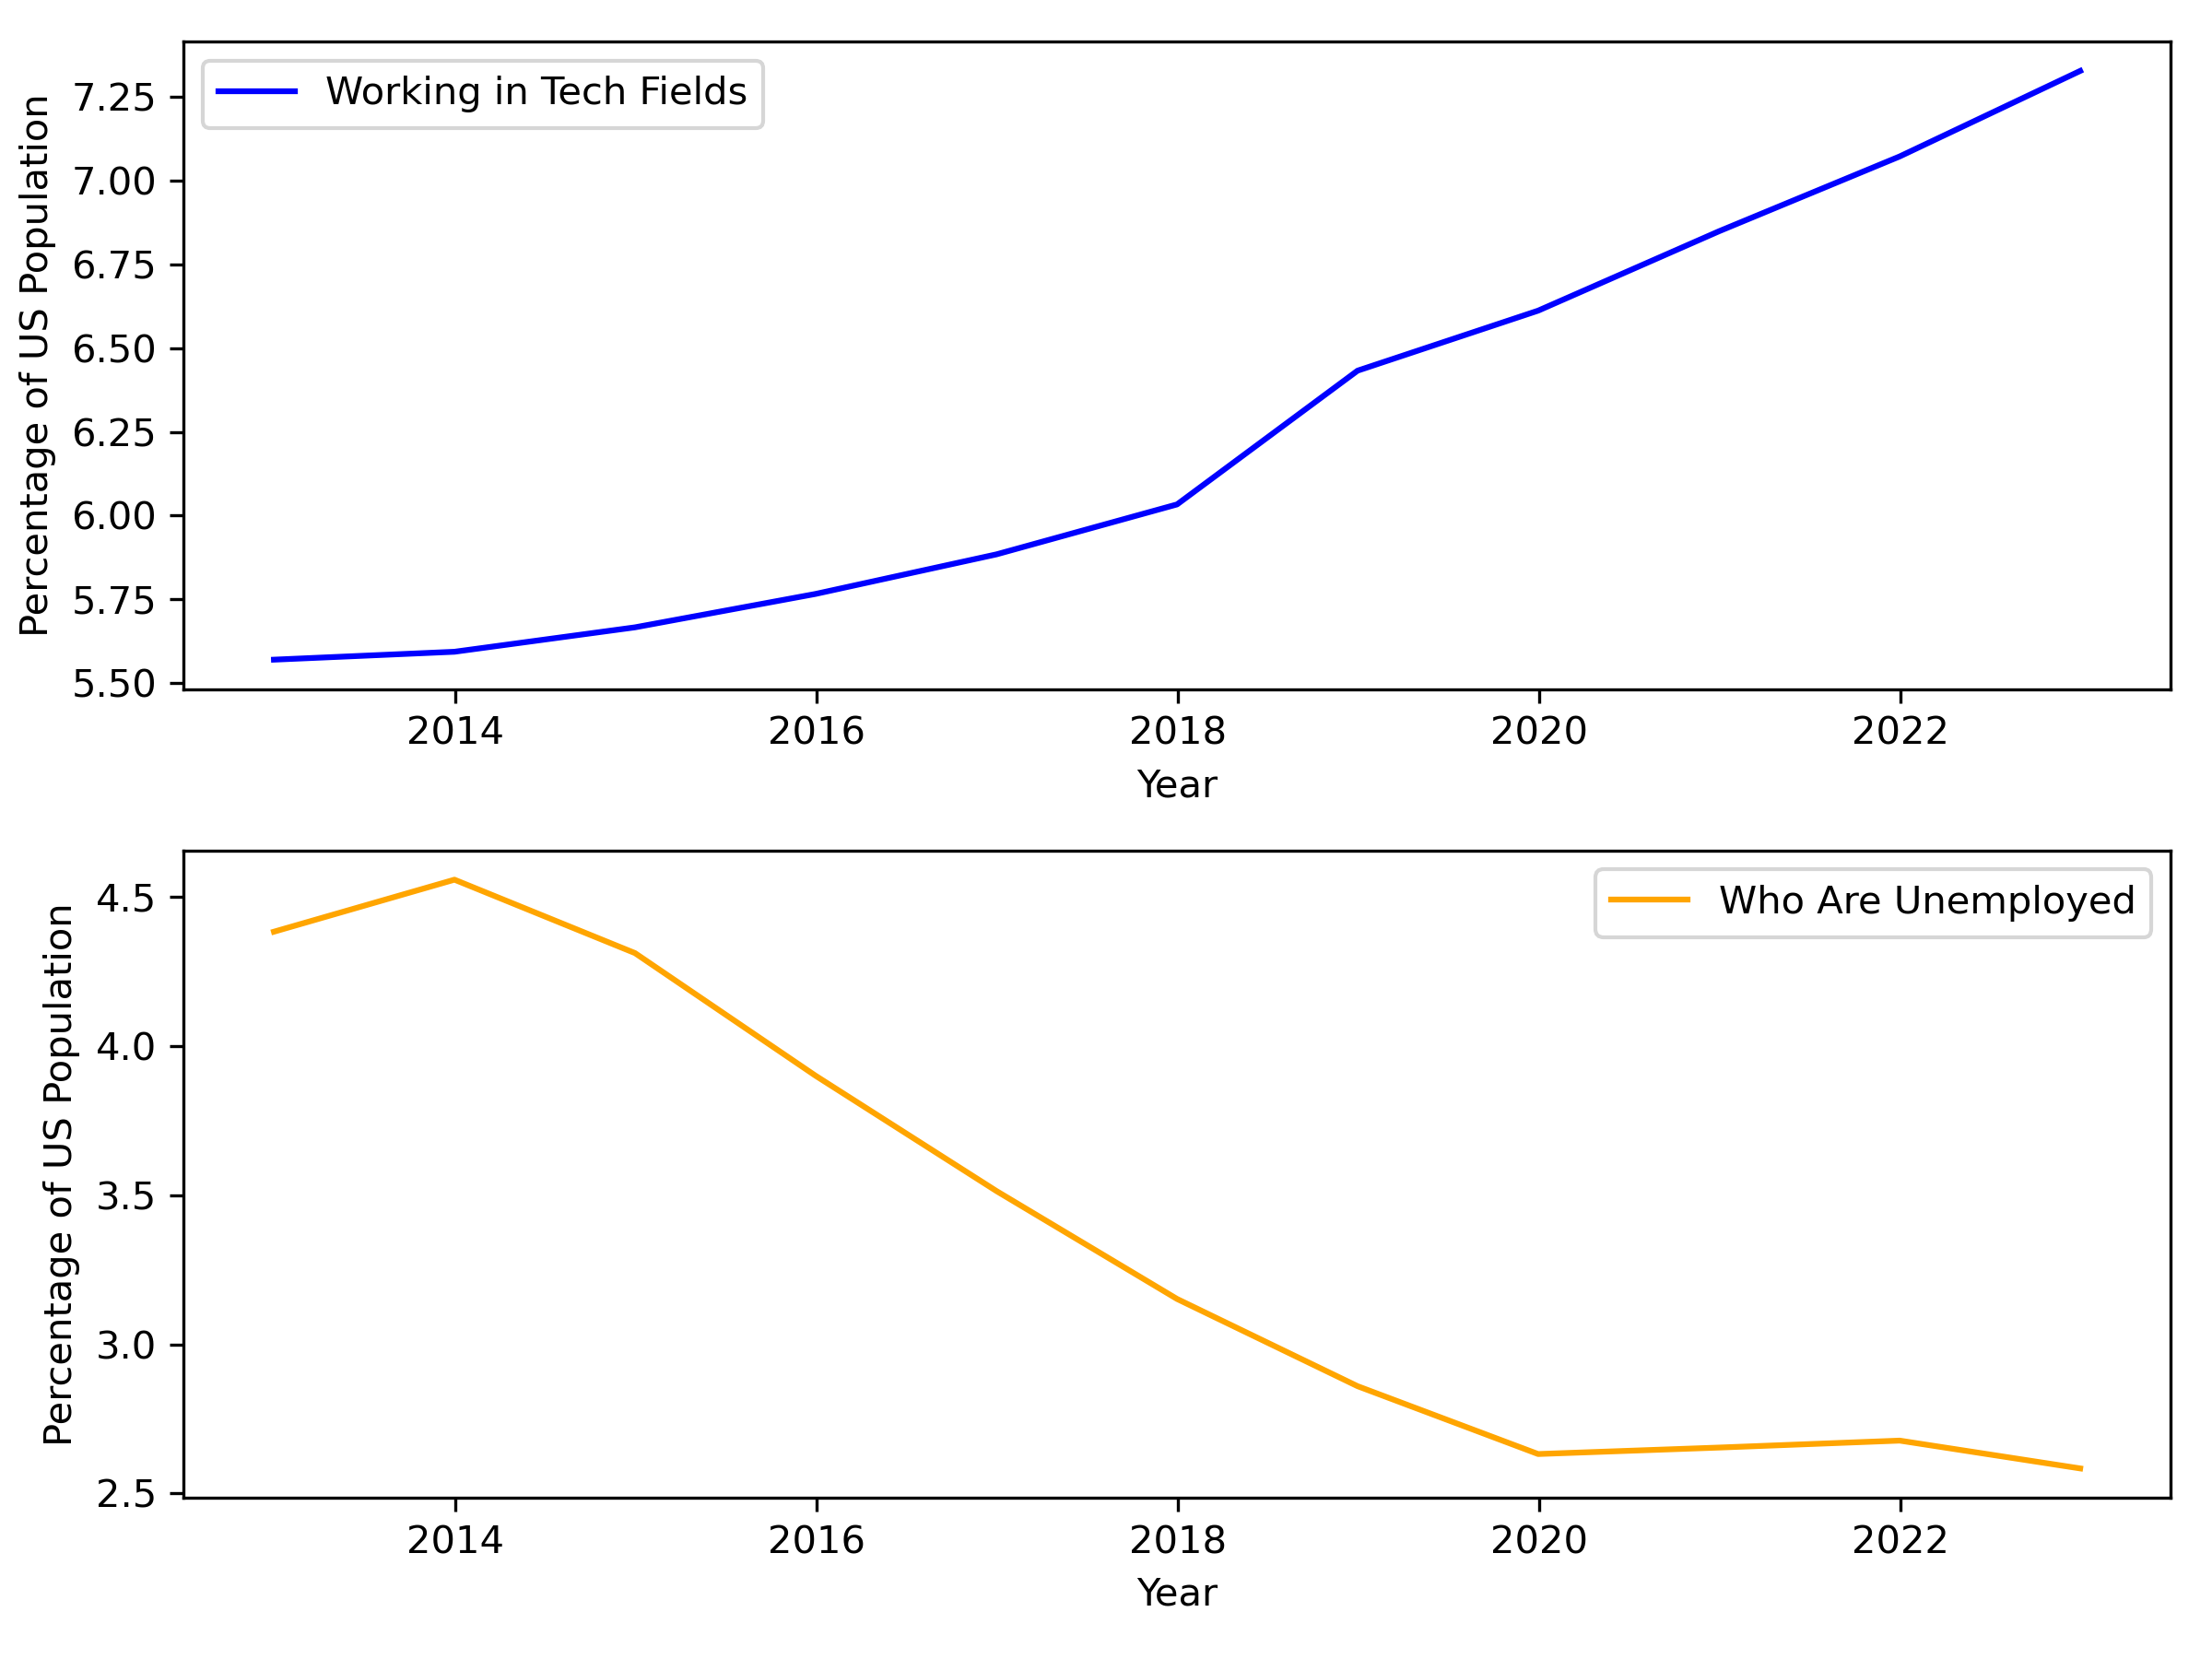
Tech & Unemployment Trends
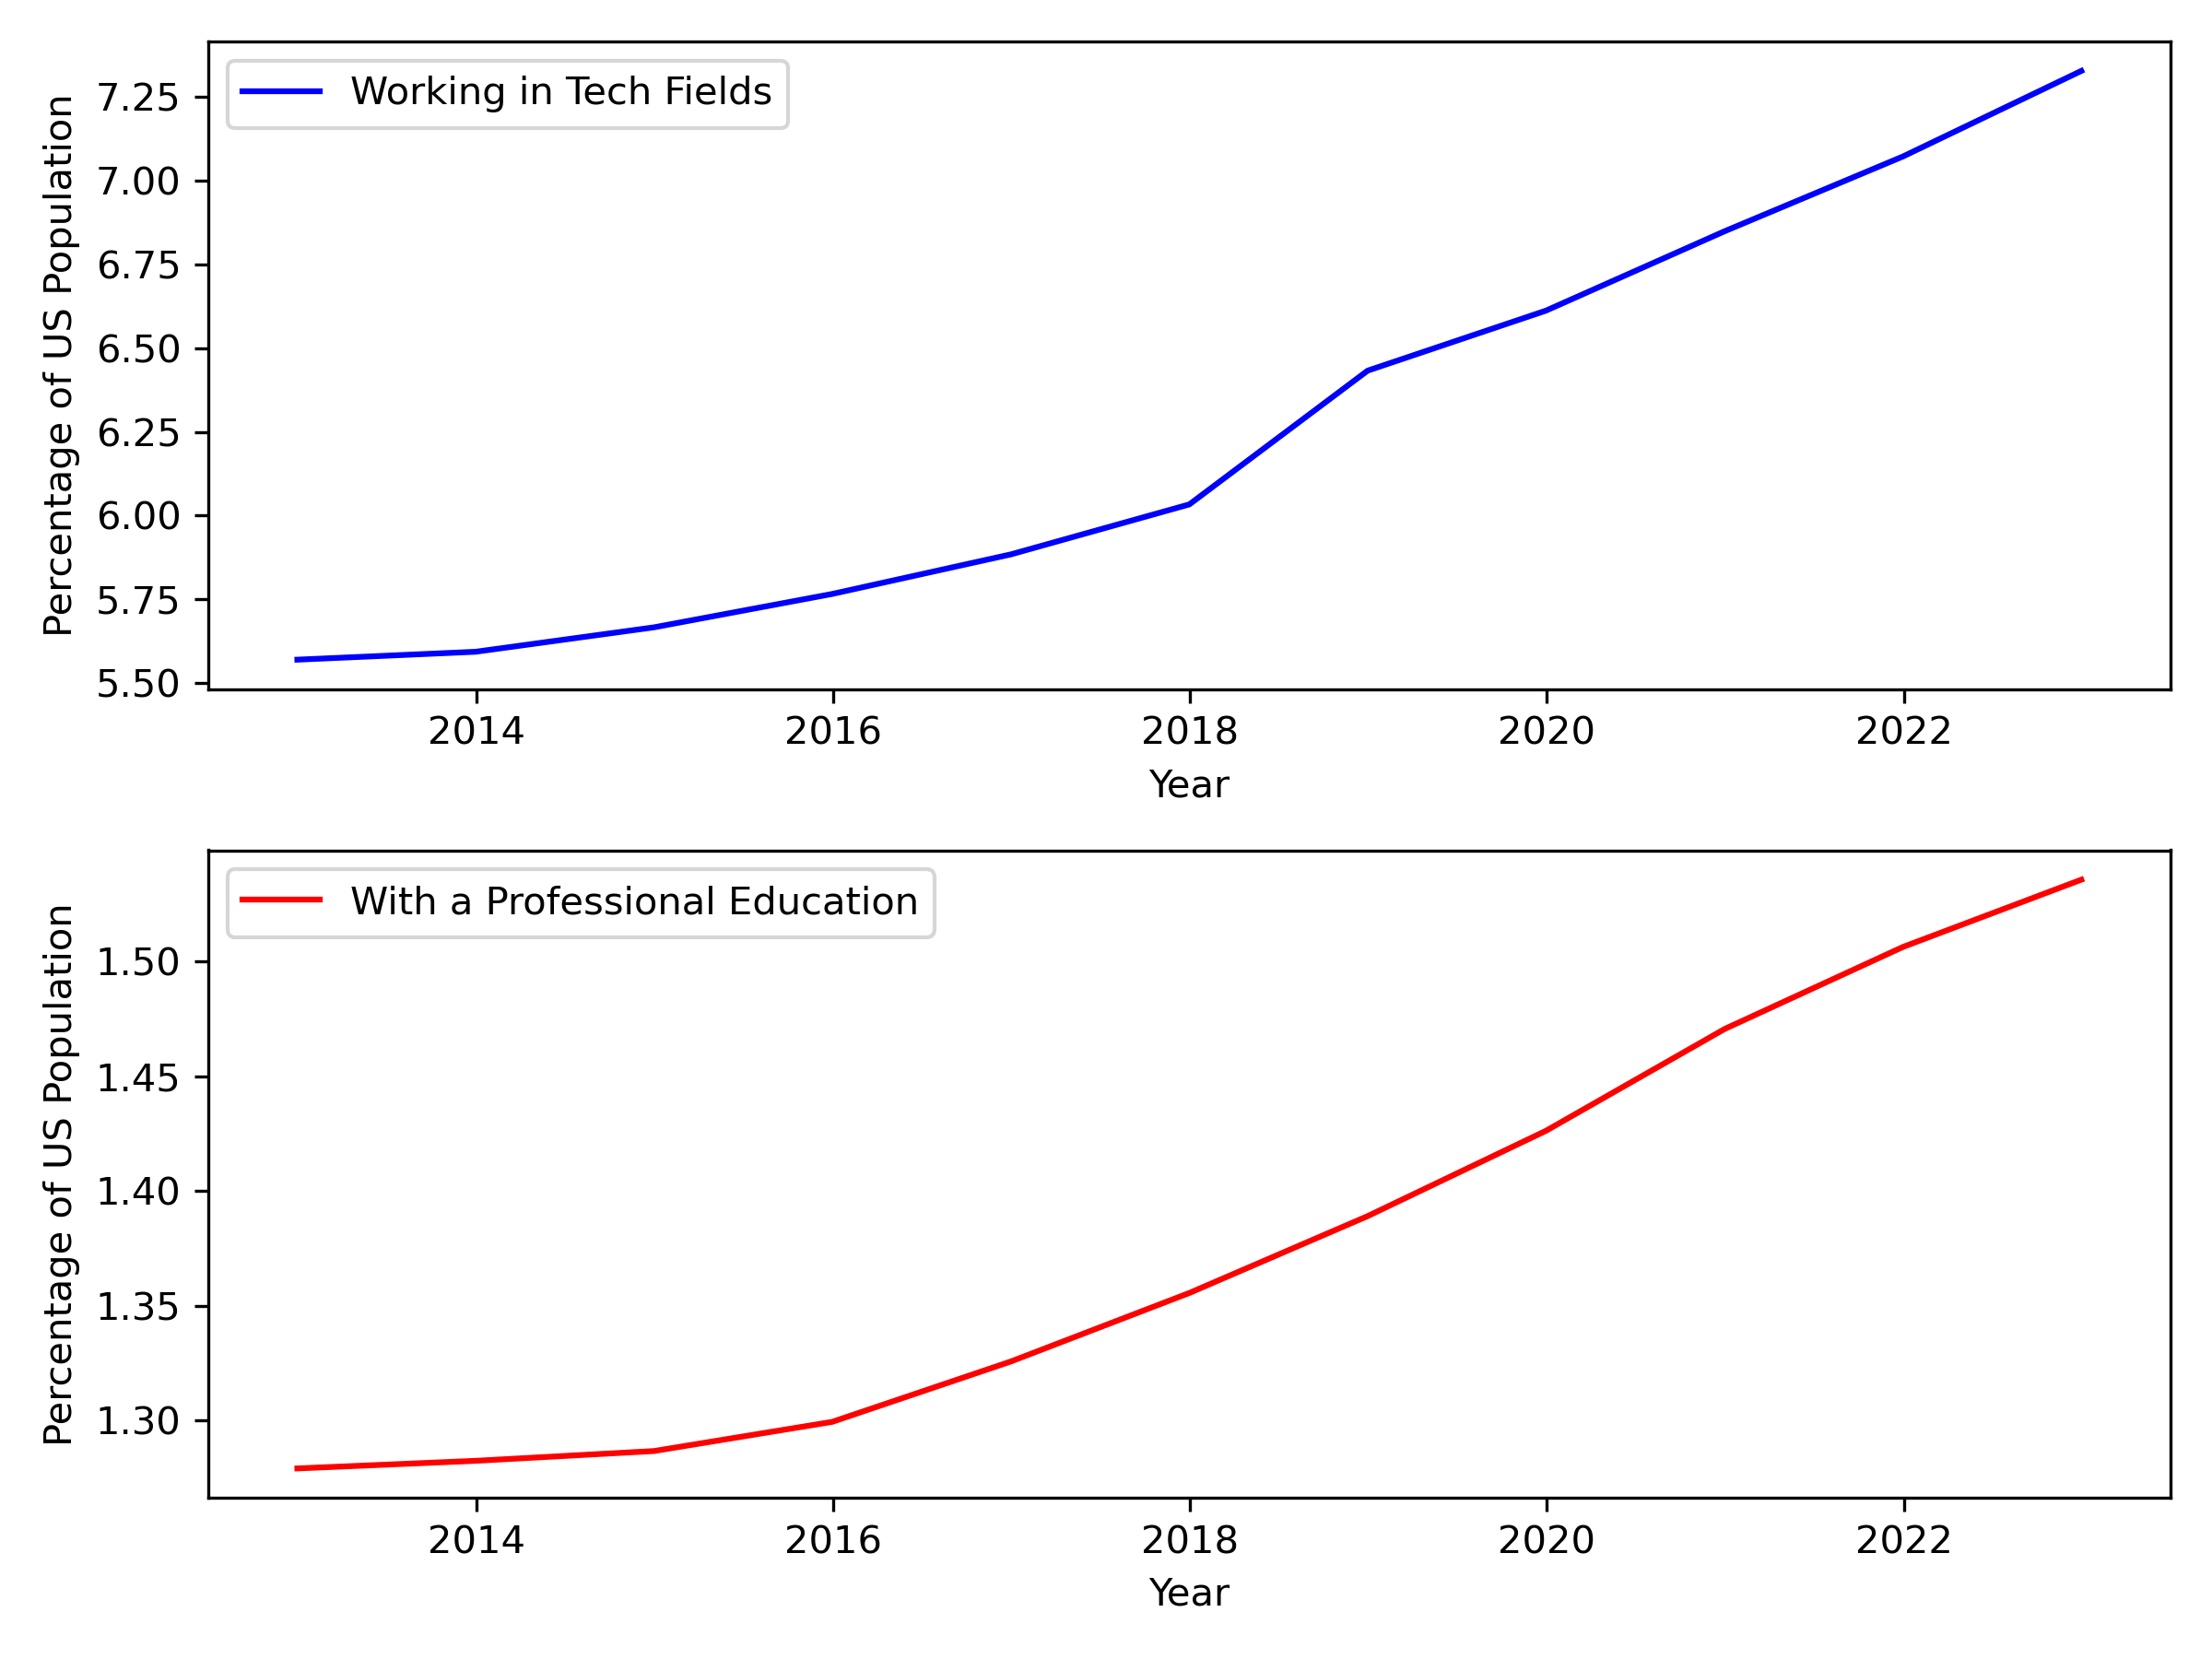
Tech & Profession Education Trends
The predictive analytics show growth in the population seeking alternative forms of education to meet the demand of specific skillset required for AI jobs and other positions in the tech sector and show a national trend moving towards accelerated and flexibility learning options.
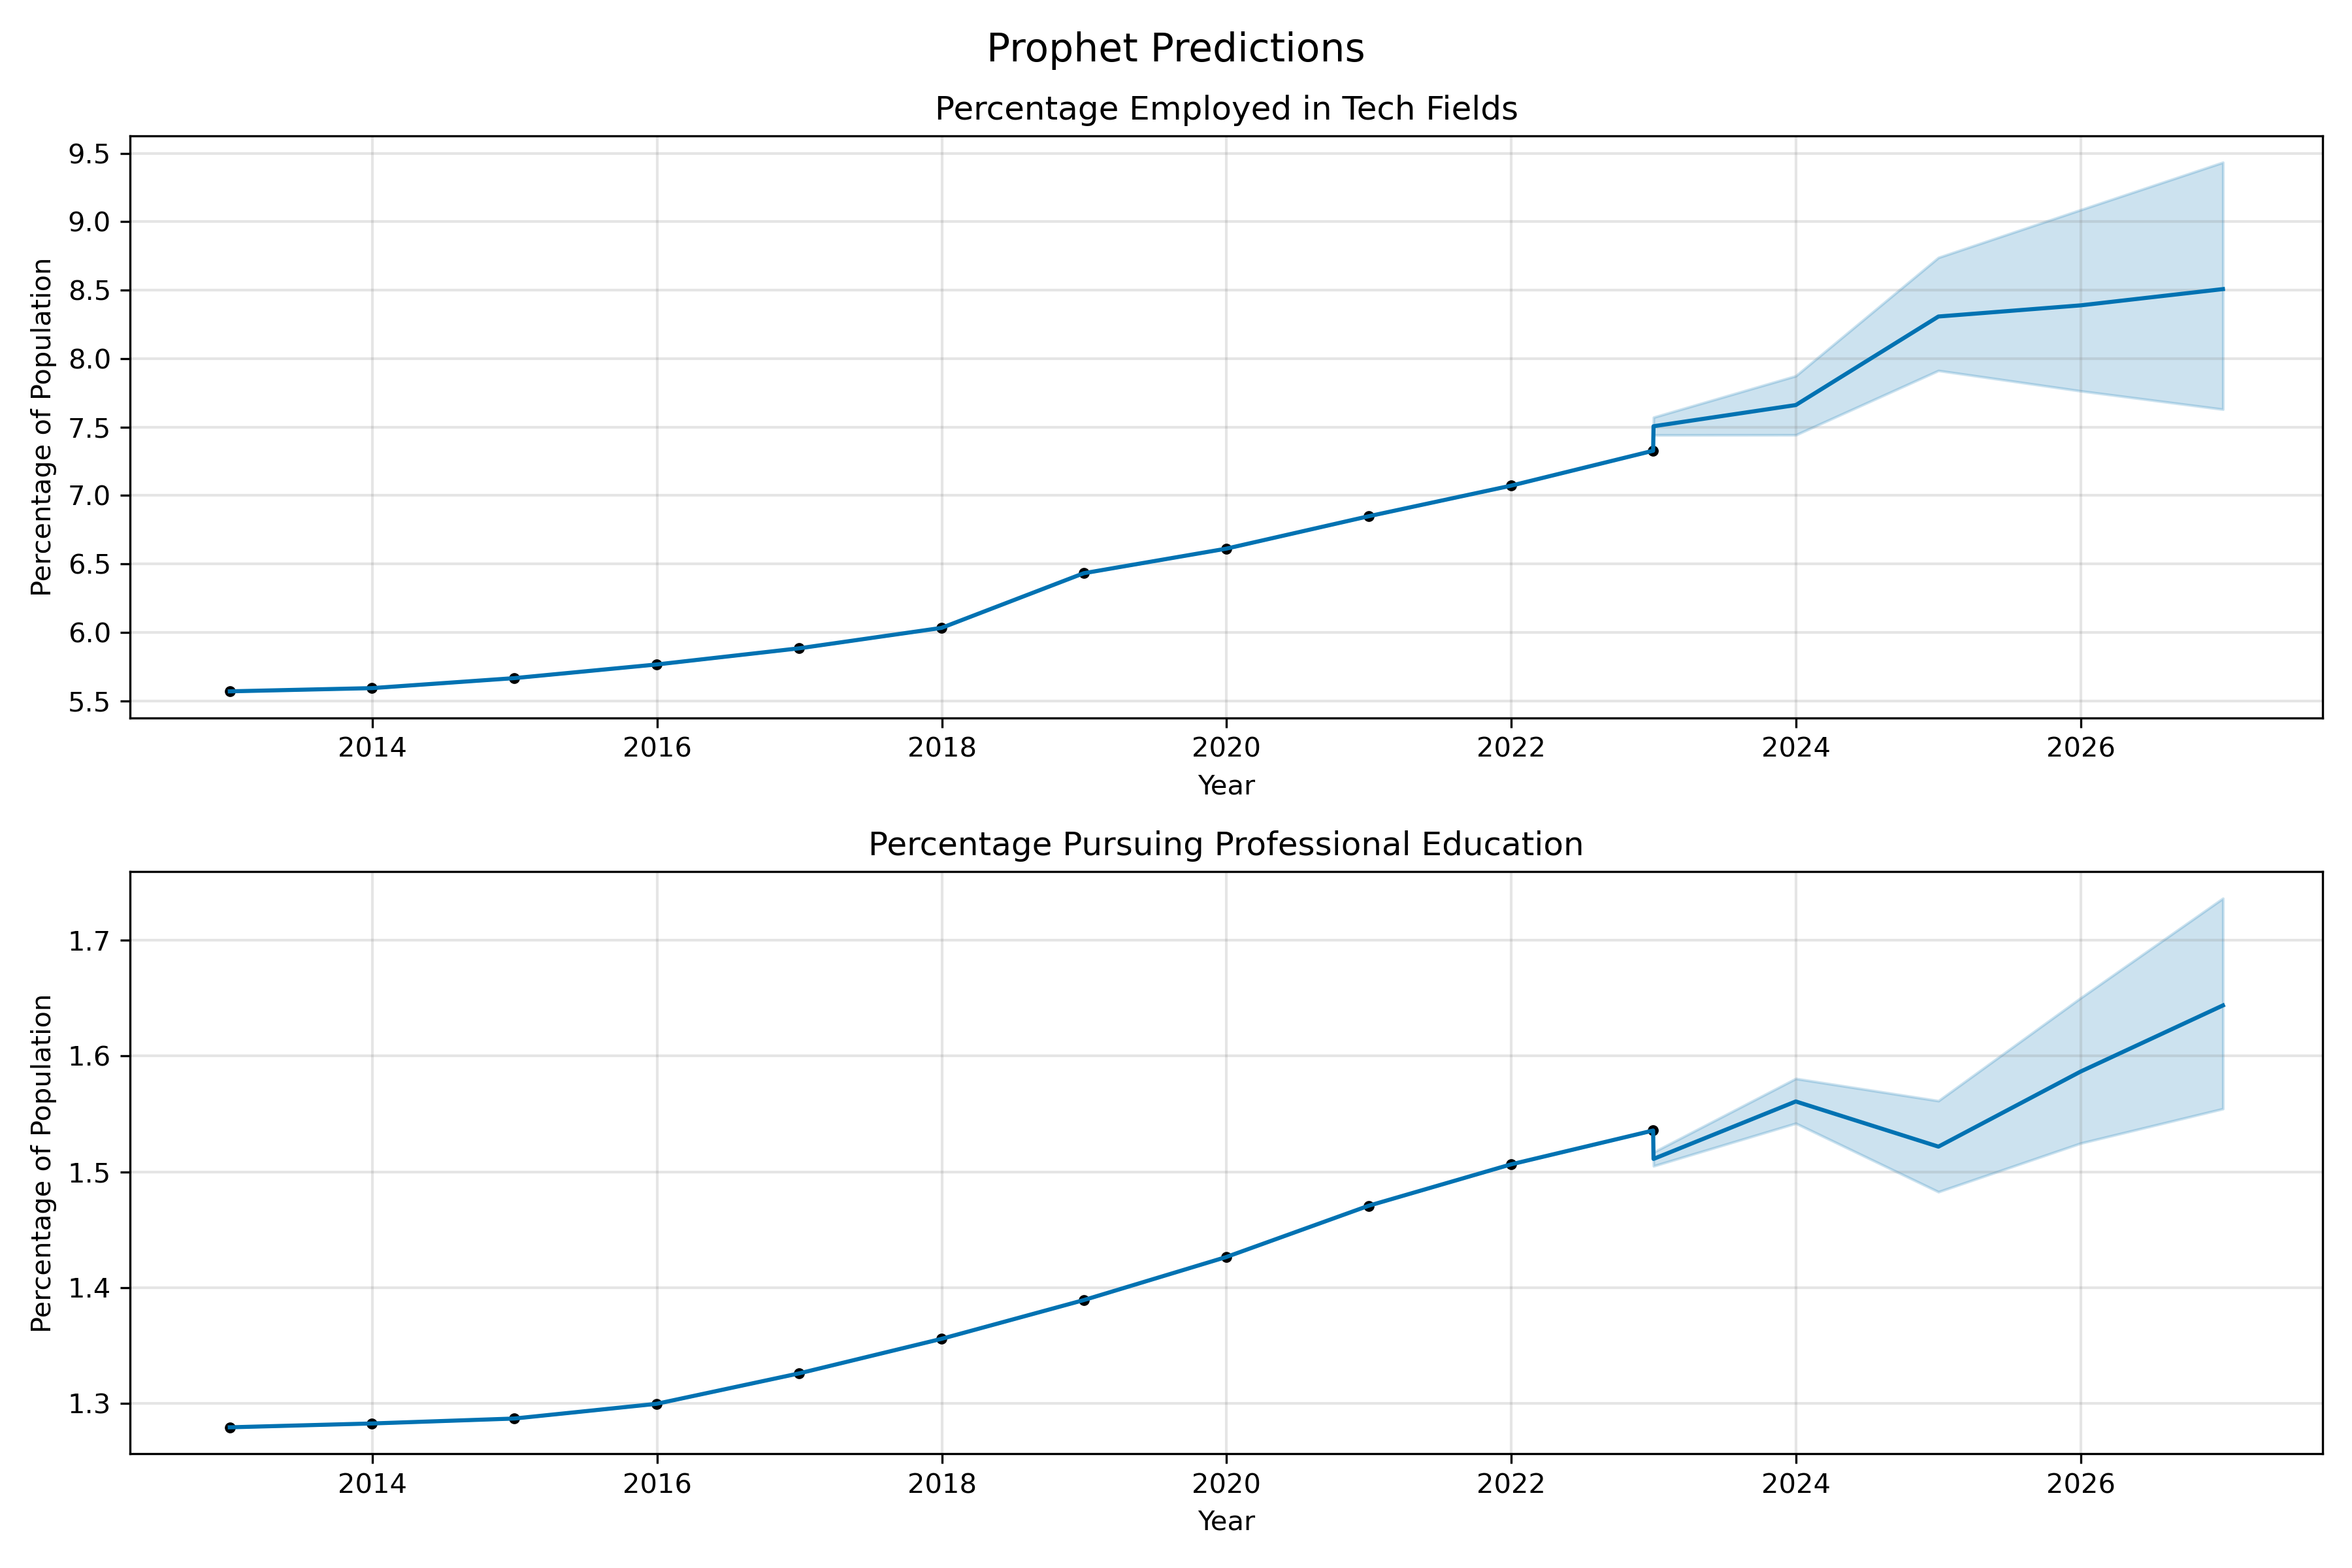
Prediction on Tech & Profession Education
AI vs Non-AI Software Developers:
Analysis of the job market for developers based on the job level showed that the demand for Associate level positions was almost identity for AI and non-AI dataset (15% vs. 14%). Notably, the demand for Mid-Senior positions was slightly lower for AI positions, which was supported by additional analysis showing ML roles, on average, less years of experience.
The AI skills analysis resulted in Python the skill that is most desirable especially for entry level AI positions; however there was portion of the dataset that required ML experience but did not include Python as a required skill. The comparative bar chart for skills required for ML jobs versus skills required for non-ML job revealed in-demand software skills like Python, Java, AWS, Javascript, and SQL appeared at the top of both datasets. As previously stated, the demand for Python was slightly higher, but most skills shared between datasets appear with almost the same proportional frequency.
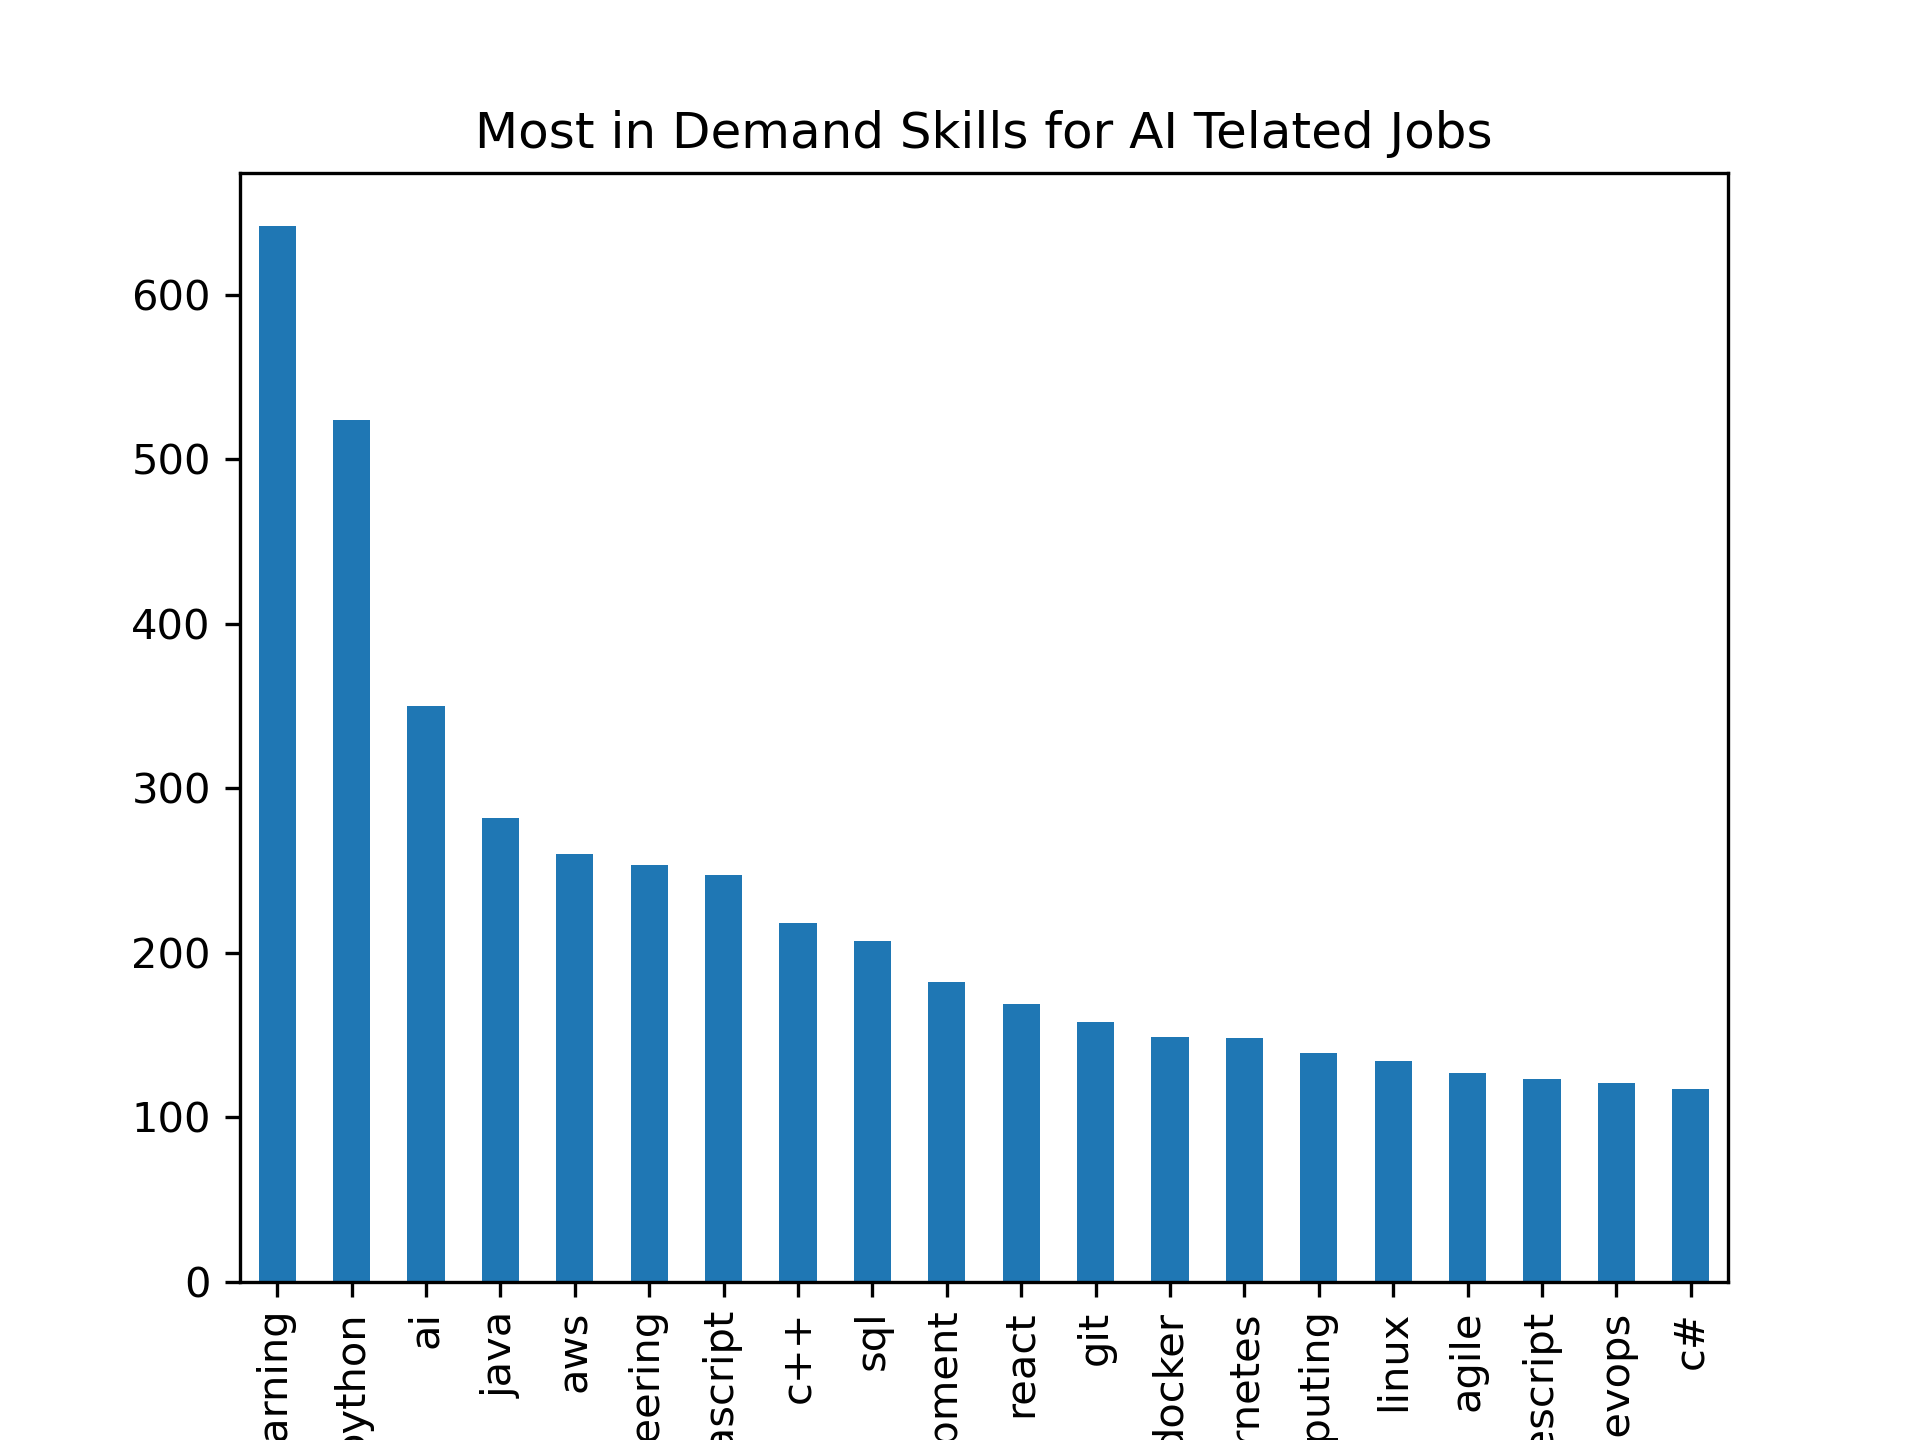
Top 20 AI Skills
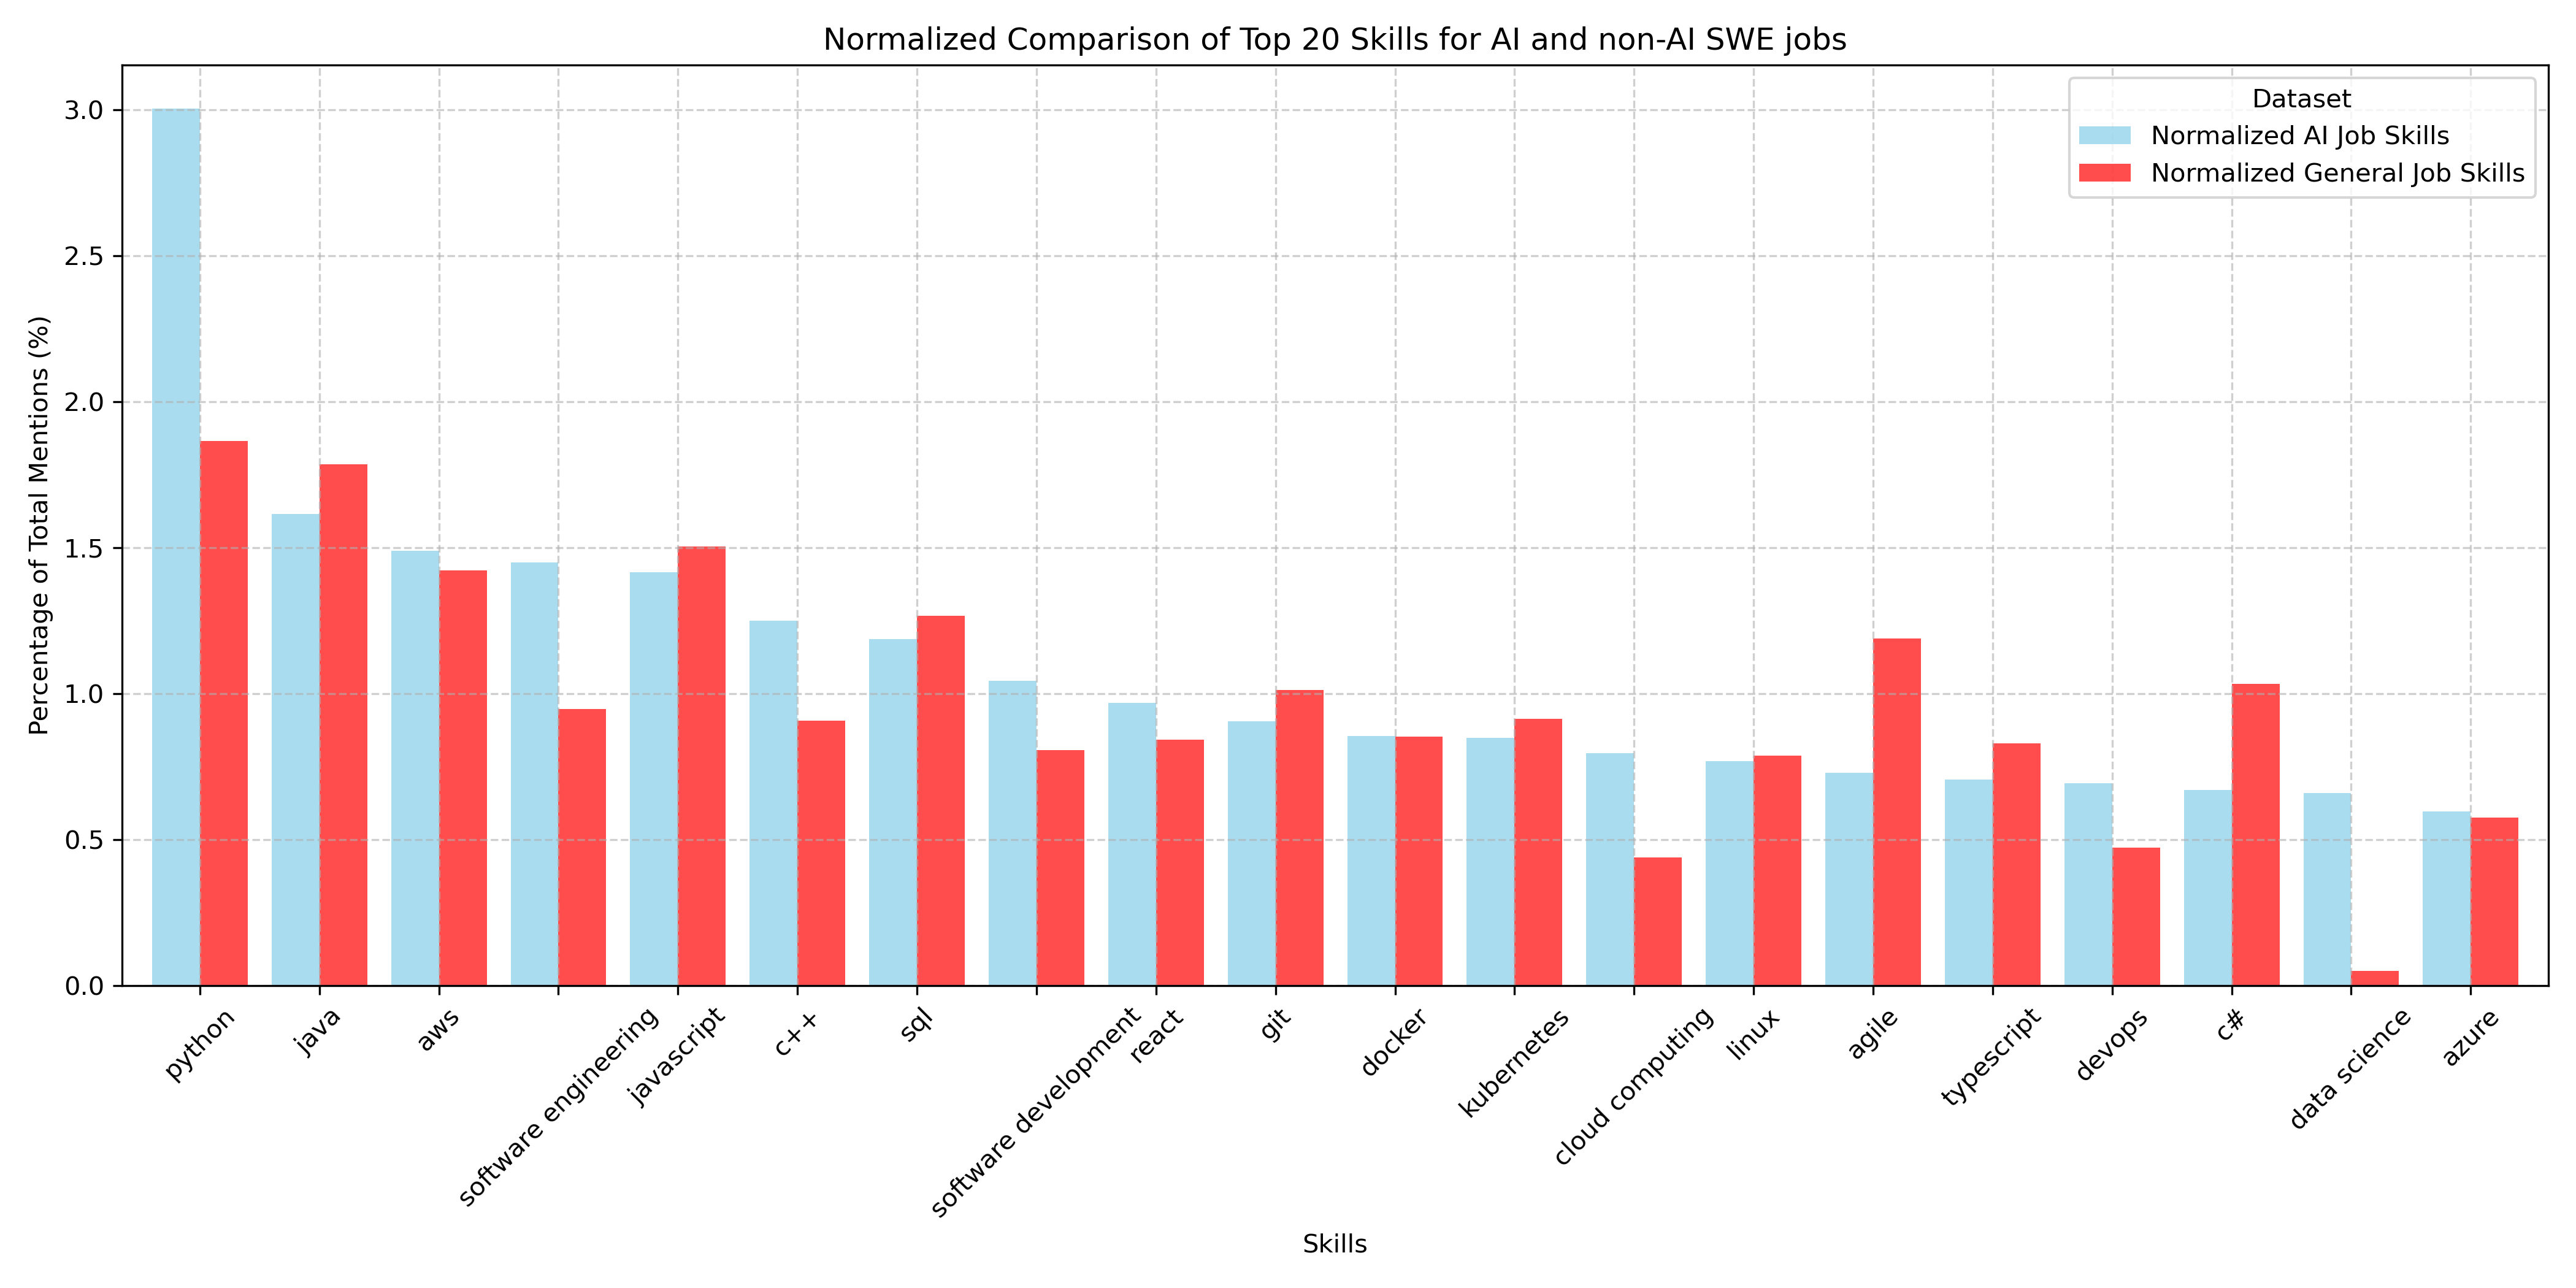
Top 20 Skills Comparison
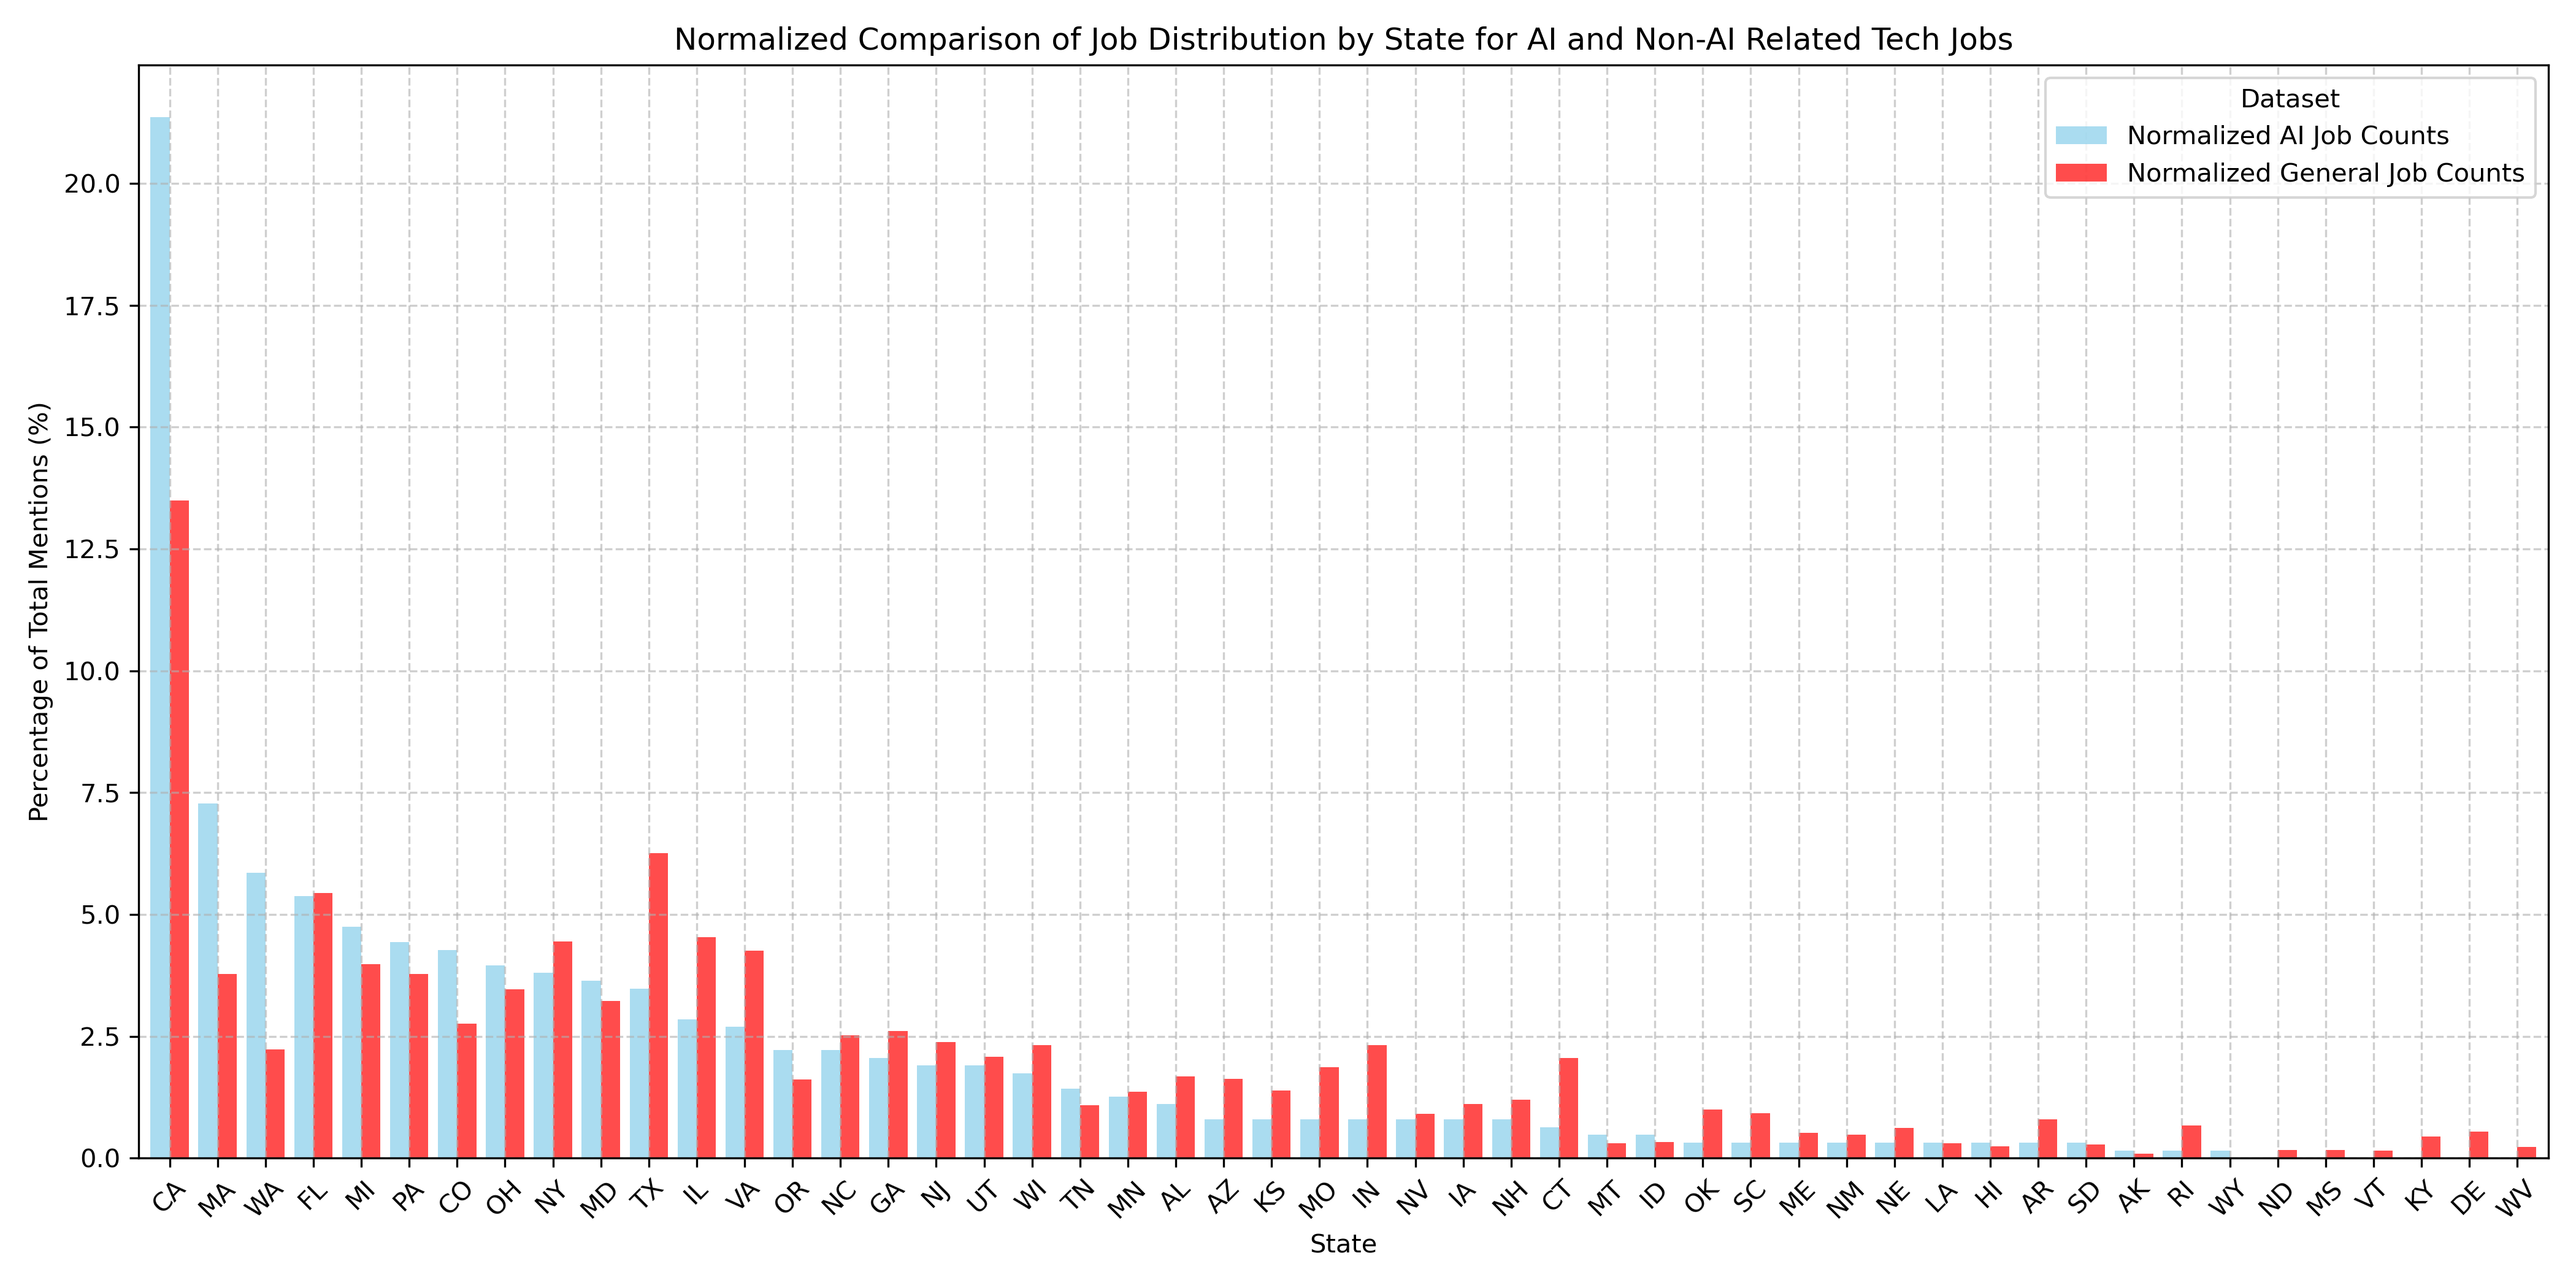
Geographical analysis of tech jobs in general showed California had the most job listings by a wide margin (about x2 its nearest competitor Texas), which is expected considering that it is the traditional tech hub for the US. The healthy showing of job listings in Texas and Florida might be attributed to the generous tax breaks and business friendly environment. When perfoming a deeper analysis to reflect AI vs non-AI jobs by State, California showed a much greater proportion of AI jobs than non-AI jobs. Massachusetts had the second largest count, with the data also showing a greater proportion of AI jobs. Trends were similar for Washington. A possible conjecture for this job distribution data is that Massachusetts is a major research hub state, resulting in a higher demand for ML engineers. The greater proportion of ML roles in Washington could be explained by the presence of Microsoft and Amazon, with both companies playing in integral role in the growth and evolution of AI.
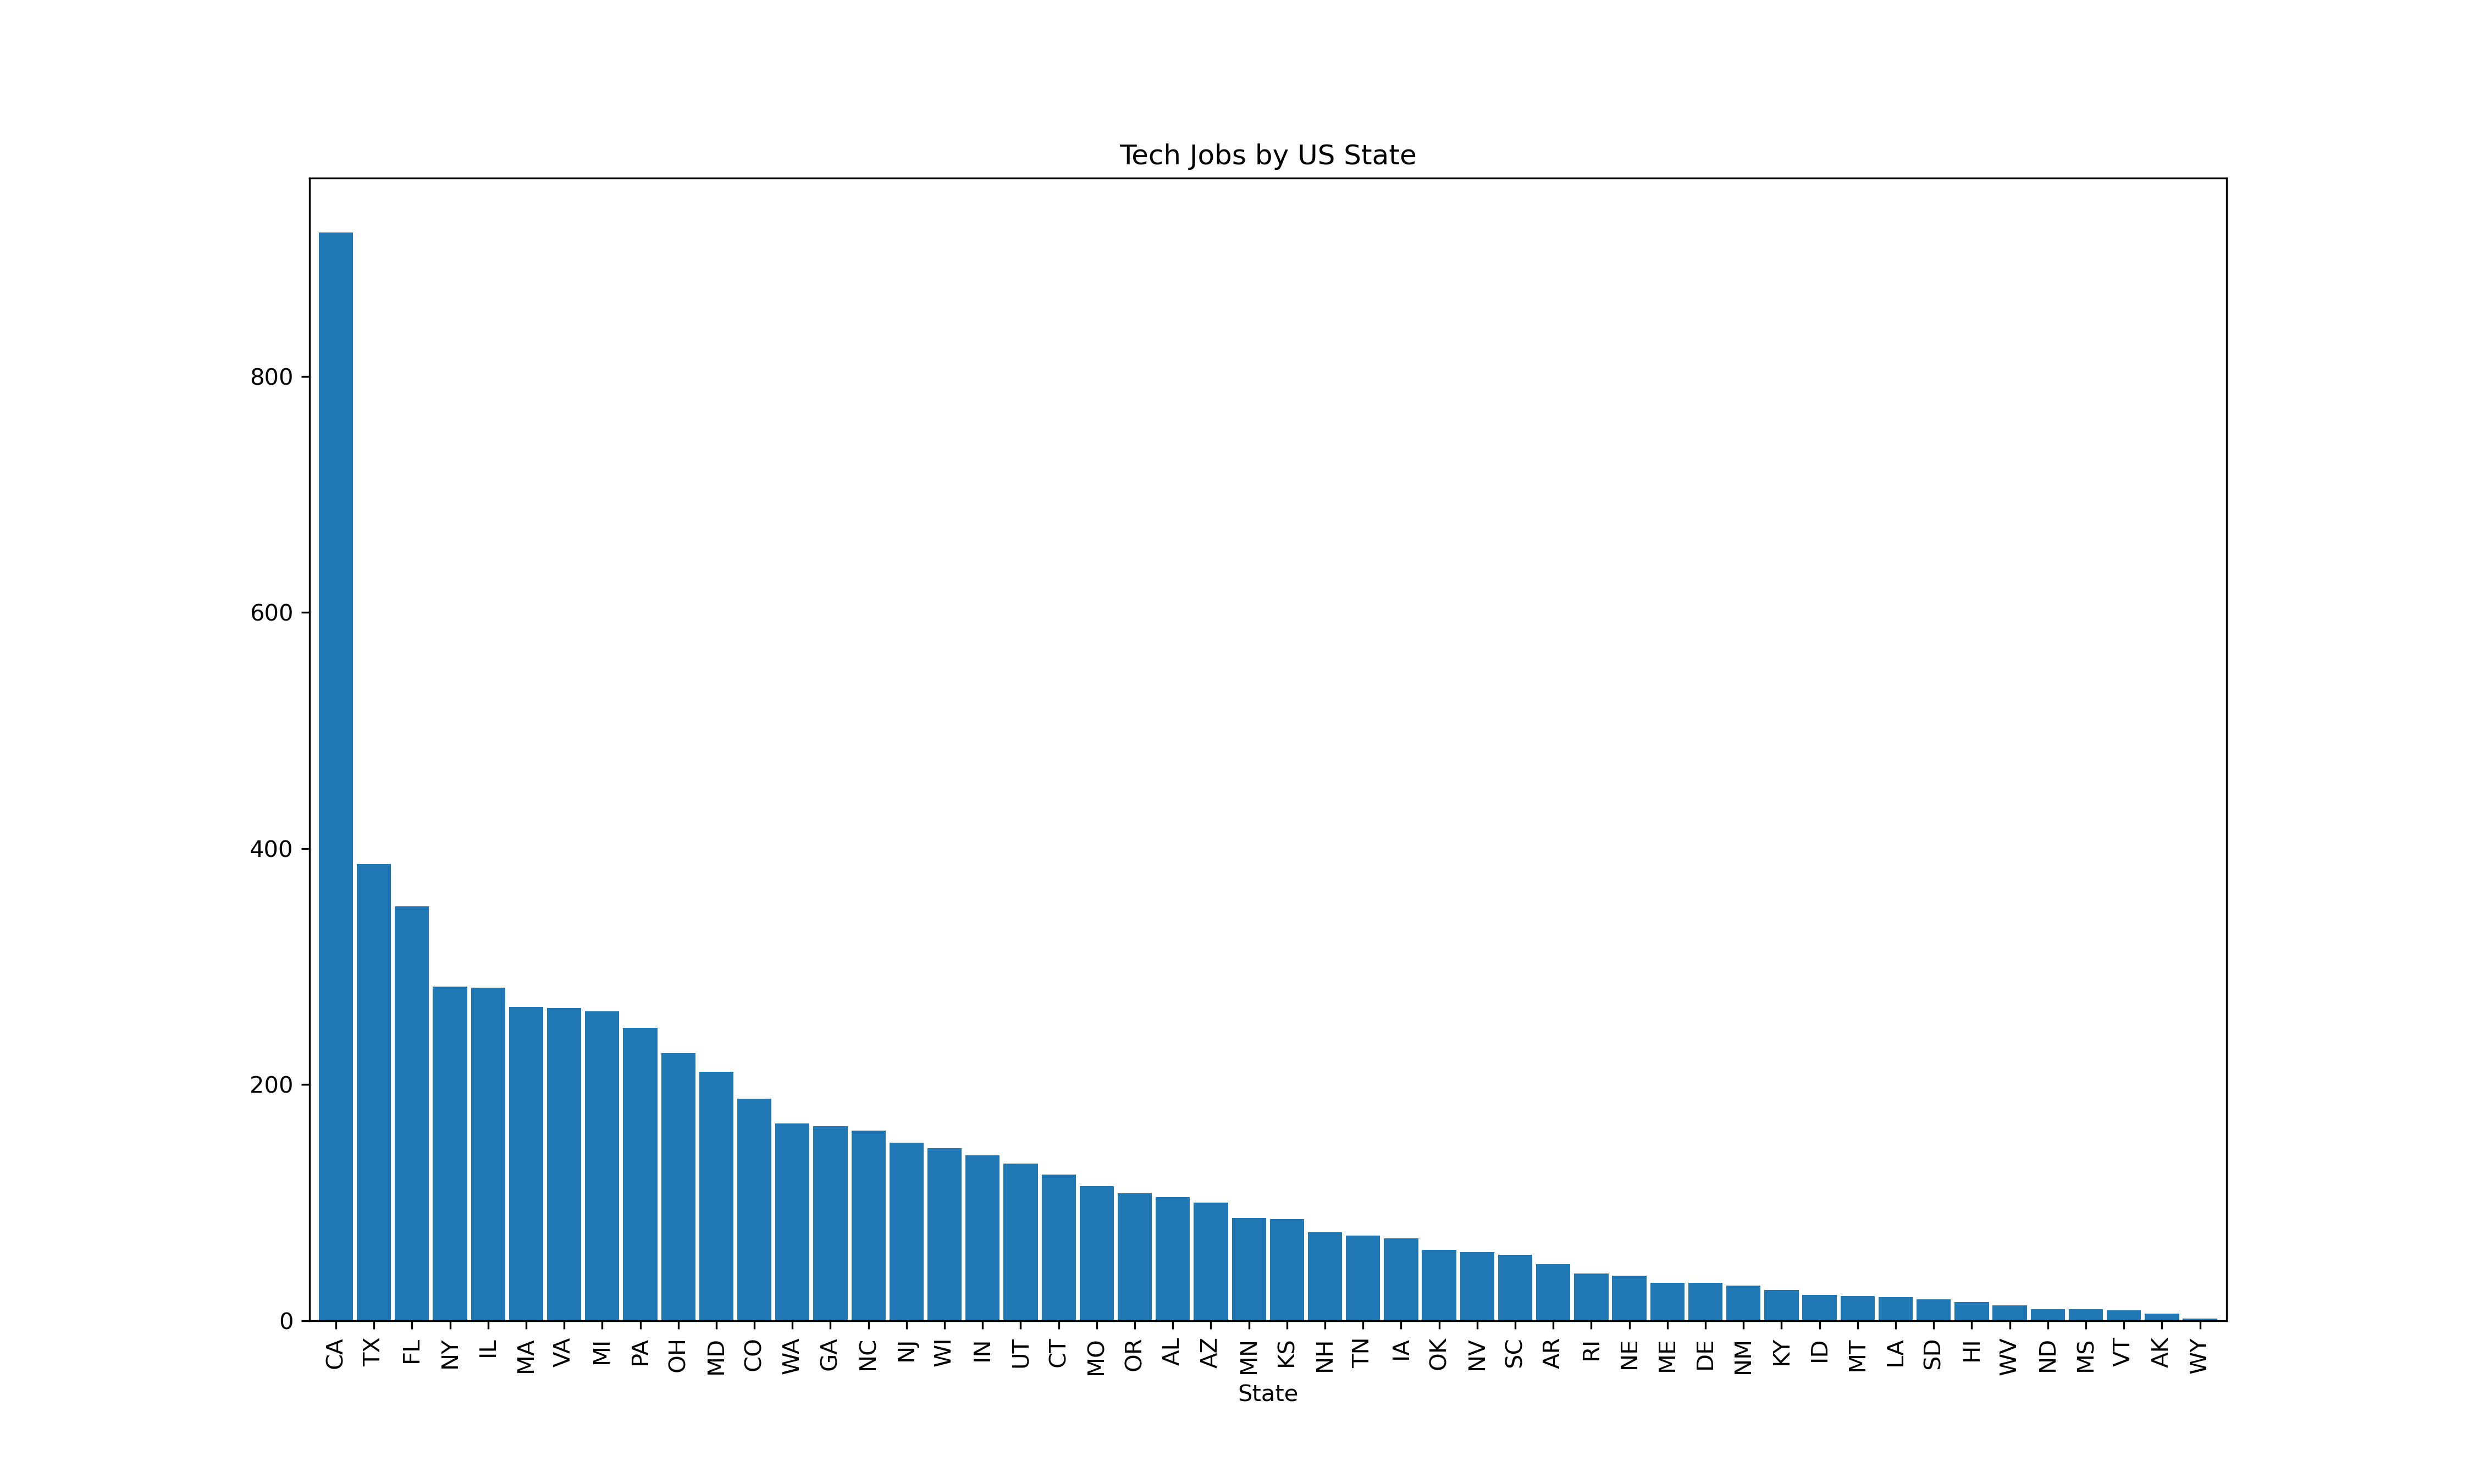
Tech Jobs by US State
Top Jobs by State Comparison
Top Jobs by State Comparison
Lingering Questions
- It was interesting that a fraction of job listings including machine learning did not also include python as an additional skill, as the number of counts for the python keyword was less than the counts for machine learning. This raises the question: do those roles including machine learning, but excluding python have anything in common or special about them?
- The number of manufacturing companies utilizing AI also warrants further exploration.
Limitations
US Census Predictions: The classification of tech-related jobs was the closest representation to the ML workforce based on the needs of the project. Supplemental data with a more granular subset of tech jobs related to AI would've contributed to the overall analysis of how jobs in that sector correlate to different aspects of employment and education.
The data analysis of unemployment trends did yield an inverse relationship to the percentage of the population working in tech-related field ( 1:-0.908 correlation); however, these numbers were based on a rolling 5-year national average, and were not indicative of all the variables affecting the unemployment rates. Additional analysis into other unemployment factors would be required to draw more concrete conclusions about the relationship between tech jobs and unemployment.
AI vs Non-AI Software Developers: The raw LinkedIn job postings dataset did not include a years of experience in an isolated, instead it was included in the job description. Given the irregularity of the summary texts, there was no guarantee all information was correctly extracted.
Conclusion
Our findings confirm that the tech industry is disproportionately seeing profit and growth in AI development, while other sectors lag behind. Manufacturing is notably second. This could be attributed to automation efforts in manufacturing processes using AI.
Within the jobs market, AI related jobs are concentrated in three states, CA, WA, and MA. We argue that this is attributable to CA's reputation as a tech hub, WA's status as the headquarter state for Microsoft and Amazon, and MA's status as a research and technology hub, given AI's extensive potential for research and scientific use cases.
Among job skill distributions, "machine learning" overall is the most demanded skill among jobs containing ai related keywords. Python is overrepresented among this set of jobs, as is cloud technologies. Whereas web technology skills are more represented in the general population and less emphasized for ai/ml roles.
One finding that stood out is that overall, the same skill set is in demand across all tech jobs. Python, Java, AWS and several other skills are consistently in demand for both groups. What this could suggest is that ai/ml roles are more of a continous evolution from regular programming skills, rather than a sharply distinct skill set.
However, for more advanced ai/ml roles, the departure widens, and more specialized skills like deep learning and neural networks come into play.
Workpapers in GitHub
Visualizations Format:
References/Footnotes
[^1]: AI vs ML Definition