Overview
The PT Application Inspector plugin finds vulnerabilities and undocumented features in application source code. In addition to code analysis, built-in modules detect errors in configuration files and vulnerabilities in third-party components and libraries used in application development. The plugin supports Go, Ruby, C#, PHP, Python, Java, JavaScript, and TypeScript languages.
How it works
Enabling and disabling the plugin
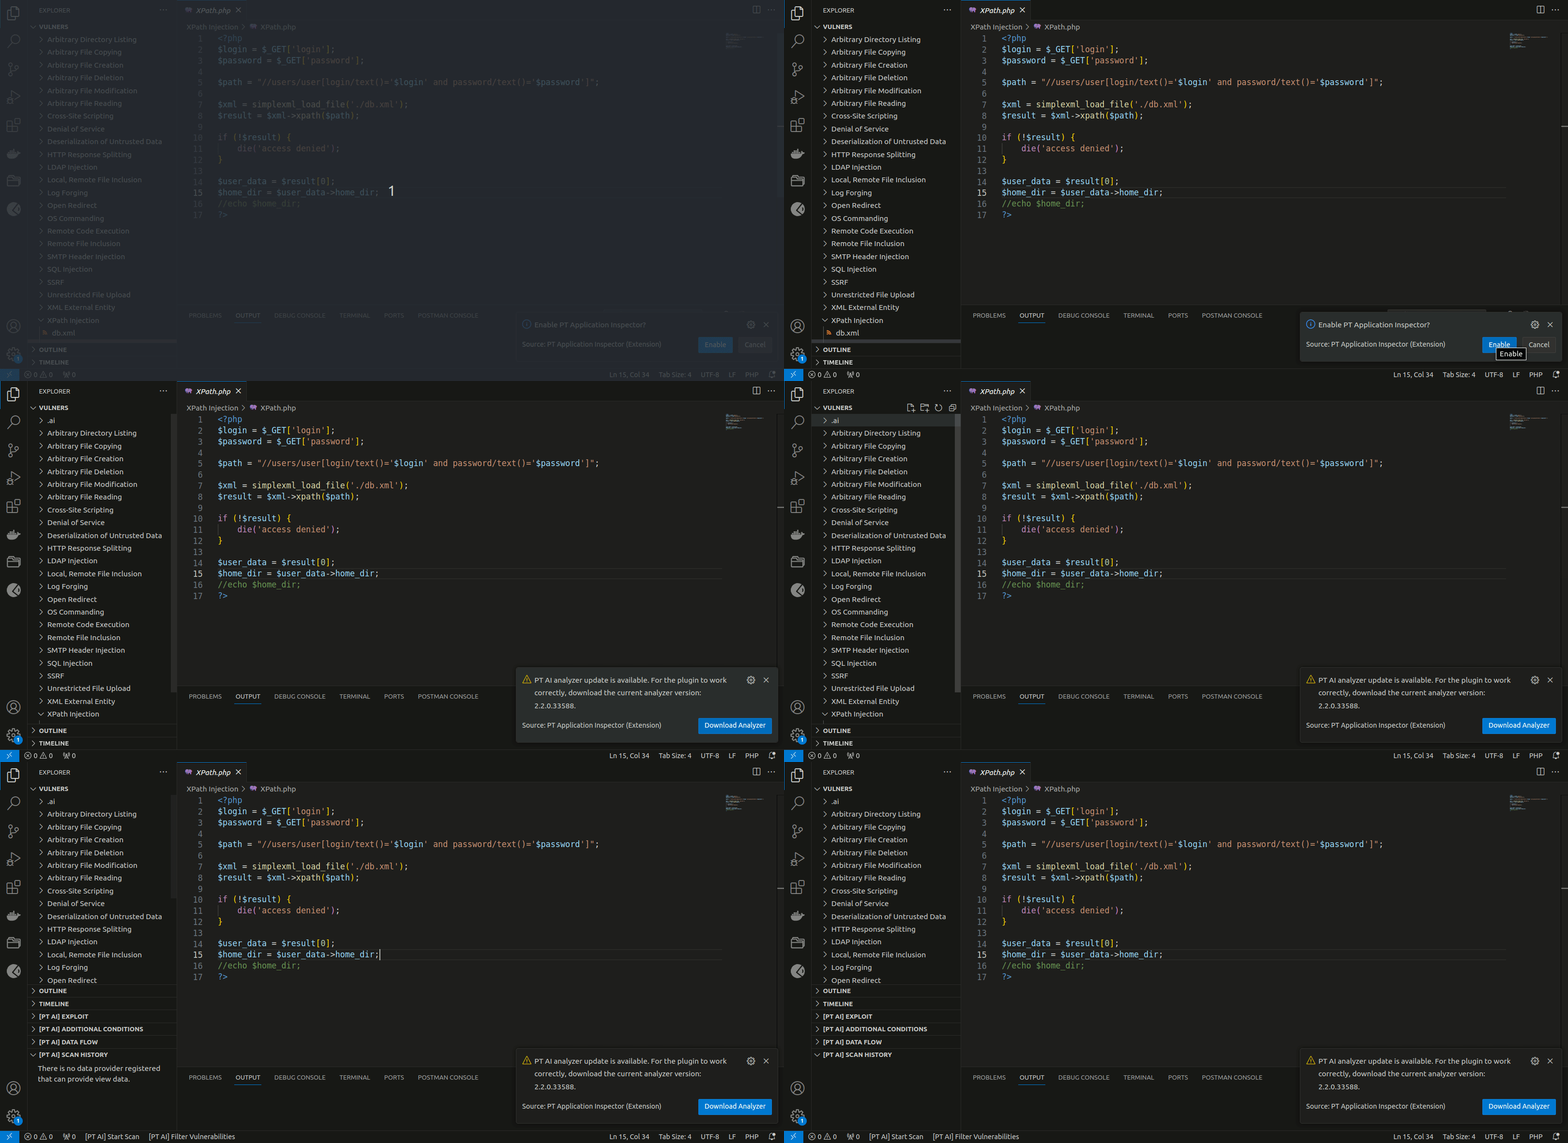
You can enable or disable the plugin in the folder of an open project. If it is not the first time you are opening the project, the plugin is enabled automatically (scan and action history is saved). You can also set up the plugin to be automatically enabled when a new project is opened.
When the plugin is enabled, the .ai folder is created in the project. This folder contains a database, log files, and a configuration file.
Installing the code analyzer
For the plugin to operate correctly, the PT Application Inspector code analyzer is required. You can install it automatically by clicking Download Analyzer in the pop-up notification in the Visual Studio Code interface or manually by downloading it from the link in the instructions below.
To manually install the code analyzer:
-
Download the archive with the analyzer using one of the links:
-
In macOS, run the installation file and follow the instructions. In Windows and Linux, unpack the archive to one of the following locations:
-
In Windows:
%LOCALAPPDATA%\Application Inspector Analyzer -
In Linux:
~/application-inspector-analyzer
-

Scanning a project
You can start a project scan in the following ways:
- By clicking [PT AI] Start Scan in the status bar in the lower part of the window
- When saving project changes (if you selected On saving for the Trigger scanparameter)
- By running the command
PT Application Inspector: Start Scan - By running the command
PT Application Inspector: Start Full Scan
Note. Before scanning, all changes to the project are automatically saved.
You can monitor the scan progress in the OUTPUT tab. The first scan usually takes longer due to the initial load on the database of vulnerable components.
General scan settings are configured in the .aiproj.json configuration file. You can create a configuration file and configure scan settings in it by running the command PT Application Inspector: Create Project Settings File.

Stopping a scan
You can stop a project scan by running the command PT Application Inspector: Stop Scan or by clicking [PT AI] Stop Scan in the status bar.
Analyzing scan results
You can find the list of all detected vulnerabilities in the PROBLEMS tab. If you click a vulnerability in the list, the line with its exit point gets highlighted in the code editor.
The [PT AI] DATA FLOW section contains a data-flow diagram that shows how each process converts its input data to output data and how processes interact.
The data-flow diagram consists of the following sections:
- Entry point. The starting point of the control flow.
- Data entry point. The file and code line with the coordinates of the data entry.
- Data changes. The description of one or several functions that modify potentially harmful input data. This section may not be displayed on the diagram if the input data were not modified.
- Exit point. The execution line of a potentially vulnerable function. This is the exit point related to the vulnerability in the source code.
- Best place to fix. The code line best suited for patching a vulnerability. This section is displayed before the data flow.
You can go to the corresponding place in the code editor from any section of the data-flow diagram.
![The [PT AI] Data flow section](https://github.com/POSIdev-community/AI.Plugin.VSCode/blob/release/2.2.2/media/readme/AI-data-flow.gif?raw=true)
The [PT AI] EXPLOIT section contains an automatically generated HTTP request (exploit) that you can edit and use to check the vulnerability in a deployed web application.
Note. To exploit a vulnerability, specify the address of the host where your web application is deployed in the .aiproj.json file. The default value is "localhost."
Note. To send an HTTP request, a third-party extension is required. It is recommended that you use the REST client.
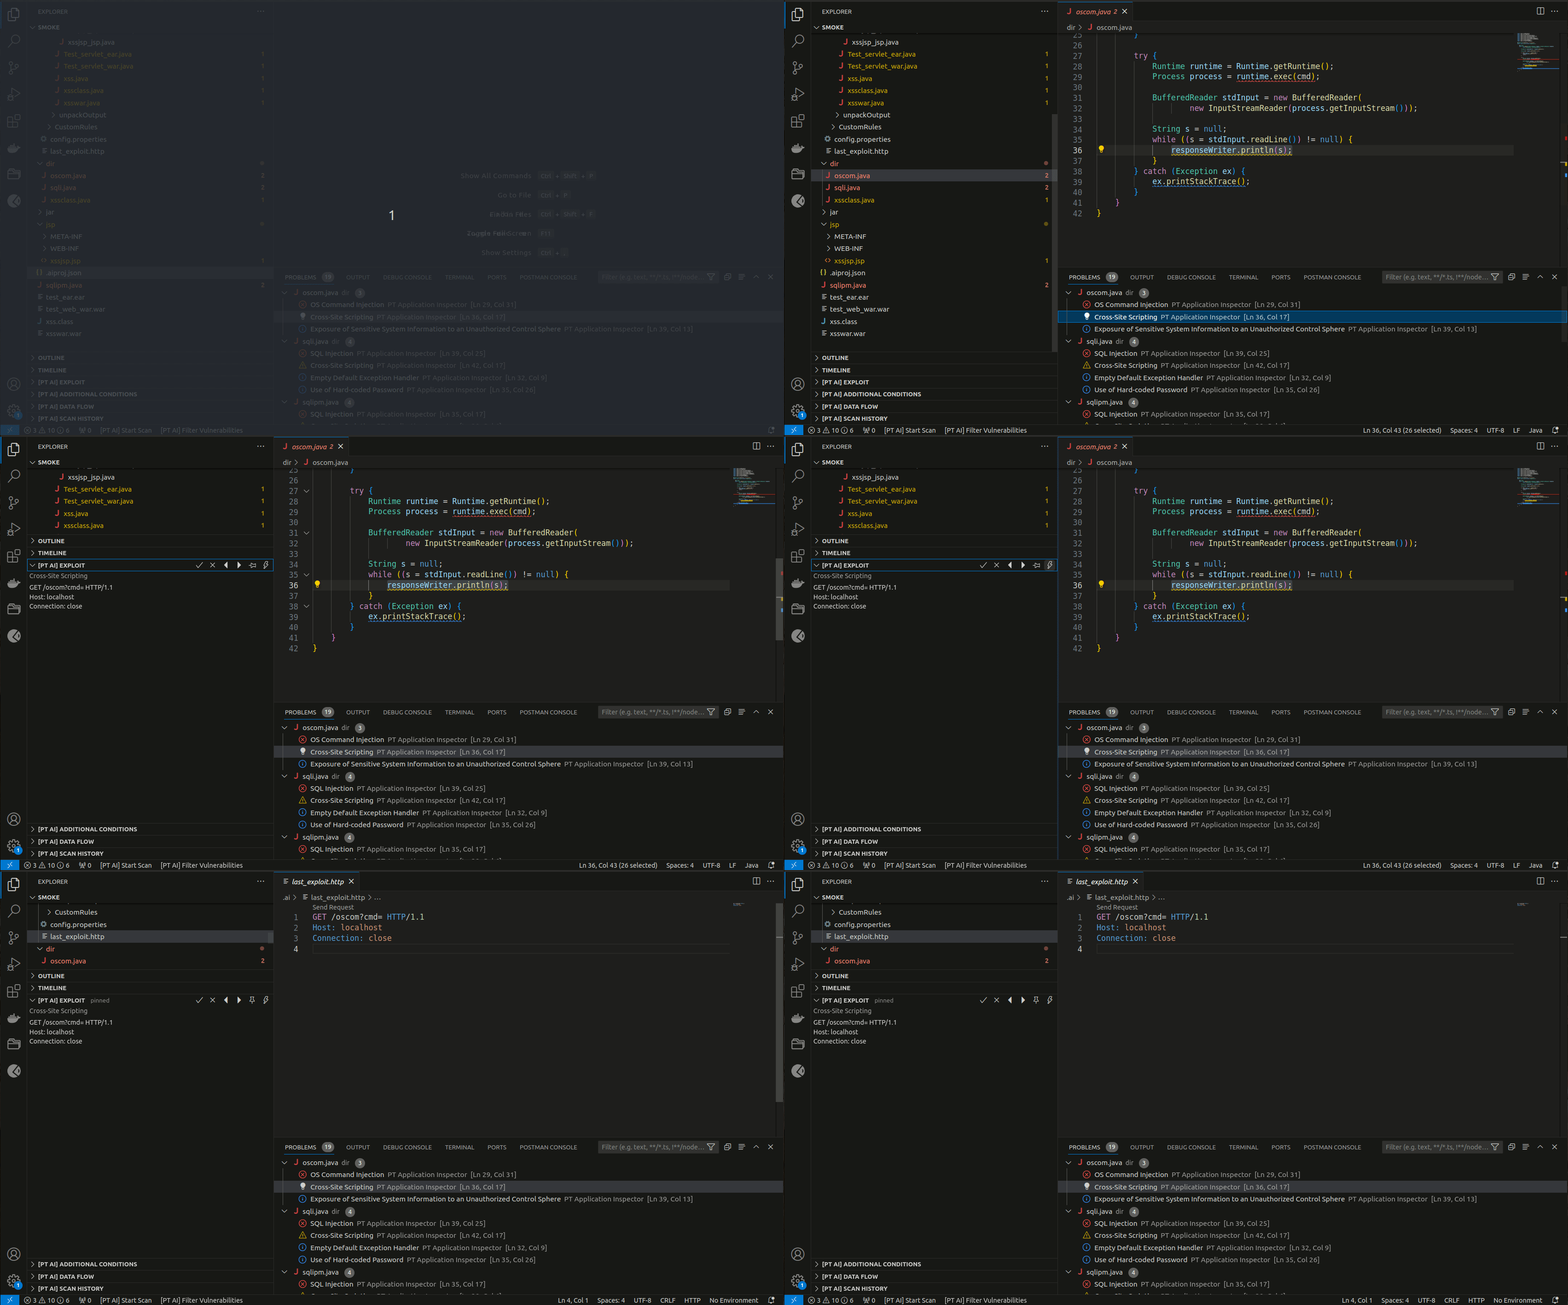
Some vulnerabilities have additional exploitation conditions. They are displayed under [PT AI] ADDITIONAL CONDITIONS.
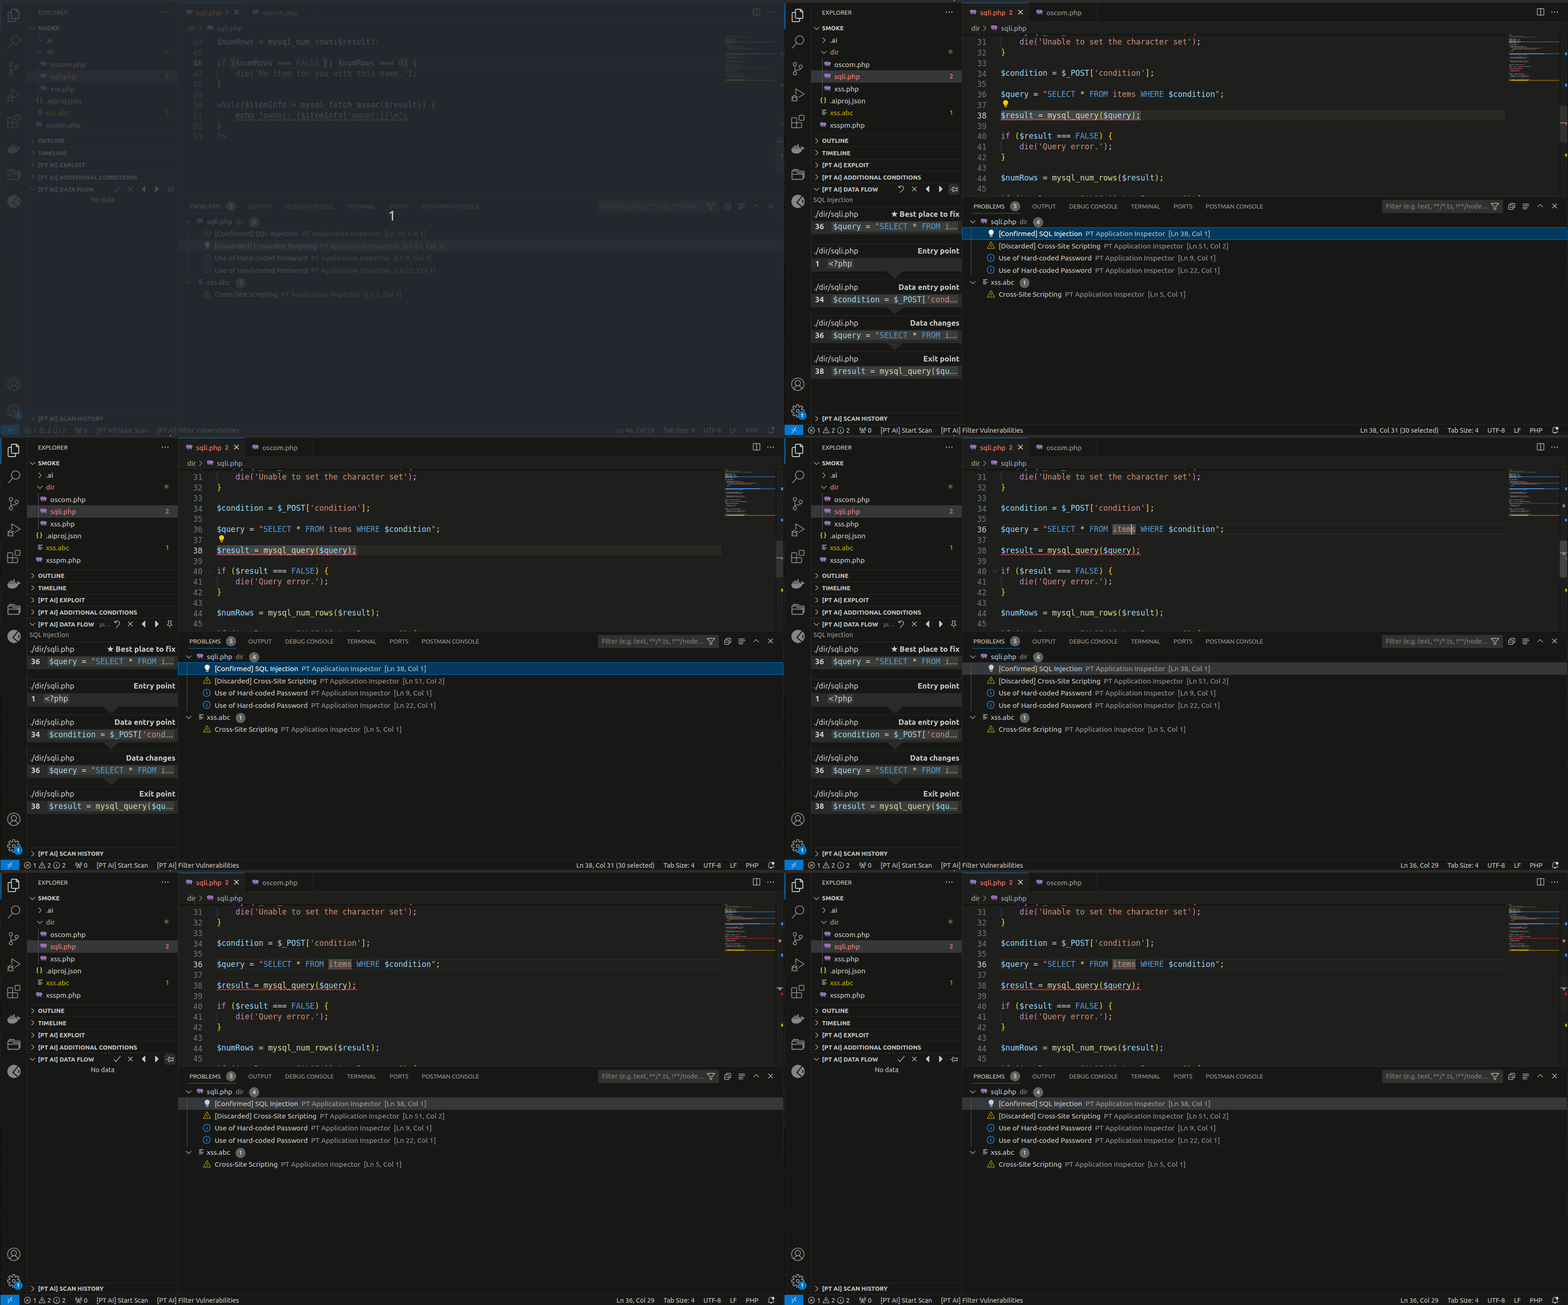
The contents of the [PT AI] sections depend on the code line selected in the editor.
When you scroll through the sections of the diagram, the vulnerability information is automatically pinned until you move on to another vulnerability. If you want to view information about a certain vulnerability while working on the code, you can pin this vulnerability manually.
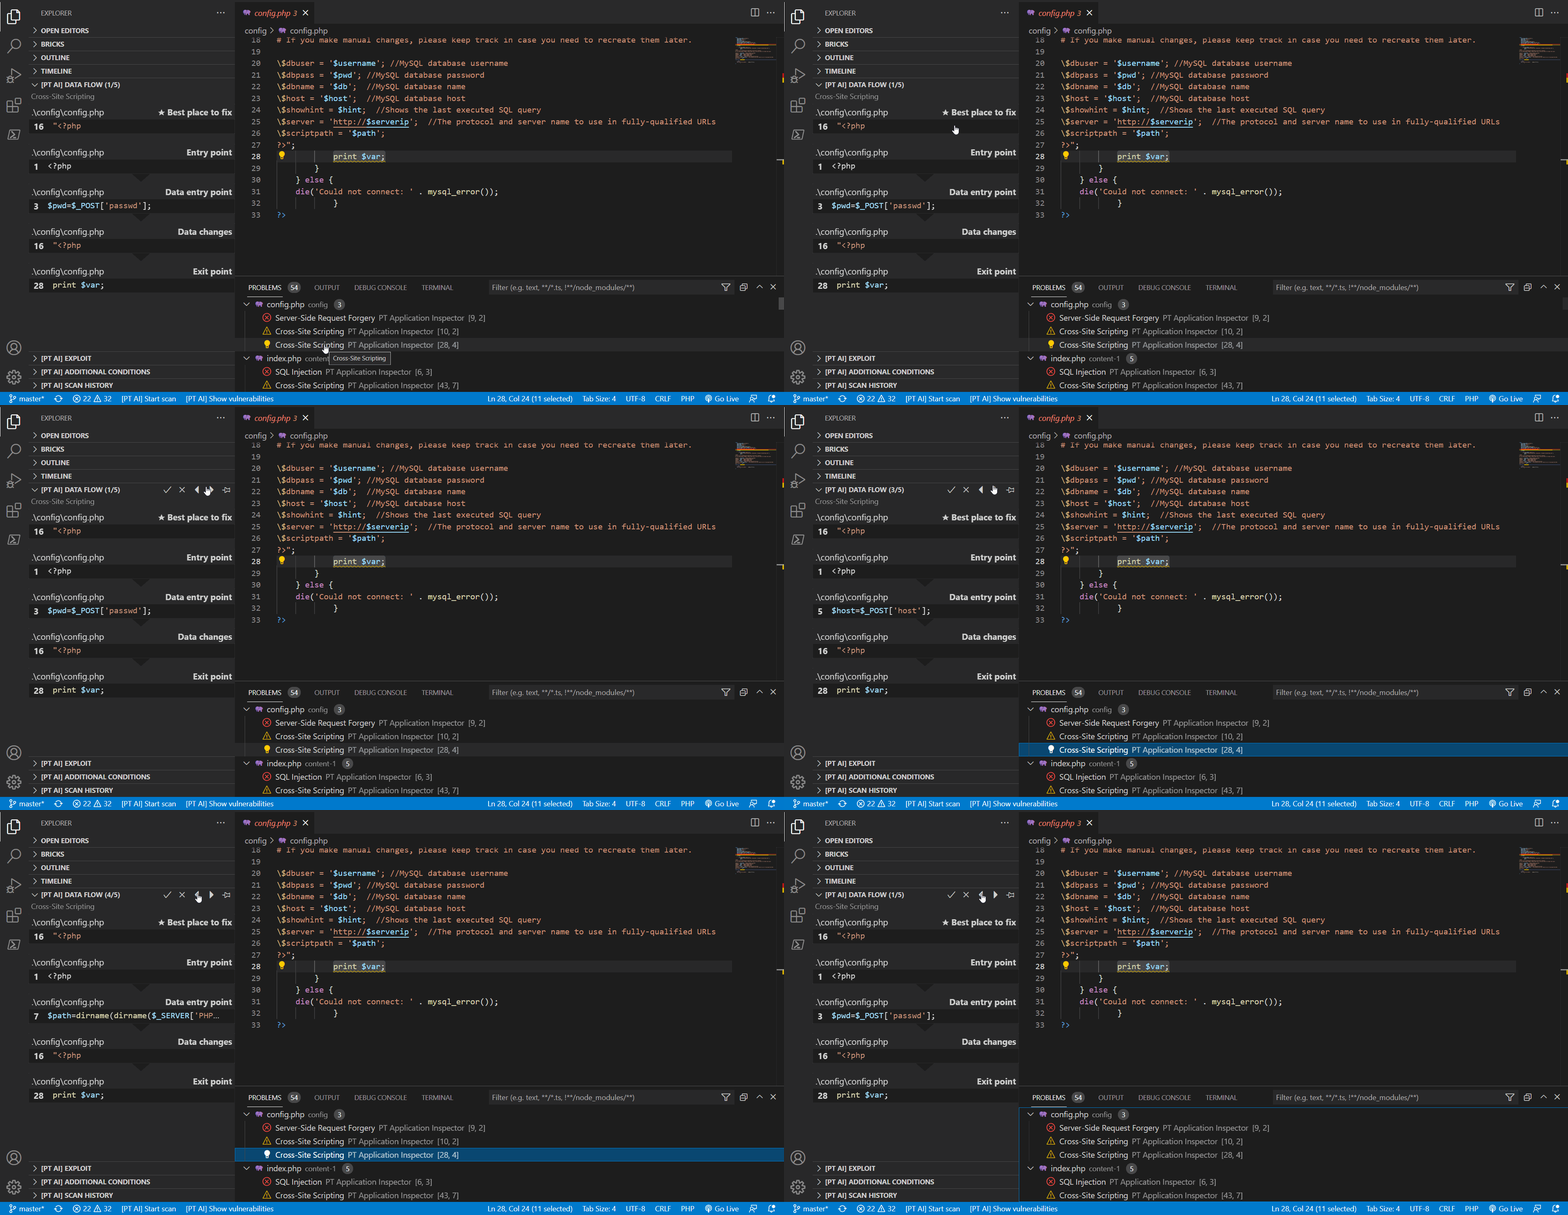
Several vulnerabilities can have the same exit point. If these vulnerabilities belong to the same type, they are grouped together and displayed as one problem with different exploitation options. In [PT AI] sections, use the left and right arrows to view detailed information about such vulnerabilities.
Note. If you confirm one vulnerability from the group, the whole problem will be confirmed automatically. To discard an entire problem, you must discard all the vulnerabilities in the group.
Managing detected vulnerabilities
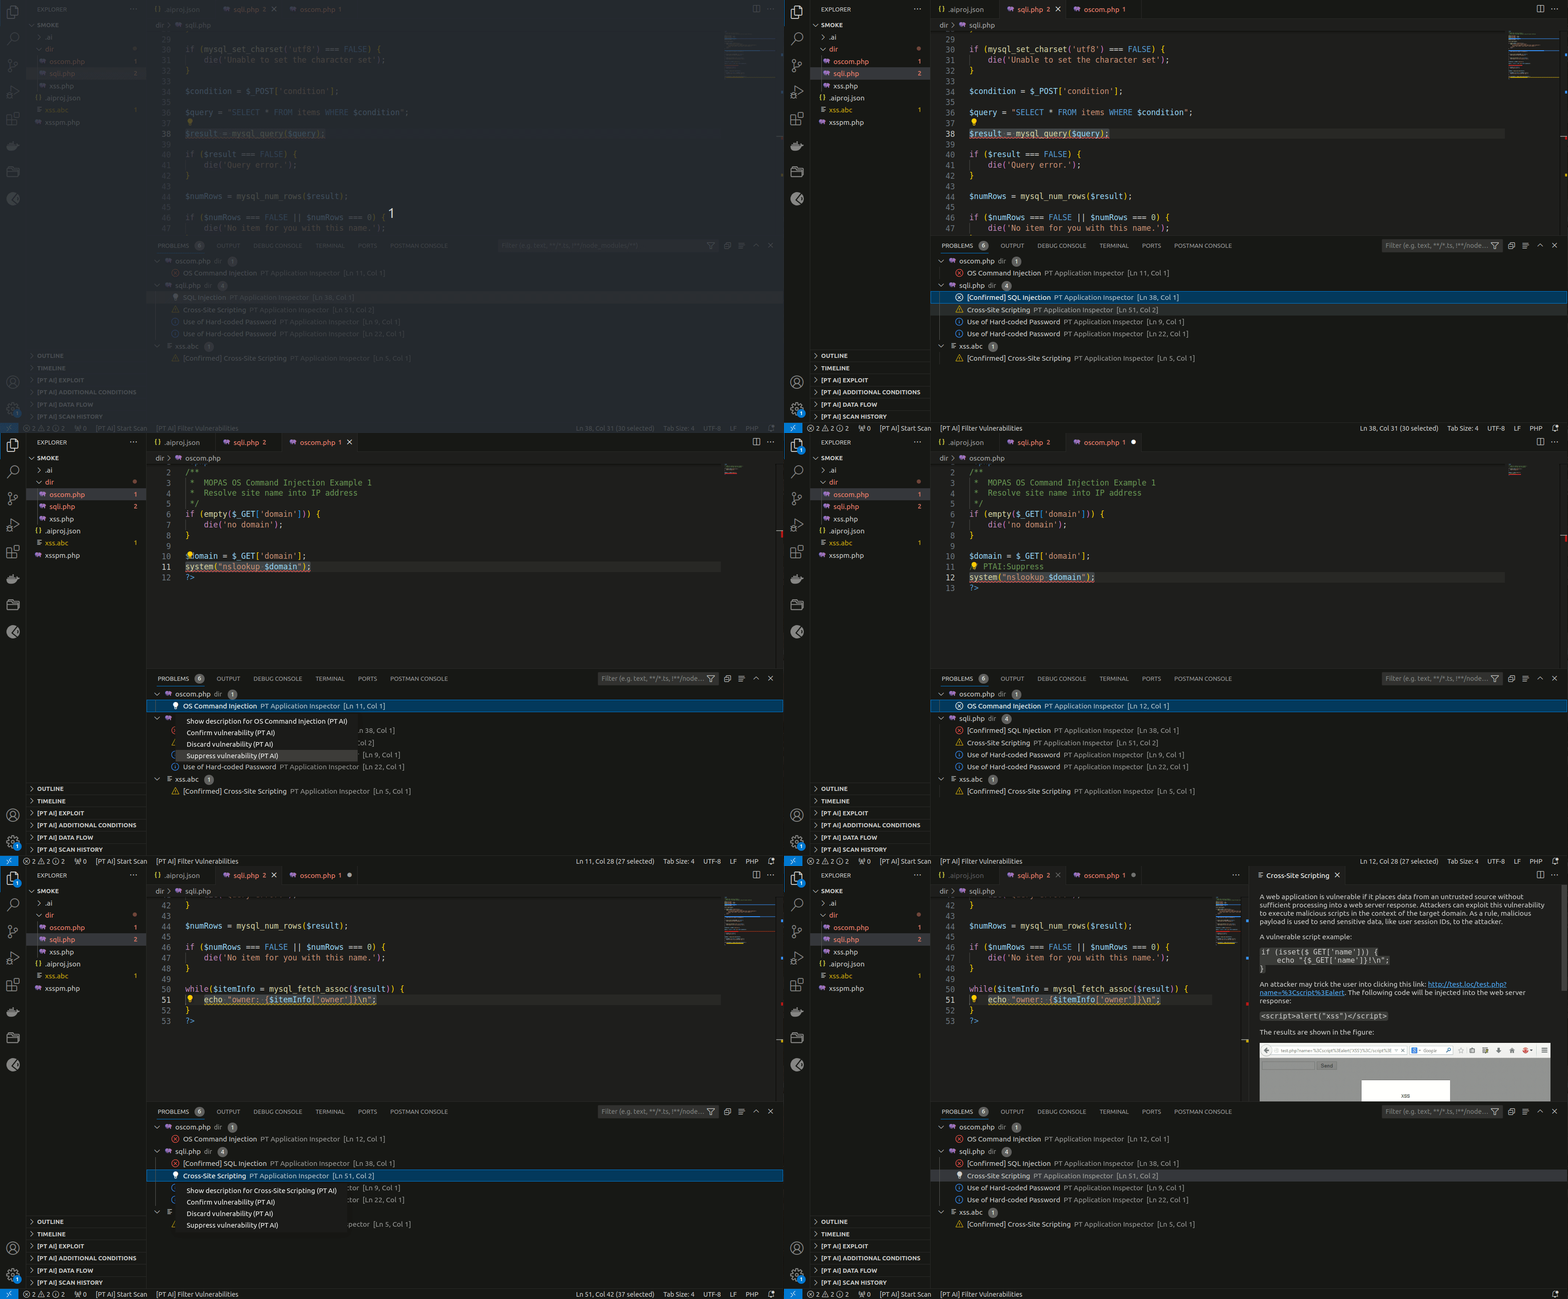
The PT Application Inspector plugin contains a set of tools for managing detected vulnerabilities. With these tools, you can do the following:
- Suppress vulnerabilities from scan results by selecting Suppress vulnerability (PT AI) in the vulnerability context menu in the PROBLEMS tab.
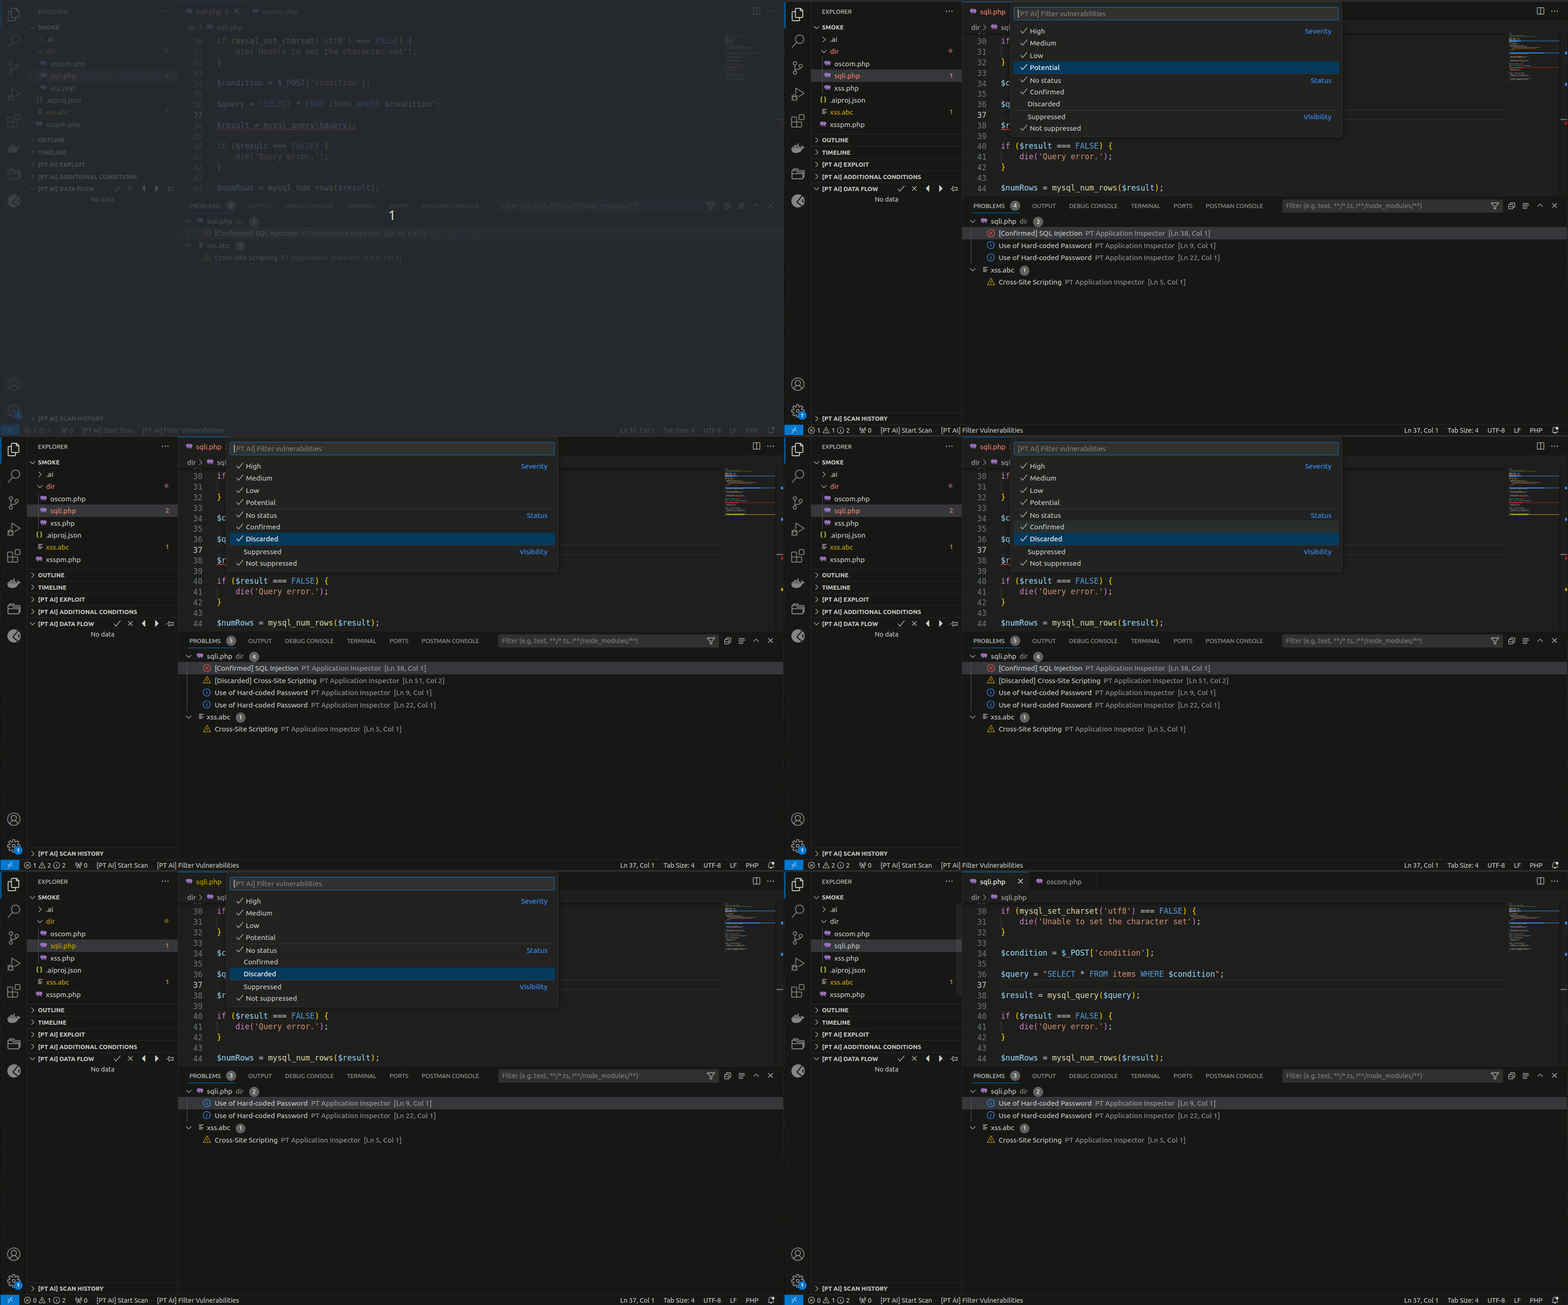
- Filter vulnerabilities by severity, status, and suppression from scan results by running the command
PT Application Inspector: Show Vulnerabilities. - Confirm and discard vulnerabilities by clicking the X and checkmark buttons in [PT AI] sections.

Comparing scan results
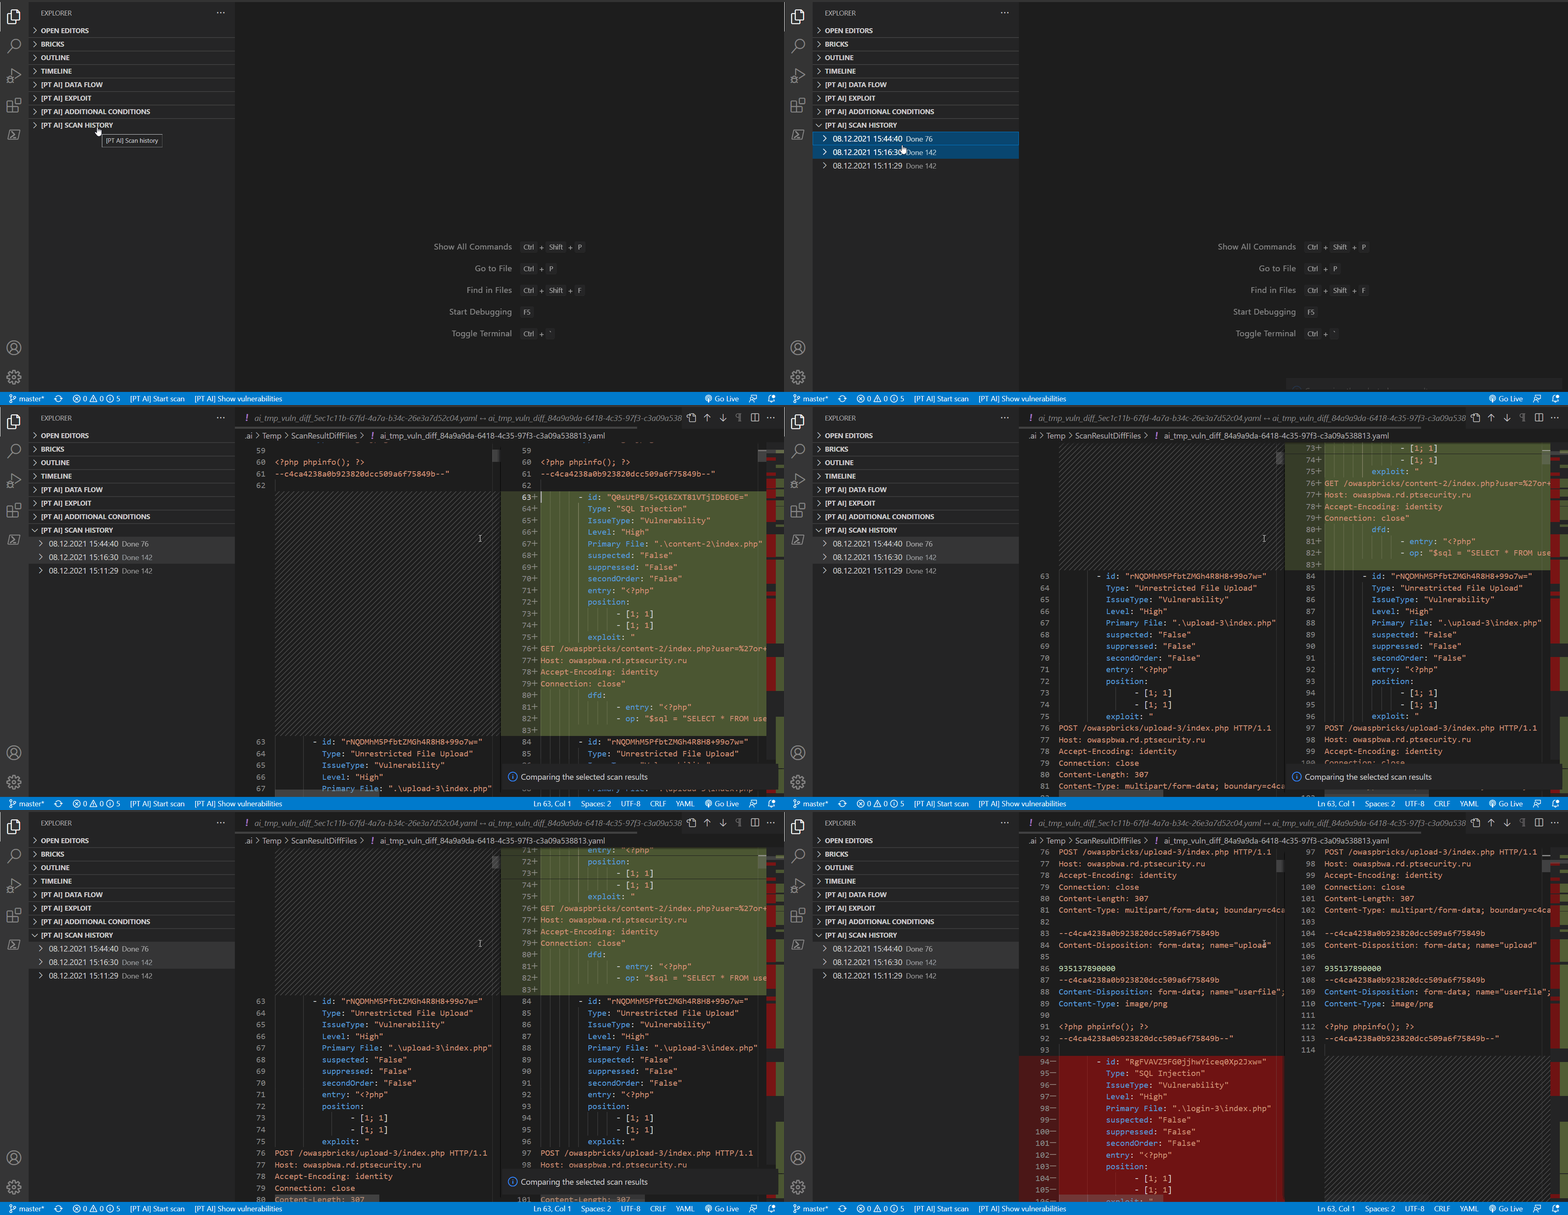
You can compare results of two scans within a project. To do this, under [PT AI] SCAN HISTORY, select the scans you need and then select Compare Scan Results in the context menu.
Note. The [PT AI] SCAN HISTORY section is displayed only in the developer mode.
Integration with PT AI Enterprise Edition
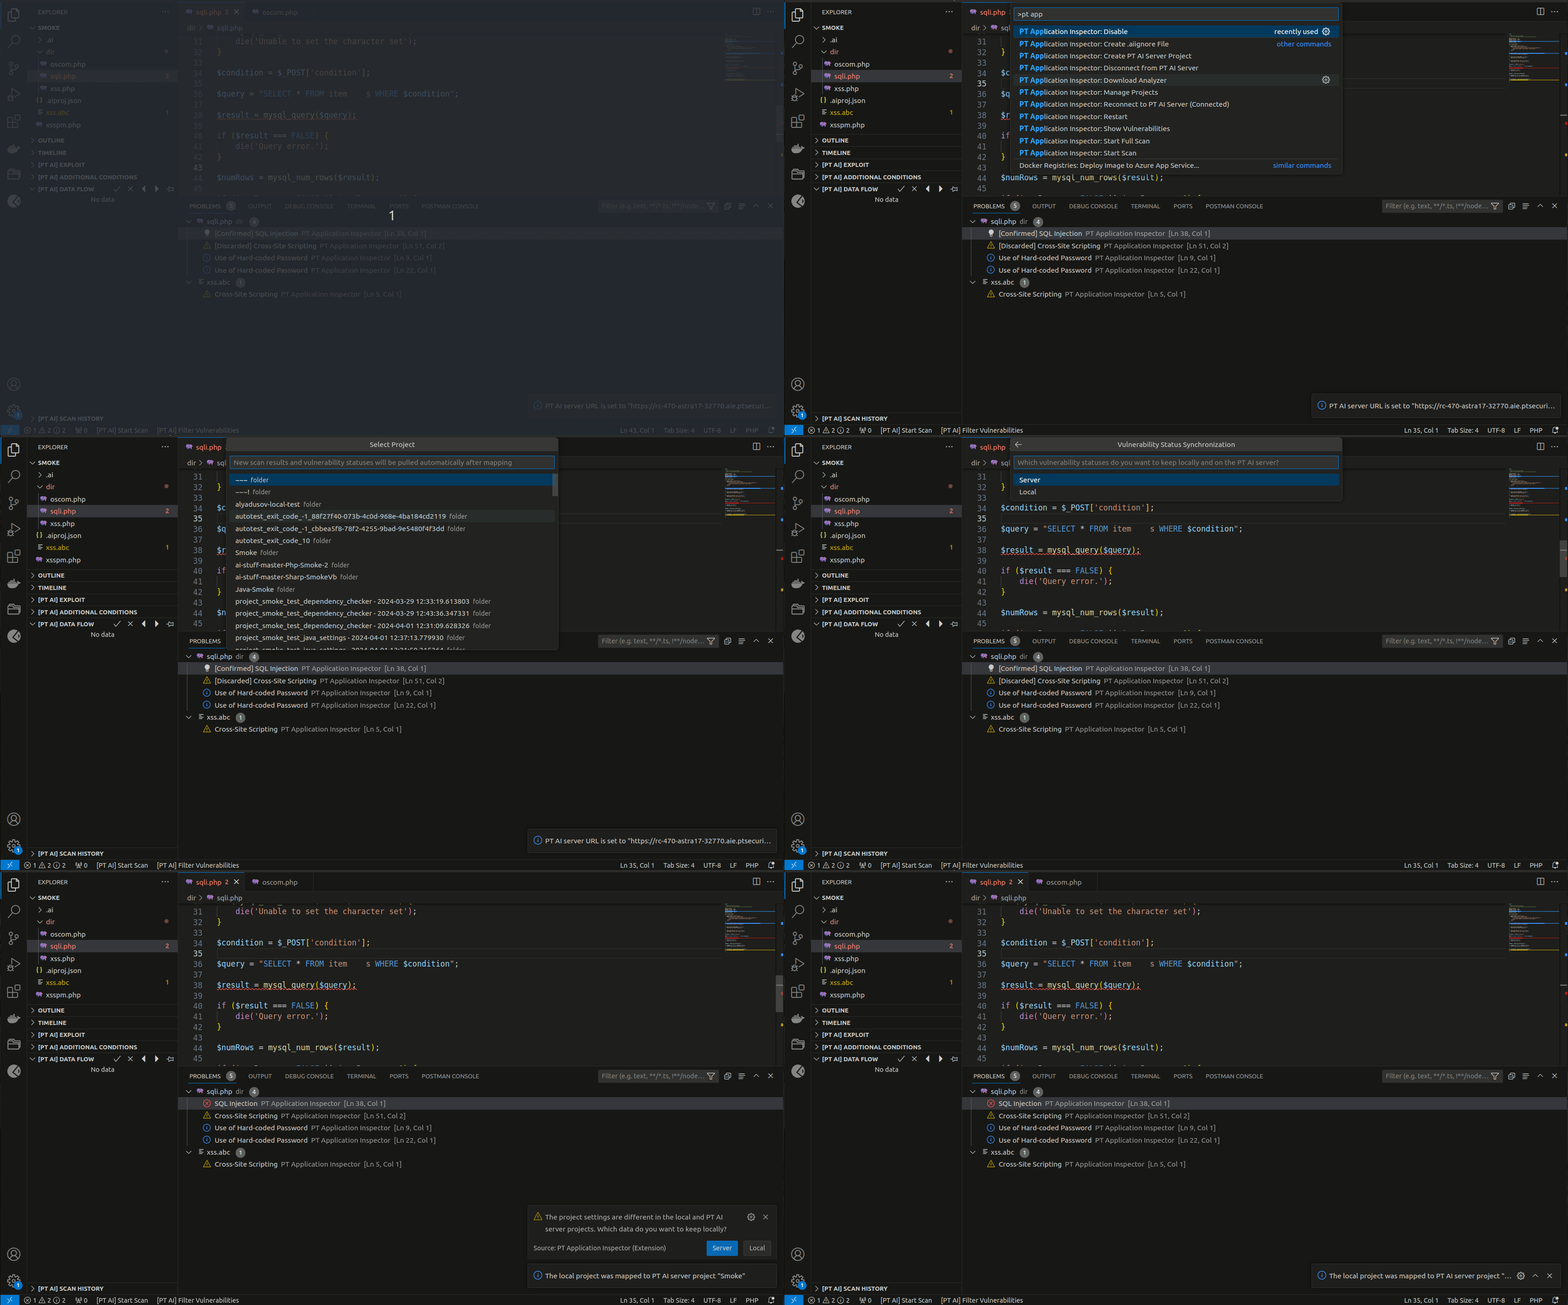
The PT Application Inspector plugin can be integrated with PT AI Enterprise Edition. The integration allows several team members to simultaneously work with vulnerabilities and their statuses in the IDE and PT AI Enterprise Edition web interface, thereby increasing code security.
To configure the integration:
-
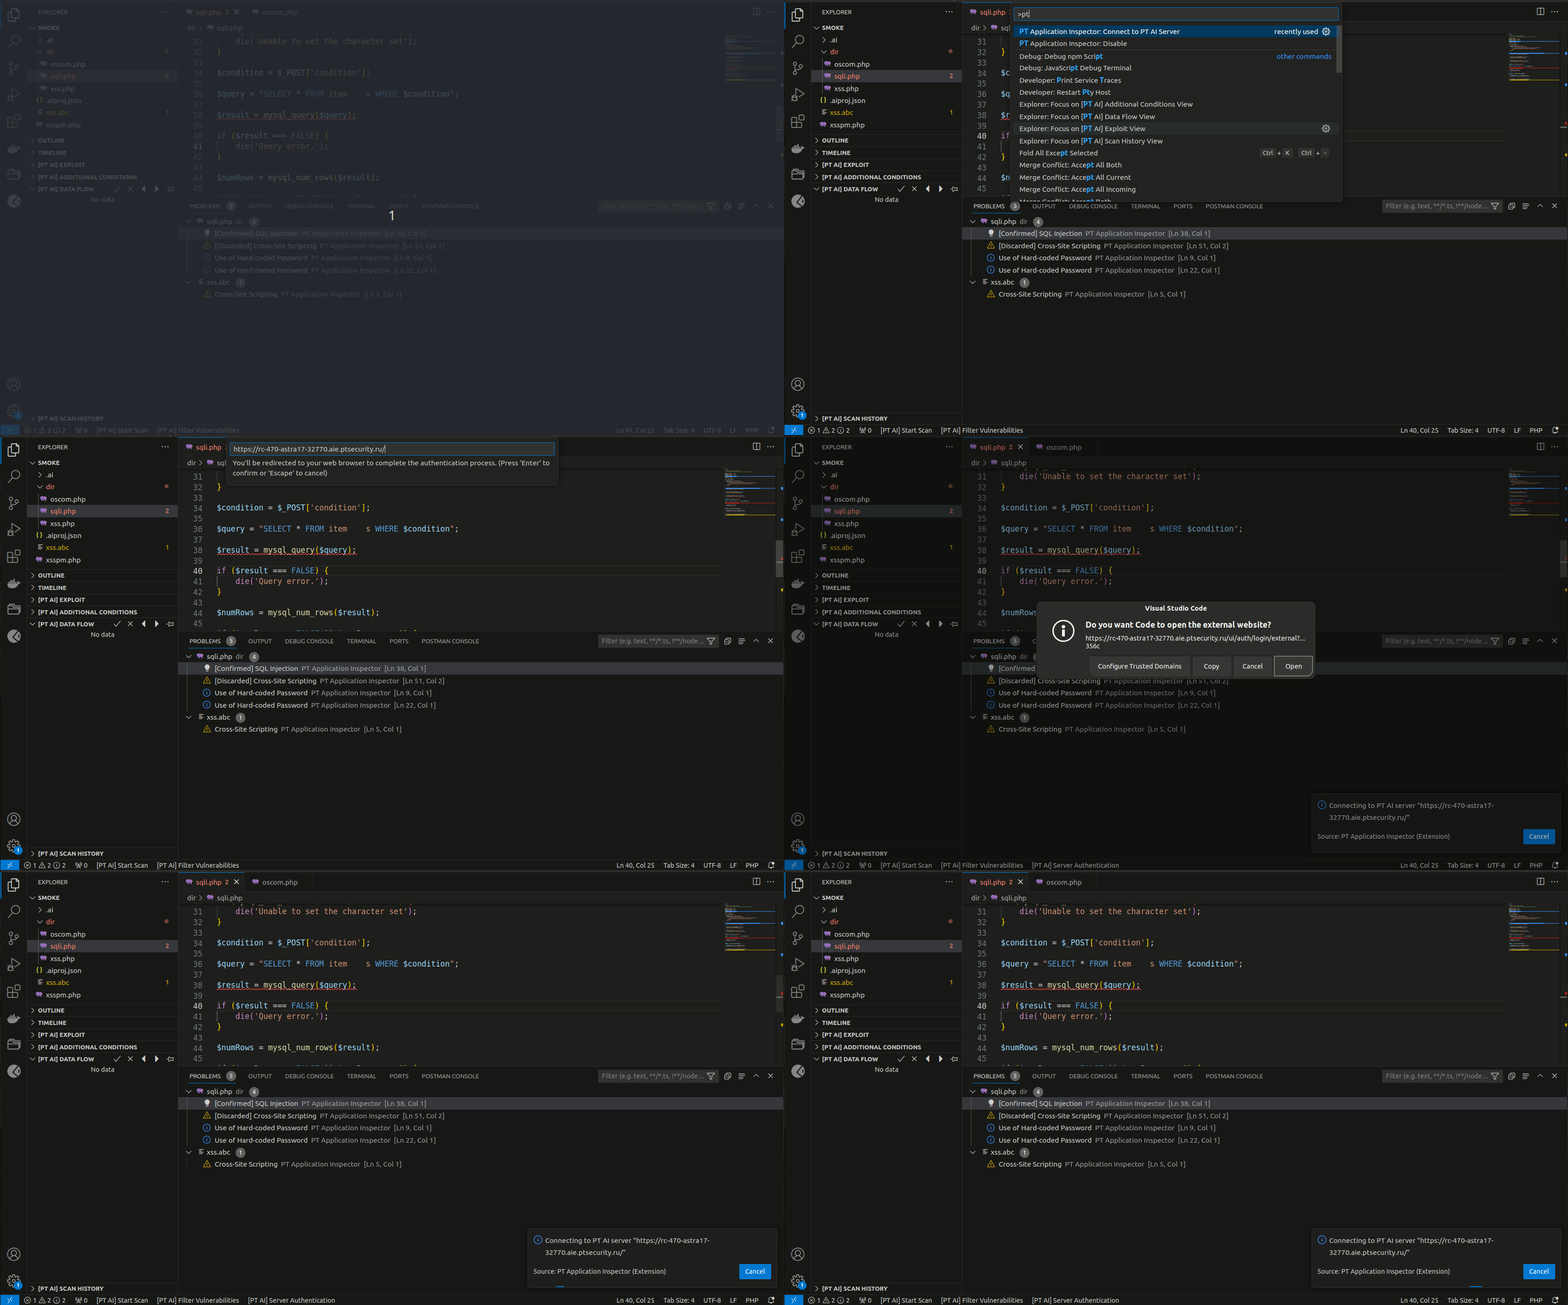
Enter the PT AI Enterprise Server URL and sign in to PT AI Enterprise Edition via your SSO system.
-
Synchronize a local project in Visual Studio Code and a project in PT AI Enterprise Server in one of the following ways:
-
Upload a local project to PT AI Enterprise Server
-
Connect a local project to an existing project in PT AI Enterprise Server
-
Download a project from PT AI Enterprise Server to a local file system
-
- Work with code, scan, confirm, and discard vulnerabilities as you normally do.
The statuses of detected vulnerabilities are synchronized automatically, and all the team members can assess the current threat level.
For more information about the integration, see the PT AI Enterprise Edition User Guide.
Plugin commands and settings
Plugin commands
To start working with the plugin, you can enter the following commands into the command palette:
PT Application Inspector: Start Scan. Start a project scan.PT Application Inspector: Start Full Scan. Start a full scan of a project.PT Application Inspector: Stop Scan. Stop the scan.PT Application Inspector: Show Vulnerabilities. You can also filter vulnerabilities by severity, confirmation, and suppression status. Only the vulnerabilities that match the selected filters will be displayed.PT Application Inspector: Enable. Enable the plugin for the current project.PT Application Inspector: Disable. Disable the plugin for the current project.PT Application Inspector: Download Analyzer. Download the latest version of the code analyzer.PT Application Inspector: Restart. Restart the plugin.PT Application Inspector: Create .aiignore File. Create an exclusion configuration file. In the.aiignorefile, you can specify folders, files, and file formats to be excluded from scanning using the.gitignorefile syntax. For more information, see git-scm.com/docs/gitignore.PT Application Inspector: Create Project Settings File. Create the configuration fileaiproj.json. In the file, you can change default scan settings. You can also use the SkipGitIgnoreFiles setting to exclude from scanning files and folders from the.gitignorefile. By default, this setting is enabled.PT Application Inspector: Connect to PT AI Server. Connect to PT AI Enterprise Server (command for integration with PT AI Enterprise Edition).PT Application Inspector: Reconnect to PT AI Server (Connected). Reconnect to PT AI Enterprise Server (command for integration).PT Application Inspector: Disconnect from PT AI Server. Disconnect from PT AI Enterprise Server (command for integration).PT Application Inspector: PT AI Server Authentication. Enter the authentication token (command for integration).PT Application Inspector: Manage Projects. Display the list of projects from PT AI Enterprise Server (command for integration). With this command, you can select a project in PT AI Enterprise Server and connect your local project to it in Visual Studio Code.PT Application Inspector: Create PT AI Server Project. Upload a local project from IDE to PT AI Enterprise Server (command for integration).
Plugin settings
You can configure the plugin settings by going to the action panel and clicking Extensions → PT Application Inspector → the gear icon → Extension Settings.
The plugin configuration page contains the following settings:
- Allow telemetry collection. Collection of general scan information to be sent to PT AI Enterprise Edition. By default, the setting is enabled.
- Analyzer log level. The severity level starting from which the code analyzer events will be logged. The default value is "Error."
- Automatically enable for any project. Silent activation of the plugin when opening a project. By default, the setting is disabled.
- Developer mode. Advanced plugin features. By default, this setting is disabled.
- Maximum number of stored log files. The default value is "100."
- Number of days to store log files. The default value is "30."
- Number of scan results. Maximum number of scan results saved in the scan result history. The default value is "10." If the limit is exceeded, each new scan result deletes the oldest result.
- Trigger scan. The start scan condition: manually on clicking a start button or automatically when a project file is changed. The default value is "Manually."
- Use all available resources for scanning. The use of all available RAM and CPU resources to increase scanning speed. By default, this setting is disabled.
- AI server URL. The address of the connected PT AI Enterprise Server.
- Username. The name of an authorized user.
Requirements
For the correct operation of the PT Application Inspector plugin, the following technical requirements must be met:
- Visual Studio Code IDE 1.72.0 or later
- 8 GB RAM
- 5 GB of free hard drive space
Supported 64-bit OS:
- Debian 11 Bullseye or later
- Fedora Workstation 38 or later
- OpenSUSE Leap 15.5 or later
- Ubuntu 22.04 LTS or later
- Ubuntu 23.04 or later
- Windows 10
- ALT Linux OS in the test mode
Supported macOS:
- Big Sur 11.5 or later
- Monterey 12.0.0 or later
Privacy statement
By default, the PT Application Inspector plugin collects anonymous usage data and sends it to our experts so that they can better understand how to improve the product. We do not share the collected information with third parties. We do not collect source code or IP addresses. To stop the data collection, disable the Allow telemetry collection setting.