ggtrendline: an R package for adding trendline and confidence interval to ggplot
1. Installing "ggtrendline" package in R
-
Get the released version from CRAN:
install.packages("ggtrendline") -
Or the development version from Github:
install.packages("devtools")
devtools::install_github("PhDMeiwp/ggtrendline@master", force = TRUE)
library(ggtrendline)
2. Using "ggtrendline" package
library(ggplot2)
library(ggtrendline)
x <- c(1, 3, 6, 9, 13, 17)
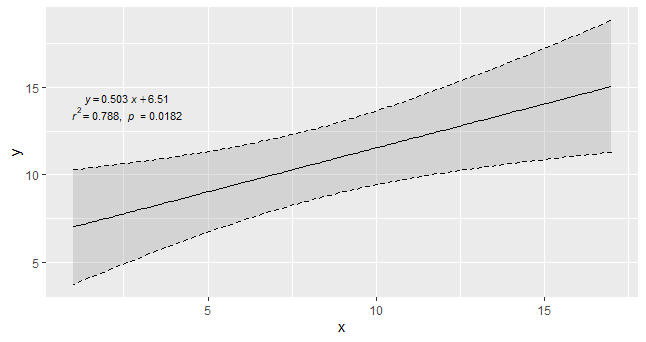
y <- c(5, 8, 11, 13, 13.2, 13.5)2.1 default ("line2P")
ggtrendline(x, y, model = "line2P") 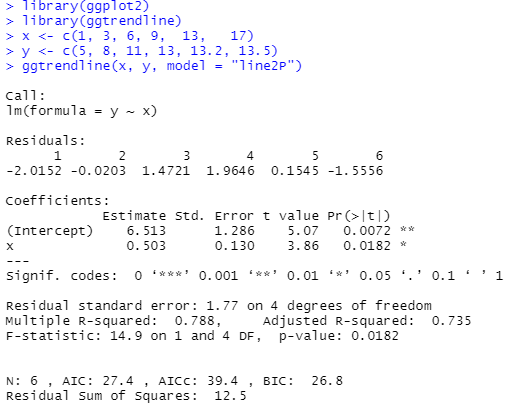
2.2 add geom_point()
ggtrendline(x, y, model = "line3P") + geom_point(aes(x, y)) + theme_bw()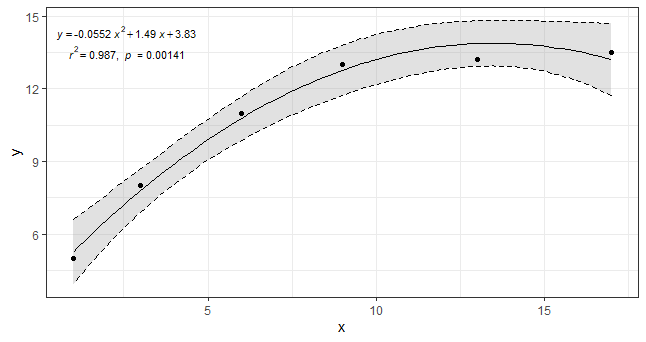
2.3 CI lines only, without CI filling
 ggtrendline(x, y, model = "log2P", CI.fill = NA) +
geom_point(aes(x, y))+ theme_classic() 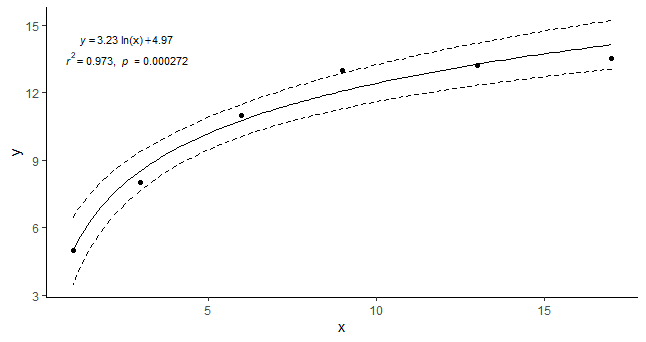
2.4 set the regression line and geom_point()
 ggtrendline(x, y, model = "exp2P", linecolor = "blue", linetype = 1, linewidth = 1) +
geom_point(aes(x, y), color = "blue", shape = 1, size = 3) 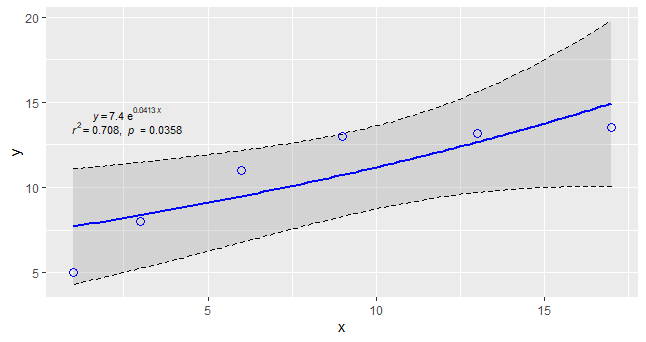
2.5 set confidence interval
 ggtrendline(x, y, model = "exp3P", CI.level = 0.99,
            CI.fill = "red", CI.alpha = 0.1, CI.color = NA, CI.lty = 2, CI.lwd = 1.5) +
geom_point(aes(x, y)) 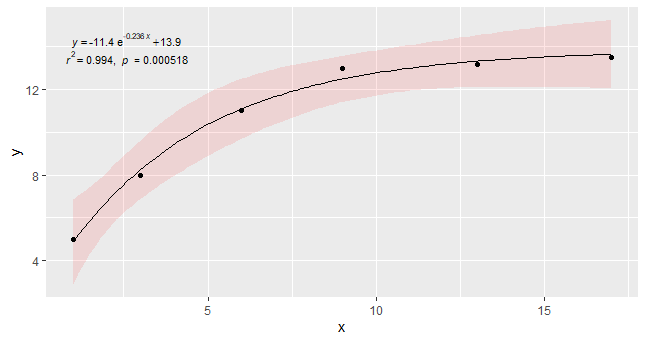
2.6 one trendline with different points belonged to multiple groups.
    library(ggplot2)
    library(ggtrendline)
    data("iris")
    x <- iris$Petal.Width
    y <- iris$Petal.Length
    group <- iris$Species
    ggtrendline(x,y,"exp3P") + geom_point(aes(x,y,color=group))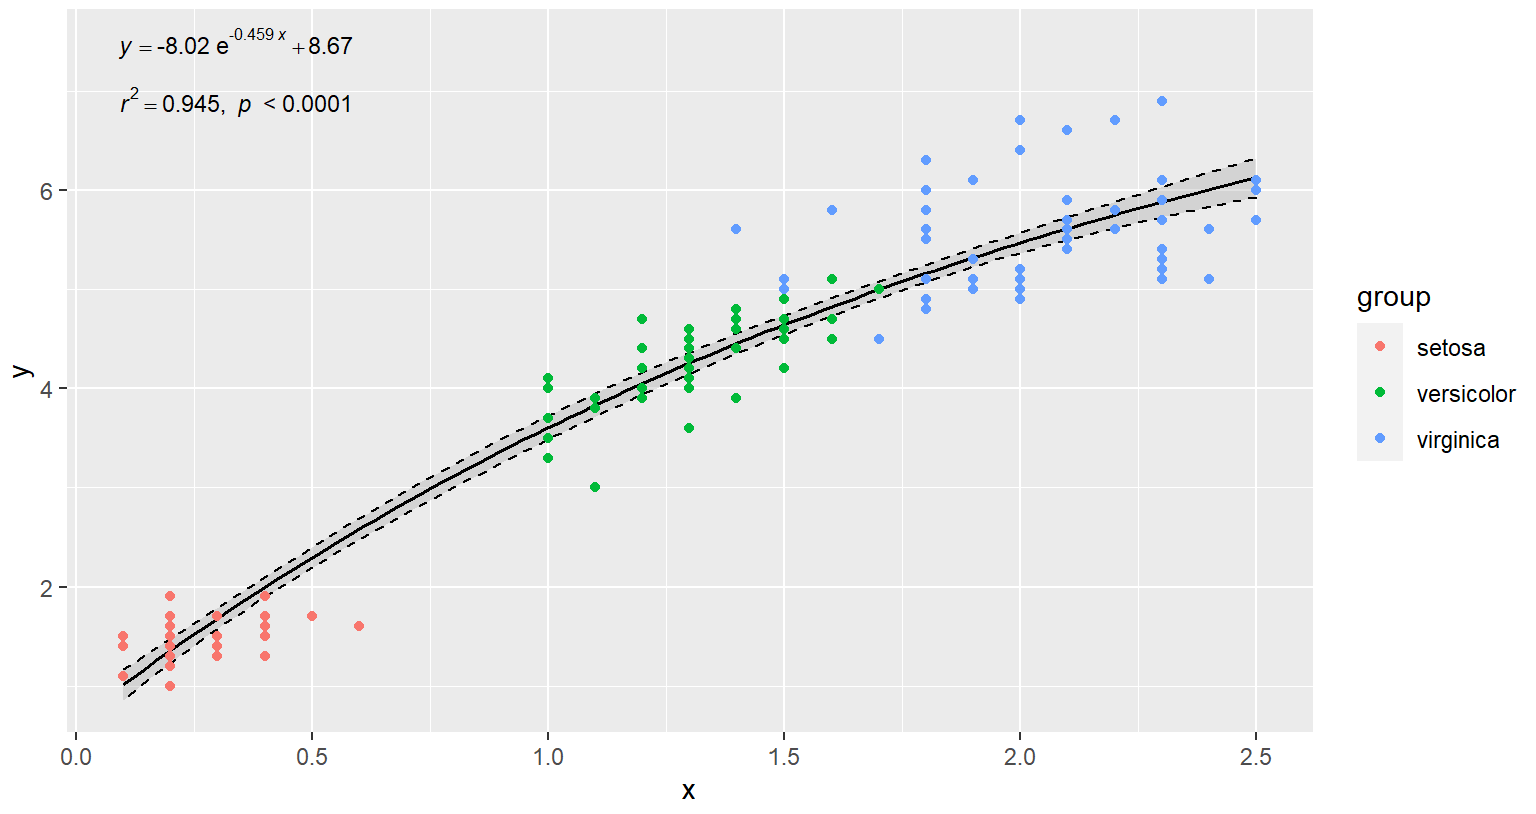
3. Details
3.1 Description
The 'ggtrendline' package is developed for adding trendline and confidence interval of linear or nonlinear regression model, and showing equation, R square, and P value to 'ggplot' as simple as possible.
For a general overview of the methods used in this package,
see Ritz and Streibig (2008) <doi:10.1007/978-0-387-09616-2> and
Greenwell and Schubert Kabban (2014) <doi:10.32614/RJ-2014-009>.
3.2 ggtrendline function
The built-in 'ggtrendline()' function includes the following models:
"line2P", formula as: y = a*x + b;
"line3P", y = a*x^2 + b*x + c;
"log2P" , y = a*ln(x) + b;
"exp2P", y = a*exp(b*x);
"exp3P", y = a*exp(b*x) + c;
"power2P", y = a*x^b;
"power3P", y = a*x^b + c.
3.3 stat_eq and stat_rrp functions
The built-in 'stat_eq()' and 'stat_rrp()' functions can be used separately, i.e., not together with 'ggtrendline()' function.
To see more details, you can run the following R code if you have the "ggtrendline" package installed:
library(ggtrendline)
?ggtrendline
?stat_eq
?stat_rrp
4. Contact
- Bugs and feature requests can be filed to https://github.com/PhDMeiwp/ggtrendline/issues.
- BTW, Pull requests are also welcome.
5. Acknowledgements
We would like to express our special thanks to Uwe Ligges, Gregor Seyer, and CRAN team for their valuable comments to the 'ggtrendline' package.