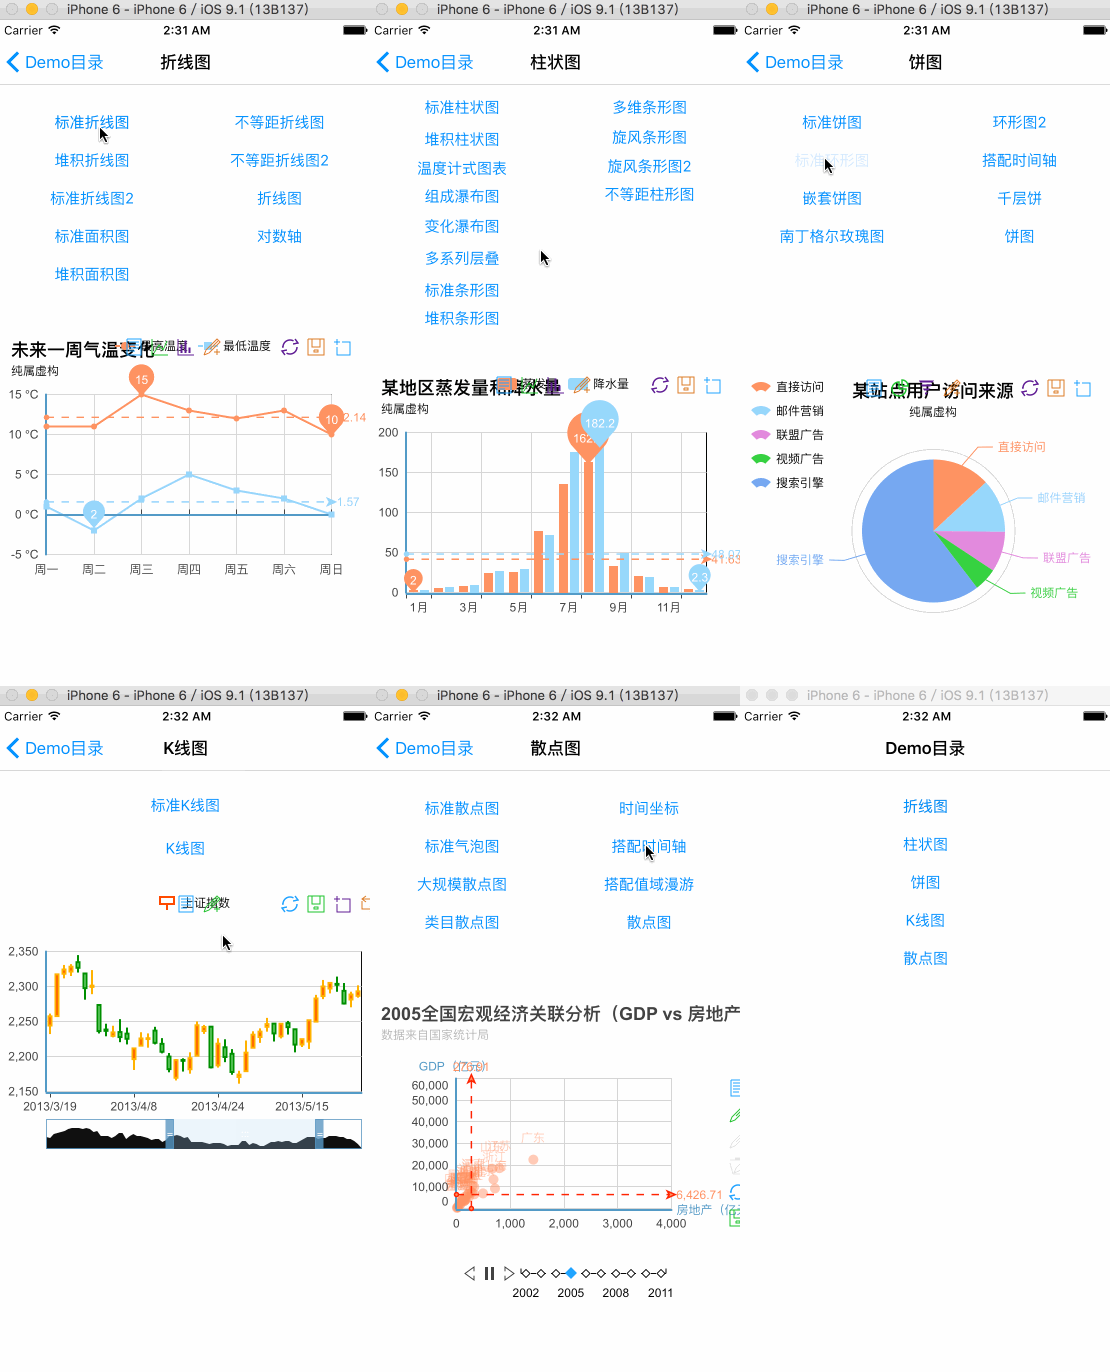
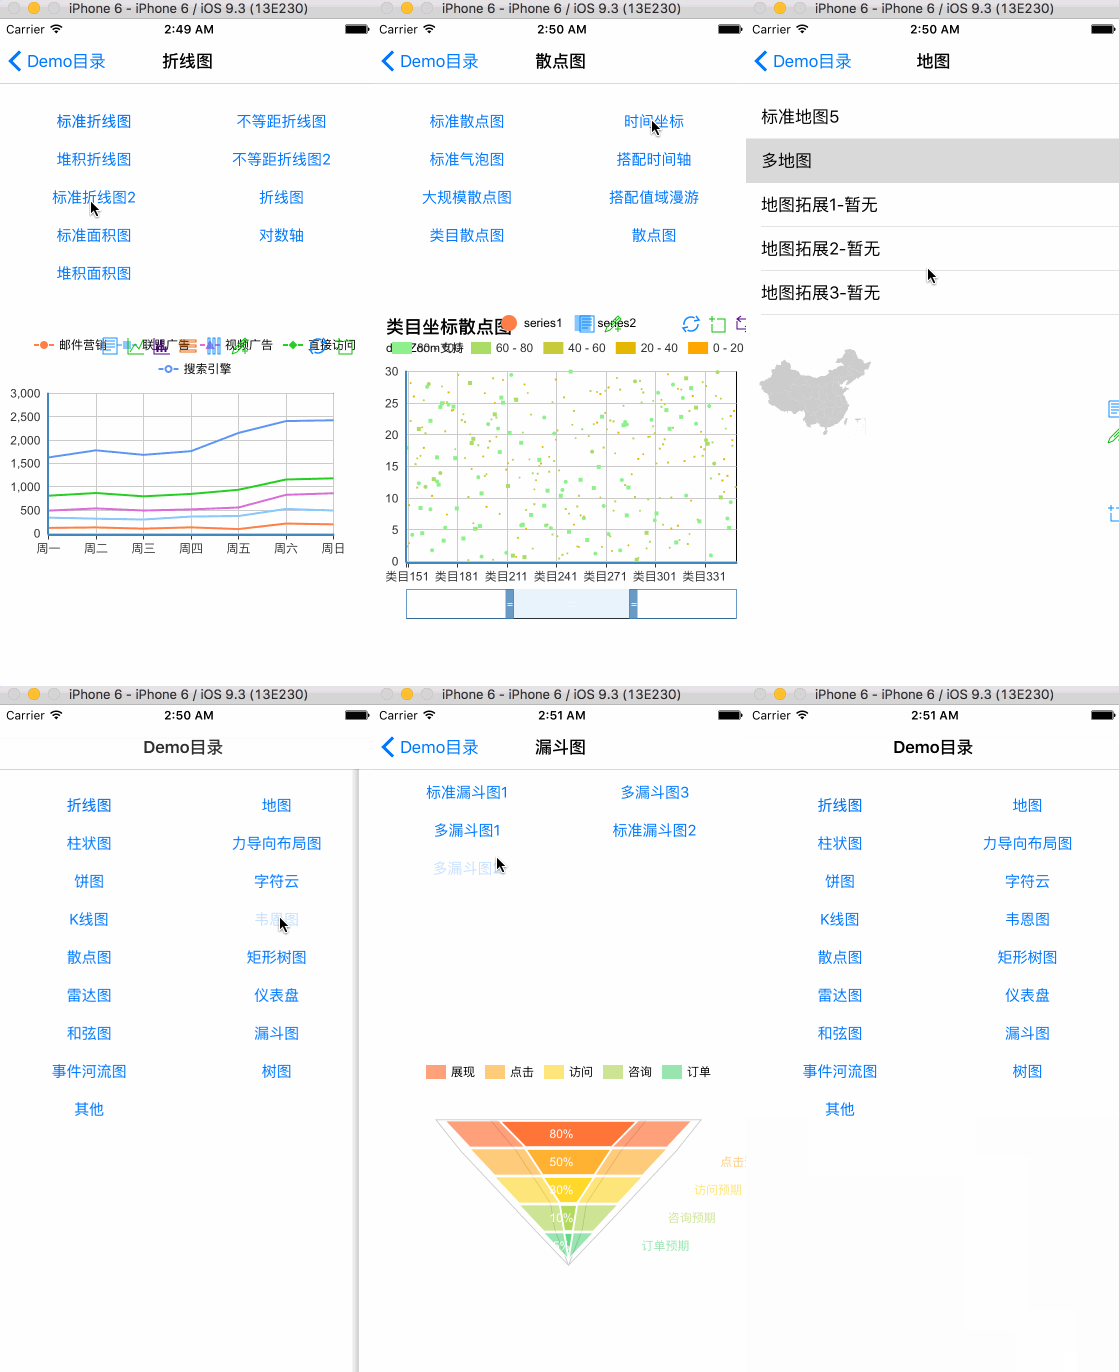
iOS- Echarts - A control build with echarts
This is a highly custom chart control for iOS and Mac apps, which build with the Echart(Echart2). It just encapsulate the conrol of the javascript. It provides a chainable way of describing your configurations for the echarts. It's convinient for foucing on the logic of the app and optimizing the code. It avoid diverting developers' mind on the interaction between javascript and Objective-C.
Tips: If you want to use even iOS8.0, I suggest you use
WKEchartsViewwhich is based onWKWebView. The interface ofWKEchartsViewis same asPYEchartsView, so if you are usingPYEchartsView, you just changePYEchartsViewintoWKEchartsView.
If you like this control, please star it. It can make me pay more attention on it.
And also if you find a issue, please issue me. Pull requests are warmly welcome as well.


Echarts Informations
Installation
There are two ways to use iOS-Echarts in you project:
- Using cocoapods:
pod iOS-Echarts - Manually:
- First, copying all the files into you project
- Second,
Remove referencesthe directory named 'js' - Finnaly, add the directory named 'js' and 'theme' by
create floder references
⚠️ Please Be Sure The Color Of js and theme Directory Is Blue. ⚠️
You should import one header file in your project:iOS-Echarts.h when you will use it.
Finally you just need to initialze the PYEchartsView and PYOption you need.
If you don't know how to set the right value for the option, you can check the documents in the EChart Website.
Usage
The common step like the under codes:
// Firstly, you should have a instance of PYEchartsView
@property (weak, nonatomic) IBOutlet PYEchartsView *echartsView;

...

PYOption *option = ... // Then, configure something about options
// Finally, load echarts view
[_echartsView setOption:option];
[_echartsView loadEcharts];
All properties setter are chainable, you can use [property-name]Equal
PYOption *option = [PYOption initPYOptionWithBlock:^(PYOption *option) {

    option.titleEqual([PYTitle initPYTitleWithBlock:^(PYTitle *title) {
        title.textEqual(@"Event River").subtextEqual(@"Test subtext");
    }])
    .tooltipEqual([PYTooltip initPYTooltipWithBlock:^(PYTooltip *tooltip) {
        tooltip.triggerEqual(PYTooltipTriggerItem).enterableEqual(YES);
    }])
    .legendEqual([PYLegend initPYLegendWithBlock:^(PYLegend *legend) {
        legend.dataEqual(@[@"first data", @"second data"]);
    }])
    .toolboxEqual([PYToolbox initPYToolboxWithBlock:^(PYToolbox *toolbox) {
        toolbox.showEqual(YES).featureEqual([PYToolboxFeature initPYToolboxFeatureWithBlock:^(PYToolboxFeature *feature) {
            feature.markEqual([PYToolboxFeatureMark initPYToolboxFeatureMarkWithBlock:^(PYToolboxFeatureMark *mark) {
                mark.showEqual(YES);
            }])
            .restoreEqual([PYToolboxFeatureRestore initPYToolboxFeatureRestoreWithBlock:^(PYToolboxFeatureRestore *restore) {
                restore.showEqual(YES);
            }]);
        }]);
    }])
    .xAxisEqual([[NSMutableArray alloc] initWithArray:@[axis]])
    .seriesEqual([[NSMutableArray alloc] initWithArray:@[series1, series2]])
    .gridEqual([PYGrid initPYGridWithBlock:^(PYGrid *grid) {
        grid.xEqual(@10)
        .x2Equal(@30);
    }]);
}];
Many properties support add[Name] and add[Name]Arr methods, when you use properties which type is NSMutableArray, you should try add method first
option.addXAxis(//Something about PYAxis)
.addYAxis(//Something about PYAxis)
.addSeries(//Something about PYSeries or sub class of PYSeries)
When you use the instance which is subclass of PYSeries, you should assign value for the property of subclass, then assign value for PYSeries, like this:
.addSeries([PYCartesianSeries initPYCartesianSeriesWithBlock:^(PYCartesianSeries *series) {
    series.stackEqual(@"Total")
    .smoothEqual(YES)
    .symbolEqual(PYSymbolArrow)
    .symbolSizeEqual(@6)
    .symbolRotateEqual(@(-45))
    .nameEqual(@"Data1")
    .typeEqual(PYSeriesTypeLine)
    .itemStyleEqual([PYItemStyle initPYItemStyleWithBlock:^(PYItemStyle *itemStyle) {
        itemStyle.normalEqual([PYItemStyleProp initPYItemStylePropWithBlock:^(PYItemStyleProp *normal) {
            normal.colorEqual(PYRGBA(255, 0, 0, 1))
            .lineStyleEqual([PYLineStyle initPYLineStyleWithBlock:^(PYLineStyle *lineStyle) {
                lineStyle.widthEqual(@2).typeEqual(PYLineStyleTypeDashed);
            }]);
        }]).emphasisEqual([PYItemStyleProp initPYItemStylePropWithBlock:^(PYItemStyleProp *emphasis) {
            emphasis.colorEqual(PYRGBA(0, 0, 255, 1));
        }]);
    }])
    .dataEqual(@[@(320), @(332), @"-", @(334), @{@"value":@(390),@"symbol":@"star6",@"symbolSize":@(20),@"symbolRotate":@(10),@"itemStyle":@{@"normal":@{@"color":@"yellowgreen"},@"emphasis":@{@"color":@"orange",@"lable":@{@"show":@(YES),@"position":@"inside",@"textStyle":@{@"fontSize":@(20)}}}}}, @(330), @(320)]);
}])
The PYCartesianSeries is subclass of PYSeries, and stack, smooth, symbol, symbolSize and symbol are the properties of PYCartesianSeries. So you should assign them before the properies of PYSeries.
You also can assign all values one by one:
PYEventRiverSeries *series1 = [PYEventRiverSeries initPYEventRiverSeriesWithBlock:^(PYEventRiverSeries *series) {
    series.weight = @123;
    series.name = @"Series name";
    series.type = PYSeriesTypeEventRiver;
}];
All propertis can use init[Type]WithBlock for creation:
PYAxis *axis = [PYAxis initPYAxisWithBlock:^(PYAxis *axis) {
    axis.typeEqual(PYAxisTypeTime).boundaryGapEqual(@[@0.05, @0.1]);
}];
Contact
Follow and contact me on Twitter or Sina Weibo. And if you want to contribute with this projust, please contact me as well.
If you have QQ, you can join the group which number is 485591970.
Licenses
All source code is licensed under the MIT License.
