 dave-fl
commented
5 years ago
dave-fl
commented
5 years ago Is it possible to replicate the benchmarks from here and also list the hardware used they use fp16 and fp32.
https://lambdalabs.com/blog/2080-ti-deep-learning-benchmarks/
Open NIIAS3050 opened 5 years ago
dave-fl
commented
5 years ago Is it possible to replicate the benchmarks from here and also list the hardware used they use fp16 and fp32.
https://lambdalabs.com/blog/2080-ti-deep-learning-benchmarks/
 alexanderkjeldaas
commented
5 years ago
alexanderkjeldaas
commented
5 years ago @WannaBeOCer could you run with --batch-size=128 to match the other reported numbers in this issue?
 WannaBeOCer
commented
5 years ago
WannaBeOCer
commented
5 years ago @alexanderkjeldaas FP16 or FP32? With or without Fusion?
dave-fl
commented
5 years ago Shouldn’t all permutations be done?
WannaBeOCer
commented
5 years ago @alexanderkjeldaas Here are the stock results of a Radeon VII running Ubuntu 18.04 w/ kernel 4.18.0-25. Radeon VII with ROCm 2.6 and TF 2.0
python3 tf_cnn_benchmarks.py --num_gpus=1 --batch_size=128 --model=resnet50

Done warm up
Step    Img/sec total_loss
1   images/sec: 285.9 +/- 0.0 (jitter = 0.0)    7.972
10  images/sec: 285.8 +/- 0.1 (jitter = 0.1)    7.856
20  images/sec: 285.7 +/- 0.0 (jitter = 0.1)    7.913
30  images/sec: 285.7 +/- 0.0 (jitter = 0.2)    7.733
40  images/sec: 285.6 +/- 0.0 (jitter = 0.2)    7.968
50  images/sec: 285.6 +/- 0.0 (jitter = 0.2)    8.021
60  images/sec: 285.6 +/- 0.0 (jitter = 0.2)    7.896
70  images/sec: 285.6 +/- 0.0 (jitter = 0.3)    7.987
80  images/sec: 285.6 +/- 0.0 (jitter = 0.2)    7.807
90  images/sec: 285.6 +/- 0.0 (jitter = 0.2)    7.788
100 images/sec: 285.6 +/- 0.0 (jitter = 0.2)    7.823
----------------------------------------------------------------
total images/sec: 285.54
----------------------------------------------------------------

TF_ROCM_FUSION_ENABLE=1 python3 tf_cnn_benchmarks.py --num_gpus=1 --batch_size=128 --model=resnet50

Done warm up
Step    Img/sec total_loss
1   images/sec: 304.0 +/- 0.0 (jitter = 0.0)    7.972
10  images/sec: 304.8 +/- 0.1 (jitter = 0.2)    7.856
20  images/sec: 304.8 +/- 0.1 (jitter = 0.2)    7.913
30  images/sec: 304.8 +/- 0.1 (jitter = 0.2)    7.734
40  images/sec: 304.7 +/- 0.1 (jitter = 0.2)    7.966
50  images/sec: 304.7 +/- 0.1 (jitter = 0.2)    8.029
60  images/sec: 304.7 +/- 0.0 (jitter = 0.3)    7.894
70  images/sec: 304.7 +/- 0.1 (jitter = 0.3)    7.986
80  images/sec: 304.7 +/- 0.0 (jitter = 0.3)    7.814
90  images/sec: 304.7 +/- 0.0 (jitter = 0.2)    7.791
100 images/sec: 304.7 +/- 0.0 (jitter = 0.3)    7.808
----------------------------------------------------------------
total images/sec: 304.59
----------------------------------------------------------------

python3 tf_cnn_benchmarks.py --num_gpus=1 --batch_size=128 --model=resnet50 --use_fp16

Done warm up
Step    Img/sec total_loss
1   images/sec: 410.9 +/- 0.0 (jitter = 0.0)    7.876
10  images/sec: 411.0 +/- 0.2 (jitter = 0.6)    7.951
20  images/sec: 410.8 +/- 0.2 (jitter = 0.6)    7.950
30  images/sec: 410.7 +/- 0.1 (jitter = 0.6)    7.948
40  images/sec: 410.5 +/- 0.1 (jitter = 0.7)    7.954
50  images/sec: 410.4 +/- 0.1 (jitter = 0.8)    7.718
60  images/sec: 410.4 +/- 0.1 (jitter = 0.7)    7.909
70  images/sec: 410.3 +/- 0.1 (jitter = 0.6)    7.841
80  images/sec: 410.2 +/- 0.1 (jitter = 0.7)    7.965
90  images/sec: 410.2 +/- 0.1 (jitter = 0.7)    7.790
100 images/sec: 410.2 +/- 0.1 (jitter = 0.6)    7.776
----------------------------------------------------------------
total images/sec: 410.05
----------------------------------------------------------------

TF_ROCM_FUSION_ENABLE=1 python3 tf_cnn_benchmarks.py --num_gpus=1 --batch_size=128 --model=resnet50 --use_fp16

Done warm up
Step    Img/sec total_loss
1   images/sec: 435.4 +/- 0.0 (jitter = 0.0)    7.879
10  images/sec: 435.0 +/- 0.4 (jitter = 0.8)    7.955
20  images/sec: 435.0 +/- 0.3 (jitter = 1.1)    7.947
30  images/sec: 435.0 +/- 0.2 (jitter = 0.9)    7.948
40  images/sec: 434.8 +/- 0.2 (jitter = 0.9)    7.954
50  images/sec: 434.7 +/- 0.1 (jitter = 0.8)    7.710
60  images/sec: 434.7 +/- 0.1 (jitter = 0.8)    7.926
70  images/sec: 434.6 +/- 0.1 (jitter = 0.8)    7.841
80  images/sec: 434.5 +/- 0.1 (jitter = 0.8)    7.968
90  images/sec: 434.5 +/- 0.1 (jitter = 0.8)    7.790
100 images/sec: 434.5 +/- 0.1 (jitter = 0.8)    7.770
----------------------------------------------------------------
total images/sec: 434.31
----------------------------------------------------------------
aristeidist
commented
5 years ago
aristeidist
commented
5 years ago Hello, here are my results with:
AMD Ryzen 2600x | X470 | 2x Radeon VII | 16GB @3200 Ubuntu - ROCm 2.6 ----- TensorFlow=2.0.0b1
--resnet50 float32 and float16 w different batch sizes.

TF_ROCM_FUSION_ENABLE=1 python3 tf_cnn_benchmarks.py --num_gpus=2 --batch_size=64 --model=resnet50 --variable_update=parameter_server --local_parameter_device=cpu --use_fp16

1   images/sec: 649.8 +/- 0.0 (jitter = 0.0)    8.062
10  images/sec: 672.8 +/- 2.6 (jitter = 2.4)    7.859
20  images/sec: 675.6 +/- 1.6 (jitter = 4.0)    7.862
30  images/sec: 676.4 +/- 1.2 (jitter = 4.3)    7.924
40  images/sec: 676.1 +/- 1.0 (jitter = 4.3)    7.920
50  images/sec: 676.3 +/- 0.8 (jitter = 4.1)    7.910
60  images/sec: 676.4 +/- 0.7 (jitter = 3.8)    7.757
70  images/sec: 676.7 +/- 0.6 (jitter = 3.8)    7.909
80  images/sec: 676.6 +/- 0.6 (jitter = 4.0)    7.785
90  images/sec: 676.8 +/- 0.5 (jitter = 4.1)    7.934
100 images/sec: 676.3 +/- 0.5 (jitter = 4.4)    7.921
----------------------------------------------------------------
total images/sec: 676.03
----------------------------------------------------------------

TF_ROCM_FUSION_ENABLE=1 python3 tf_cnn_benchmarks.py --num_gpus=2 --batch_size=64 --model=resnet50 --variable_update=parameter_server --local_parameter_device=cpu

Step    Img/sec total_loss
1   images/sec: 505.5 +/- 0.0 (jitter = 0.0)    8.047
10  images/sec: 505.7 +/- 0.4 (jitter = 1.1)    7.920
20  images/sec: 505.0 +/- 0.4 (jitter = 1.7)    7.823
30  images/sec: 504.6 +/- 0.4 (jitter = 1.3)    8.010
40  images/sec: 504.6 +/- 0.3 (jitter = 1.3)    8.007
50  images/sec: 504.5 +/- 0.3 (jitter = 1.6)    7.822
60  images/sec: 504.2 +/- 0.3 (jitter = 1.6)    7.952
70  images/sec: 504.2 +/- 0.2 (jitter = 1.6)    7.812
80  images/sec: 503.9 +/- 0.3 (jitter = 1.7)    7.843
90  images/sec: 503.8 +/- 0.2 (jitter = 1.7)    7.957
100 images/sec: 503.7 +/- 0.2 (jitter = 1.8)    8.101
----------------------------------------------------------------
total images/sec: 503.56
----------------------------------------------------------------

TF_ROCM_FUSION_ENABLE=1 python3 tf_cnn_benchmarks.py --num_gpus=2 --batch_size=128 --model=resnet50 --variable_update=parameter_server --local_parameter_device=cpu

Step    Img/sec total_loss
1       images/sec: 531.2 +/- 0.0 (jitter = 0.0)        7.923
10      images/sec: 524.0 +/- 2.3 (jitter = 6.8)        7.900
20      images/sec: 529.1 +/- 2.0 (jitter = 8.2)        7.870
30      images/sec: 530.7 +/- 1.5 (jitter = 7.5)        7.867
40      images/sec: 530.6 +/- 1.3 (jitter = 7.4)        7.947
50      images/sec: 530.3 +/- 1.1 (jitter = 7.2)        7.789
60      images/sec: 530.8 +/- 1.0 (jitter = 7.2)        7.870
70      images/sec: 531.2 +/- 0.9 (jitter = 7.2)        7.804
80      images/sec: 531.5 +/- 0.9 (jitter = 7.2)        7.805
90      images/sec: 531.5 +/- 0.8 (jitter = 7.1)        7.804
100     images/sec: 531.6 +/- 0.8 (jitter = 6.9)        7.792
----------------------------------------------------------------
total images/sec: 531.50
----------------------------------------------------------------

TF_ROCM_FUSION_ENABLE=1 python3 tf_cnn_benchmarks.py --num_gpus=2 --batch_size=128 --model=resnet50 --variable_update=parameter_server --local_parameter_device=cpu --use_fp16

Step    Img/sec total_loss
1       images/sec: 791.5 +/- 0.0 (jitter = 0.0)        7.926
10      images/sec: 790.0 +/- 1.4 (jitter = 0.8)        7.902
20      images/sec: 789.4 +/- 1.2 (jitter = 1.2)        7.871
30      images/sec: 789.4 +/- 0.9 (jitter = 1.2)        7.867
40      images/sec: 789.0 +/- 0.8 (jitter = 1.6)        7.943
50      images/sec: 788.9 +/- 0.7 (jitter = 1.9)        7.790
60      images/sec: 788.8 +/- 0.6 (jitter = 2.2)        7.871
70      images/sec: 788.4 +/- 0.6 (jitter = 2.5)        7.806
80      images/sec: 788.4 +/- 0.5 (jitter = 2.5)        7.807
90      images/sec: 788.3 +/- 0.5 (jitter = 2.6)        7.812
100     images/sec: 787.9 +/- 0.4 (jitter = 2.5)        7.798
----------------------------------------------------------------
total images/sec: 787.76
----------------------------------------------------------------

TF_ROCM_FUSION_ENABLE=1 python3 tf_cnn_benchmarks.py --num_gpus=2 --batch_size=256 --model=resnet50 --variable_update=parameter_server --local_parameter_device=cpu --use_fp16

Step    Img/sec total_loss
1   images/sec: 867.1 +/- 0.0 (jitter = 0.0)    7.838
10  images/sec: 868.5 +/- 0.3 (jitter = 1.1)    7.875
20  images/sec: 868.2 +/- 0.3 (jitter = 1.2)    7.929
30  images/sec: 867.9 +/- 0.3 (jitter = 1.5)    7.815
40  images/sec: 867.5 +/- 0.3 (jitter = 1.7)    7.775
50  images/sec: 866.8 +/- 0.4 (jitter = 2.0)    7.762
60  images/sec: 866.5 +/- 0.3 (jitter = 2.5)    7.755
70  images/sec: 866.0 +/- 0.3 (jitter = 2.6)    7.718
80  images/sec: 865.7 +/- 0.3 (jitter = 2.9)    7.759
90  images/sec: 865.4 +/- 0.3 (jitter = 3.0)    7.739
100 images/sec: 865.1 +/- 0.3 (jitter = 2.9)    7.695
----------------------------------------------------------------
total images/sec: 865.00
----------------------------------------------------------------

--Inception--

TF_ROCM_FUSION_ENABLE=1 python3 tf_cnn_benchmarks.py --num_gpus=2 --batch_size=64 --model=inception3 --variable_update=parameter_server --local_parameter_device=cpu --use_fp16

Step    Img/sec total_loss
1   images/sec: 308.5 +/- 0.0 (jitter = 0.0)    7.298
10  images/sec: 311.1 +/- 0.4 (jitter = 0.9)    7.346
20  images/sec: 311.0 +/- 0.3 (jitter = 0.6)    7.338
30  images/sec: 311.1 +/- 0.2 (jitter = 0.5)    7.325
40  images/sec: 310.9 +/- 0.2 (jitter = 0.7)    7.283
50  images/sec: 310.8 +/- 0.2 (jitter = 0.9)    7.369
60  images/sec: 310.8 +/- 0.2 (jitter = 0.9)    7.292
70  images/sec: 310.6 +/- 0.2 (jitter = 0.9)    7.315
80  images/sec: 310.5 +/- 0.1 (jitter = 1.0)    7.334
90  images/sec: 310.4 +/- 0.1 (jitter = 1.1)    7.340
100 images/sec: 310.3 +/- 0.1 (jitter = 1.1)    7.316
----------------------------------------------------------------
total images/sec: 310.26
----------------------------------------------------------------
himanshugoel2797
commented
5 years ago
himanshugoel2797
commented
5 years ago Ran some benchmarks on Radeon VII, TF 1.14.1, Kernel 4.18, ROCm 2.7:
python3 tf_cnn_benchmarks.py --num_gpus=1 --batch_size=128 --model=resnet50

Done warm up
Step    Img/sec total_loss
1   images/sec: 296.2 +/- 0.0 (jitter = 0.0)    7.972
10  images/sec: 296.4 +/- 0.1 (jitter = 0.3)    7.856
20  images/sec: 296.2 +/- 0.1 (jitter = 0.3)    7.913
30  images/sec: 296.0 +/- 0.1 (jitter = 0.3)    7.734
40  images/sec: 295.8 +/- 0.1 (jitter = 0.4)    7.971
50  images/sec: 295.7 +/- 0.1 (jitter = 0.7)    8.026
60  images/sec: 295.6 +/- 0.1 (jitter = 0.8)    7.892
70  images/sec: 295.5 +/- 0.1 (jitter = 0.7)    7.985
80  images/sec: 295.4 +/- 0.1 (jitter = 0.7)    7.804
90  images/sec: 295.3 +/- 0.1 (jitter = 0.7)    7.787
100 images/sec: 295.2 +/- 0.1 (jitter = 0.8)    7.813
----------------------------------------------------------------
total images/sec: 295.11
----------------------------------------------------------------

TF_ROCM_FUSION_ENABLE=1 python3 tf_cnn_benchmarks.py --num_gpus=1 --batch_size=128 --model=resnet50

Done warm up
Step    Img/sec total_loss
1   images/sec: 317.0 +/- 0.0 (jitter = 0.0)    7.972
10  images/sec: 317.2 +/- 0.1 (jitter = 0.3)    7.856
20  images/sec: 317.1 +/- 0.1 (jitter = 0.3)    7.913
30  images/sec: 316.9 +/- 0.1 (jitter = 0.4)    7.734
40  images/sec: 316.8 +/- 0.1 (jitter = 0.5)    7.968
50  images/sec: 316.6 +/- 0.1 (jitter = 0.5)    8.027
60  images/sec: 316.5 +/- 0.1 (jitter = 0.7)    7.896
70  images/sec: 316.4 +/- 0.1 (jitter = 0.8)    7.989
80  images/sec: 316.3 +/- 0.1 (jitter = 0.8)    7.808
90  images/sec: 316.2 +/- 0.1 (jitter = 0.8)    7.784
100 images/sec: 316.0 +/- 0.1 (jitter = 0.9)    7.808
----------------------------------------------------------------
total images/sec: 315.95
----------------------------------------------------------------

python3 tf_cnn_benchmarks.py --num_gpus=1 --batch_size=256 --model=resnet50 --use_fp16

Done warm up
Step    Img/sec total_loss
1   images/sec: 432.7 +/- 0.0 (jitter = 0.0)    7.808
10  images/sec: 432.1 +/- 0.2 (jitter = 0.7)    7.884
20  images/sec: 432.0 +/- 0.1 (jitter = 0.5)    8.012
30  images/sec: 431.9 +/- 0.1 (jitter = 0.5)    7.848
40  images/sec: 431.8 +/- 0.1 (jitter = 0.5)    7.787
50  images/sec: 431.6 +/- 0.1 (jitter = 0.8)    7.866
60  images/sec: 431.4 +/- 0.1 (jitter = 0.8)    7.874
70  images/sec: 431.2 +/- 0.1 (jitter = 1.1)    7.844
80  images/sec: 431.1 +/- 0.1 (jitter = 1.2)    7.856
90  images/sec: 430.9 +/- 0.1 (jitter = 1.2)    7.857
100 images/sec: 430.7 +/- 0.1 (jitter = 1.4)    7.743
----------------------------------------------------------------
total images/sec: 430.68
----------------------------------------------------------------

TF_ROCM_FUSION_ENABLE=1 python3 tf_cnn_benchmarks.py --num_gpus=1 --batch_size=256 --model=resnet50 --use_fp16

Done warm up
Step    Img/sec total_loss
1   images/sec: 458.7 +/- 0.0 (jitter = 0.0)    7.806
10  images/sec: 458.0 +/- 0.2 (jitter = 0.5)    7.883
20  images/sec: 457.6 +/- 0.2 (jitter = 0.6)    8.016
30  images/sec: 457.2 +/- 0.2 (jitter = 1.0)    7.843
40  images/sec: 456.9 +/- 0.1 (jitter = 1.1)    7.790
50  images/sec: 456.7 +/- 0.1 (jitter = 1.1)    7.862
60  images/sec: 456.5 +/- 0.1 (jitter = 1.1)    7.886
70  images/sec: 456.3 +/- 0.1 (jitter = 1.0)    7.846
80  images/sec: 456.1 +/- 0.1 (jitter = 1.1)    7.847
90  images/sec: 455.9 +/- 0.1 (jitter = 1.2)    7.856
100 images/sec: 455.7 +/- 0.1 (jitter = 1.4)    7.737
----------------------------------------------------------------
total images/sec: 455.60
----------------------------------------------------------------
So looks like there's been a bit more of a performance uplift!
 nikAizuddin
commented
5 years ago
nikAizuddin
commented
5 years ago Can anyone provide benchmarks for Radeon RX5700 XT?
himanshugoel2797
commented
5 years ago The 5700XT isn't supported in ROCm yet. I have the Anniversary Edition, but can't even really use it in Linux yet unless I use the latest kernel and its builtin driver instead of rock-dkms (which has better performance).
 ycsos
commented
5 years ago
ycsos
commented
5 years ago Here is my result for RTX5000 with tensorflow 2.0 and CUDA 10.0: command line is : python3 tf_cnn_benchmarks.py --num_gpus=1 --batch_size=128 --model=resnet50
Done warm up
Step    Img/sec total_loss
1   images/sec: 229.6 +/- 0.0 (jitter = 0.0)    7.972
10  images/sec: 229.8 +/- 0.1 (jitter = 0.3)    7.856
20  images/sec: 229.6 +/- 0.1 (jitter = 0.3)    7.914
30  images/sec: 229.4 +/- 0.1 (jitter = 0.3)    7.733
40  images/sec: 229.3 +/- 0.1 (jitter = 0.4)    7.966
50  images/sec: 229.1 +/- 0.1 (jitter = 0.6)    8.027
60  images/sec: 229.0 +/- 0.1 (jitter = 0.7)    7.891
70  images/sec: 228.9 +/- 0.1 (jitter = 0.7)    7.991
80  images/sec: 228.7 +/- 0.1 (jitter = 0.8)    7.805
90  images/sec: 228.6 +/- 0.1 (jitter = 1.0)    7.788
100 images/sec: 228.5 +/- 0.1 (jitter = 1.0)    7.819
----------------------------------------------------------------
total images/sec: 228.49
----------------------------------------------------------------
and python3 tf_cnn_benchmarks.py --num_gpus=1 --batch_size=128 --model=resnet50 --use_fp16
Done warm up
Step    Img/sec total_loss
1   images/sec: 438.0 +/- 0.0 (jitter = 0.0)    7.873
10  images/sec: 437.2 +/- 0.2 (jitter = 0.9)    7.953
20  images/sec: 437.4 +/- 0.1 (jitter = 0.6)    7.946
30  images/sec: 437.0 +/- 0.2 (jitter = 0.9)    7.940
40  images/sec: 436.8 +/- 0.1 (jitter = 0.8)    7.960
50  images/sec: 436.6 +/- 0.1 (jitter = 0.9)    7.707
60  images/sec: 436.6 +/- 0.1 (jitter = 0.8)    7.913
70  images/sec: 436.5 +/- 0.1 (jitter = 0.8)    7.836
80  images/sec: 436.4 +/- 0.1 (jitter = 0.8)    7.960
90  images/sec: 436.3 +/- 0.1 (jitter = 0.8)    7.799
100 images/sec: 436.2 +/- 0.1 (jitter = 0.9)    7.769
----------------------------------------------------------------
total images/sec: 436.11
----------------------------------------------------------------
jpizarrom
commented
5 years ago
jpizarrom
commented
5 years ago Hello, here are my results with:
AMD Ryzen 2600x | X370 | 16GB | 1x Radeon VII VBIOS version: 113-D3600200-106 Ubuntu 18.08 | 5.0.0-25-generic 26~18.04.1-Ubuntu rock-dev 2.7.22 | Docker rocm/tensorflow:rocm2.6-tf1.14-python3
python3 tf_cnn_benchmarks.py --num_gpus=1 --batch_size=128 --model=resnet50
Done warm up
Step    Img/sec total_loss
1   images/sec: 273.6 +/- 0.0 (jitter = 0.0)    8.221
10  images/sec: 273.3 +/- 0.2 (jitter = 0.4)    8.285
20  images/sec: 273.0 +/- 0.2 (jitter = 0.6)    8.062
30  images/sec: 272.8 +/- 0.2 (jitter = 0.7)    8.313
40  images/sec: 272.8 +/- 0.2 (jitter = 0.7)    8.162
50  images/sec: 272.7 +/- 0.1 (jitter = 0.7)    8.253
60  images/sec: 272.5 +/- 0.2 (jitter = 0.8)    8.184
70  images/sec: 272.2 +/- 0.2 (jitter = 1.0)    8.164
80  images/sec: 272.1 +/- 0.2 (jitter = 1.1)    8.144
90  images/sec: 272.0 +/- 0.2 (jitter = 1.2)    8.204
100 images/sec: 271.9 +/- 0.2 (jitter = 1.2)    8.151
----------------------------------------------------------------
total images/sec: 271.73
----------------------------------------------------------------

TF_ROCM_FUSION_ENABLE=1 python3 tf_cnn_benchmarks.py --num_gpus=1 --batch_size=128 --model=resnet50
Done warm up
Step    Img/sec total_loss
1   images/sec: 287.8 +/- 0.0 (jitter = 0.0)    8.221
10  images/sec: 291.1 +/- 0.5 (jitter = 1.2)    8.282
20  images/sec: 291.1 +/- 0.4 (jitter = 1.7)    8.053
30  images/sec: 290.8 +/- 0.3 (jitter = 1.5)    8.319
40  images/sec: 290.9 +/- 0.2 (jitter = 1.4)    8.193
50  images/sec: 291.1 +/- 0.2 (jitter = 1.4)    8.249
60  images/sec: 291.0 +/- 0.2 (jitter = 1.4)    8.182
70  images/sec: 290.8 +/- 0.2 (jitter = 1.3)    8.162
80  images/sec: 290.7 +/- 0.2 (jitter = 1.2)    8.138
90  images/sec: 290.7 +/- 0.2 (jitter = 1.2)    8.203
100 images/sec: 290.7 +/- 0.1 (jitter = 1.1)    8.142
----------------------------------------------------------------
total images/sec: 290.54
----------------------------------------------------------------

python3 tf_cnn_benchmarks.py --num_gpus=1 --batch_size=128 --model=resnet50 --use_fp16
Done warm up
Step    Img/sec total_loss
1   images/sec: 392.8 +/- 0.0 (jitter = 0.0)    8.215
10  images/sec: 388.5 +/- 1.8 (jitter = 2.5)    8.184
20  images/sec: 388.2 +/- 1.2 (jitter = 2.6)    8.328
30  images/sec: 388.8 +/- 0.8 (jitter = 1.4)    8.179
40  images/sec: 388.7 +/- 0.7 (jitter = 1.7)    8.154
50  images/sec: 389.1 +/- 0.6 (jitter = 2.2)    8.391
60  images/sec: 389.2 +/- 0.5 (jitter = 2.3)    8.255
70  images/sec: 389.3 +/- 0.4 (jitter = 2.0)    8.133
80  images/sec: 389.0 +/- 0.4 (jitter = 2.1)    8.276
90  images/sec: 388.6 +/- 0.4 (jitter = 2.5)    8.331
100 images/sec: 388.5 +/- 0.4 (jitter = 2.6)    8.207
----------------------------------------------------------------
total images/sec: 388.38
----------------------------------------------------------------

TF_ROCM_FUSION_ENABLE=1 python3 tf_cnn_benchmarks.py --num_gpus=1 --batch_size=128 --model=resnet50 --use_fp16
Done warm up
Step    Img/sec total_loss
1   images/sec: 403.4 +/- 0.0 (jitter = 0.0)    8.212
10  images/sec: 410.7 +/- 0.9 (jitter = 2.2)    8.182
20  images/sec: 410.4 +/- 0.7 (jitter = 2.5)    8.334
30  images/sec: 410.5 +/- 0.6 (jitter = 2.4)    8.191
40  images/sec: 410.7 +/- 0.4 (jitter = 2.2)    8.156
50  images/sec: 410.7 +/- 0.4 (jitter = 2.2)    8.384
60  images/sec: 410.4 +/- 0.4 (jitter = 2.1)    8.257
70  images/sec: 410.5 +/- 0.4 (jitter = 2.0)    8.133
80  images/sec: 410.3 +/- 0.3 (jitter = 2.1)    8.279
90  images/sec: 410.3 +/- 0.3 (jitter = 2.1)    8.329
100 images/sec: 410.2 +/- 0.3 (jitter = 2.2)    8.195
----------------------------------------------------------------
total images/sec: 410.02
----------------------------------------------------------------Hello, here are my results with:
AMD Ryzen 2600x | X370 | 16GB | 1x Radeon VII VBIOS version: 113-D3600200-106 Ubuntu 18.08 | 5.0.0-25-generic #26~18.04.1-Ubuntu rock-dev 2.7.22 | Docker rocm/tensorflow:rocm2.7-tf1.14-dev
python3 tf_cnn_benchmarks.py --num_gpus=1 --batch_size=128 --model=resnet50
Done warm up
Step    Img/sec total_loss
1   images/sec: 289.2 +/- 0.0 (jitter = 0.0)    8.221
10  images/sec: 289.3 +/- 0.3 (jitter = 0.9)    8.285
20  images/sec: 288.9 +/- 0.2 (jitter = 0.7)    8.055
30  images/sec: 288.8 +/- 0.2 (jitter = 0.7)    8.313
40  images/sec: 288.7 +/- 0.2 (jitter = 0.7)    8.184
50  images/sec: 288.4 +/- 0.2 (jitter = 1.0)    8.269
60  images/sec: 288.3 +/- 0.2 (jitter = 0.9)    8.187
70  images/sec: 288.2 +/- 0.2 (jitter = 1.1)    8.168
80  images/sec: 288.2 +/- 0.1 (jitter = 1.0)    8.152
90  images/sec: 288.1 +/- 0.1 (jitter = 1.1)    8.195
100 images/sec: 287.9 +/- 0.1 (jitter = 1.1)    8.141
----------------------------------------------------------------
total images/sec: 287.63
----------------------------------------------------------------

TF_ROCM_FUSION_ENABLE=1 python3 tf_cnn_benchmarks.py --num_gpus=1 --batch_size=128 --model=resnet50
Done warm up
Step    Img/sec total_loss
1   images/sec: 309.0 +/- 0.0 (jitter = 0.0)    8.222
10  images/sec: 307.8 +/- 0.5 (jitter = 1.1)    8.283
20  images/sec: 308.0 +/- 0.3 (jitter = 1.1)    8.068
30  images/sec: 307.3 +/- 0.4 (jitter = 1.6)    8.324
40  images/sec: 307.2 +/- 0.3 (jitter = 1.7)    8.178
50  images/sec: 306.9 +/- 0.3 (jitter = 1.8)    8.242
60  images/sec: 306.9 +/- 0.3 (jitter = 1.7)    8.158
70  images/sec: 307.0 +/- 0.3 (jitter = 1.2)    8.176
80  images/sec: 307.0 +/- 0.2 (jitter = 1.2)    8.148
90  images/sec: 306.9 +/- 0.2 (jitter = 1.2)    8.211
100 images/sec: 306.4 +/- 0.3 (jitter = 1.5)    8.157
----------------------------------------------------------------
total images/sec: 306.35
----------------------------------------------------------------

python3 tf_cnn_benchmarks.py --num_gpus=1 --batch_size=128 --model=resnet50 --use_fp16
Done warm up
Step    Img/sec total_loss
1   images/sec: 401.9 +/- 0.0 (jitter = 0.0)    8.212
10  images/sec: 400.0 +/- 0.9 (jitter = 2.9)    8.181
20  images/sec: 398.3 +/- 0.9 (jitter = 3.5)    8.313
30  images/sec: 396.8 +/- 0.9 (jitter = 5.3)    8.190
40  images/sec: 397.4 +/- 0.7 (jitter = 3.8)    8.155
50  images/sec: 397.5 +/- 0.6 (jitter = 3.4)    8.389
60  images/sec: 397.5 +/- 0.5 (jitter = 3.4)    8.262
70  images/sec: 397.6 +/- 0.4 (jitter = 3.0)    8.155
80  images/sec: 397.4 +/- 0.4 (jitter = 3.2)    8.279
90  images/sec: 397.3 +/- 0.4 (jitter = 3.2)    8.315
100 images/sec: 397.5 +/- 0.3 (jitter = 3.0)    8.191
----------------------------------------------------------------
total images/sec: 397.32
----------------------------------------------------------------

TF_ROCM_FUSION_ENABLE=1 python3 tf_cnn_benchmarks.py --num_gpus=1 --batch_size=128 --model=resnet50 --use_fp16
Done warm up
Step    Img/sec total_loss
1   images/sec: 419.3 +/- 0.0 (jitter = 0.0)    8.214
10  images/sec: 422.0 +/- 0.6 (jitter = 1.6)    8.178
20  images/sec: 423.5 +/- 0.5 (jitter = 2.6)    8.317
30  images/sec: 422.5 +/- 0.6 (jitter = 3.2)    8.209
40  images/sec: 422.5 +/- 0.5 (jitter = 2.9)    8.179
50  images/sec: 421.9 +/- 0.6 (jitter = 3.1)    8.395
60  images/sec: 421.9 +/- 0.5 (jitter = 3.2)    8.262
70  images/sec: 422.0 +/- 0.4 (jitter = 3.0)    8.119
80  images/sec: 422.0 +/- 0.4 (jitter = 2.6)    8.273
90  images/sec: 422.1 +/- 0.3 (jitter = 2.5)    8.328
100 images/sec: 421.7 +/- 0.4 (jitter = 2.7)    8.192
----------------------------------------------------------------
total images/sec: 421.52
----------------------------------------------------------------
20II
commented
4 years ago
20II
commented
4 years ago When I want to test with a model,raise many warning like this.
WARNING:tensorflow:Entity <bound method BatchNormalization.call of <tensorflow.python.layers.normalization.BatchNormalization object at 0x7f828f4d65c0>> could not be transformed and will be executed as-is. Please report this to the AutgoGraph team. When filing the bug, set the verbosity to 10 (on Linux, export AUTOGRAPH_VERBOSITY=10) and attach the full output. Cause: converting <bound method BatchNormalization.call of <tensorflow.python.layers.normalization.BatchNormalization object at 0x7f828f4d65c0>>: AssertionError: Bad argument number for Name: 3, expecting 4
At the end the program crashed
How to eliminate bug
 sunway513
commented
4 years ago
sunway513
commented
4 years ago Hi @20II , the warning message you've observed is due to the upstream tensorflow issue https://github.com/tensorflow/tensorflow/issues/32319 , please try the following command to fix it:
pip3 install gast==0.2.2
If you program still crashes, please firstly try our public docker images here:
https://hub.docker.com/r/rocm/tensorflow
Please feel free to create a dedicated issue to track, thanks.
 mwrnd
commented
4 years ago
mwrnd
commented
4 years ago Video Card: MSI Radeon RX 570 8GB OC (rocm-smi -v VBIOS version: 113V34122-F3)
Motherboard: MSI X570-A Pro with 32GB DDR4-3000
Processor: AMD Ryzen 5 3600X
OS: Ubuntu 18.04.2 no apt dist-upgrade
Kernel: 4.18.0-15-generic
rocm-dkms: 2.8.13 installed through apt
tensorflow-rocm: 1.14.2 installed through pip
tensorflow benchmarks: abb1aec2f2db4ba73fac2e1359227aef59b10258
tensorflow_models: 1.13.0
Benchmark dump. Command-line permutations were generated with cmds.py and log output processed with parse.py. Setup notes and a more complete summary are available.
imagenet dataset total images/sec:
python tf_cnn_benchmarks.py --device=GPU --num_gpus=1 --num_batches=40 \
--batch_size={16,32,64,128,256} --model={model} --data_name=imagenet

XR means XLA and ROCm Fusion were enabled
    export TF_XLA_FLAGS=--tf_xla_cpu_global_jit
    export TF_ROCM_FUSION_ENABLE=1
F means --use_fp16 option was used
C means MIOpen "36 Compute Unit" optimizations were used with this 32CU GPU:
    sudo cp /opt/rocm/miopen/share/miopen/db/gfx803_36.cd.pdb.txt \
    /opt/rocm/miopen/share/miopen/db/gfx803_32.cd.pdb.txt

na means the batch size was too large or benchmark would not run

model batchsize=16      32      032F    032XRF  64      064XR   128     128C
trivial         3937    7358    na      na      12534   12544   20000   na
alexnet         193     258     271     271     311     312     340     380
googlenet       121     136     135     135     143     143     145     144
inception3      22.3    22.9    25.9    26.5    23.7    24.3    26.7    28
inception4      10.7    10.9    12.4    12.6    12.5    na      na      na
lenet5          3535    5803    5707    5716    9145    8994    12749   14618
mobilenet       253     319     254     266     358     353     363     360
nasnet          7.3     8.1     8       9       8.7     8.2     9.1     8.2
official_ncf    1346    2683    na      na      5304    5289    10569   na
overfeat        56.4    74.1    75.2    74.7    87.3    87.3    95      95.1
resnet101       25.5    28.7    30.4    31.3    32.1    na      na      na
resnet101_v2    25.6    28.9    30.6    31.5    30.4    32.1    na      na
resnet152       17.8    20      20.9    21.4    21.9    na      na      na
resnet152_v2    17.9    20.1    21      21.5    22.1    na      na      na
resnet50        45      49.6    58.5    57.8    51.7    54.5    57.4    59.7
resnet50_v1.5   41.4    45.2    52.3    53.9    48.3    50.8    53.7    53.3
resnet50_v2     45.4    50.2    58.9    58.5    52.4    55.6    60.9    59
vgg11           33.4    37.5    39.4    39.5    40      39.8    41.1    41
vgg16           16.9    18.2    19.3    19.5    18.8    18.9    20.1    20.3
vgg19           13.7    14.7    15.6    15.6    15.2    15.2    16.1    16.2
Average Gain    0       0       +5.5%   +7.4%   0       +1.1%   0       +1.7%
Median Gain     0       0       +5.5%   +7.1%   0       +0.0%   0       +0.1%

* Average and Median gains use 0 as baselines; 32 is baseline for 32F, 32XRF
cifar10 dataset total images/sec:
python tf_cnn_benchmarks.py --device=GPU --num_gpus=1 --num_batches=40 \
--batch_size={16,32,64,128,256} --model={model} --data_name=cifar10

XR means XLA and ROCm Fusion were enabled
  export TF_XLA_FLAGS=--tf_xla_cpu_global_jit
  export TF_ROCM_FUSION_ENABLE=1
F means --use_fp16 option was used
C means MIOpen "36 Compute Unit" optimizations were used with this 32CU GPU:
  sudo cp /opt/rocm/miopen/share/miopen/db/gfx803_36.cd.pdb.txt \
  /opt/rocm/miopen/share/miopen/db/gfx803_32.cd.pdb.txt

model batchsize=16      32      32F     32XRF   64      64XR    128     128C
trivial         7394    14333   na      na      26098   27887   42625   na
alexnet         2548    4077    289     292     5603    5607    6821    6850
nasnet          na      45.7    48      47.7    52.6    53.9    93.5    53.8
resnet110       267     408     397     431     544     601     639     638
resnet110_v2    270     406     402     439     541     610     638     637
resnet20        1361    2066    1969    2098    2756    2970    3268    3270
resnet20_v2     1310    2021    1957    2110    2698    2986    3188    3192
resnet32        869     1342    1286    1374    1793    1957    2112    2114
resnet32_v2     876     1328    1282    1401    1767    1964    2083    2084
resnet44        652     993     955     1033    1320    1454    1559    1559
resnet44_v2     648     988     963     1044    1309    1469    1548    1544
resnet56        518     788     764     824     1050    1160    1234    1234
resnet56_v2     518     788     771     843     1046    1168    1227    1228
Average Gain    0       0       -2.4%   +4.8%   0       +9.9%   0       -0.1%
Median Gain     0       0       -3.1%   +4.6%   0       +10.5%  0       +0.0%

* nasnet/128 was excluded from Average Gain calculation as outlier
* Average and Median gains use 0 as baselines; 32 is baseline for 32F, 32XRF
CPU (Ryzen 5 3600X) total images/sec:
python tf_cnn_benchmarks.py --device=CPU --batch_size={32,64,128}
--num_batches=40 --model={model} --data_name={dataset}

model/dataset  batchsize=32     64     128
trivial/imagenet         2185   2803   4482
trivial/cifar10          32191  48349  62636
mobilenet/imagenet       188    201    207
ncf/imagenet             362    721    1453
NASNET-Large worked with a batch size of 8:
python tf_cnn_benchmarks.py --device=GPU --num_gpus=1 --compute_lr_on_cpu \
--batch_size=8  --num_batches=40 --model=nasnetlarge --data_name=imagenet
  [...]
  total images/sec: 0.64
DeepSpeech worked with a batch size of 16:
python tf_cnn_benchmarks.py --num_gpus=1 --batch_size=16 \
--model=deepspeech2 --data_name=librispeech
  [...]
  total images/sec: 0.50
rocm_bandwidth_test
RocmBandwidthTest Version: 2.3.4
Device: 0, AMD Ryzen 5 3600X 6-Core Processor
Device: 1, Ellesmere [Radeon RX 470/480/570/570X/580/580X], 2d:0.0
Unidirectional copy peak bandwidth GB/s
D/D 0 1
0 N/A 11.322347
1 11.060208 28.544707
Bdirectional copy peak bandwidth GB/s
D/D 0 1
0 N/A 14.792841
1 14.792841 N/Apython all_reduce_benchmark.py --variable_update=replicated
Average time per step: 0.000114200115204dkms status | grep amd
amdgpu, 2.8-13, 4.18.0-15-generic, x86_64: installeddmesg | grep kfd
[ 3.328899] kfd kfd: Allocated 3969056 bytes on gart
[ 3.329348] kfd kfd: added device 1002:67dfrocm-smi
========================ROCm System Management Interface====================
============================================================================
GPU Temp AvgPwr SCLK MCLK Fan Perf PwrCap VRAM% GPU%
0 70.0c 119.196W 1268Mhz 1750Mhz 70.98% auto 120.0W 96% 100%
============================================================================
==============================End of ROCm SMI Log ==========================Video Card: MSI Radeon RX 580 8GB OC (rocm-smi -v VBIOS version: Unable to get)
Motherboard: MSI X570-A Pro with 32GB DDR4-3000 BIOS H.40
Processor: AMD Ryzen 5 3600X
OS: Ubuntu 18.04.2 no apt dist-upgrade
Kernel: 4.18.0-15-generic
rocm-dkms: 2.8.13 installed through apt
tensorflow-rocm: 1.14.2 installed through pip
tensorflow benchmarks: abb1aec2f2db4ba73fac2e1359227aef59b10258
tensorflow_models: 1.13.0
Benchmark dump. Command-line permutations were generated with cmds.py and log output processed with parse.py.
See here for more complete benchmark results.
imagenet dataset total images/sec:
python tf_cnn_benchmarks.py --device=GPU --num_gpus=1 --num_batches=40 \
--batch_size={16,32,64,128,256} --model={model} --data_name=imagenet

XR means XLA and ROCm Fusion were enabled
  export TF_XLA_FLAGS=--tf_xla_cpu_global_jit
  export TF_ROCM_FUSION_ENABLE=1
F means --use_fp16 option was used

na means the batch size was too large or benchmark would not run

model batchsize=16      32      032F    032XRF  64      064XR   128     256
trivial         4012    7128    1162    1157    12965   2270    12521   21281
alexnet         223     318     325     327     396     401     446     466
googlenet       135     155     160     161     165     174     166     166
inception3      25.7    26.6    31.3    32.0    27.5    32.2    32.5    na
inception4      12.2    12.6    14.7    14.9    14.9    na      na      na
lenet5          3920    6918    6785    6761    11132   10556   16169   20677
mobilenet       270     338     275     273     389     339     396     405
nasnet          8.3     8.4     8.8     8.8     9.1     9.1     8.7     naq
official_ncf    1478    2927    2409    2409    5823    4788    5861    11478
overfeat        66.4    88.6    88.4    88.5    106     107     106     116
resnet101       29.1    33.3    36.0    36.8    37.9    na      na      na
resnet101_v2    29.3    33.6    36.2    37.2    35.7    38.0    37.8    na
resnet152       20.3    23.1    24.6    25.2    25.9    na      na      na
resnet152_v2    20.5    23.3    24.8    25.4    26.0    na      na      na
resnet50        51.4    57.9    65.8    67.7    61.0    70.0    64.1    71.3
resnet50_v1.5   47.4    52.8    59.0    60.7    57.1    63.0    60.5    63.6
resnet50_v2     51.8    58.5    66.3    68.4    61.7    70.7    65.7    71.8
vgg11           39.7    45.0    47.2    47.2    47.9    49.9    48.0    47.8
vgg16           20.3    21.9    23.6    23.5    22.6    24.2    22.7    24.4
vgg19           16.6    17.8    18.9    18.9    18.3    19.4    18.4    19.5
Average Gain    0       0       +4.9%   +6.2%   0       +1.5%   0       0
Median Gain     0       0       +6.4%   +7.3%   0       +0.7%   0       0

* Average and Median gains use 0 as baselines; 32 is baseline for 32F, 32XRF
* trivial is excluded from gain and median calculations as an outlier
cifar10 dataset total images/sec:
python tf_cnn_benchmarks.py --device=GPU --num_gpus=1 --num_batches=40 \
--batch_size={16,32,64,128,256} --model={model} --data_name=cifar10

model batchsize=16      32      32F     32XRF   64      64XR    128     256
trivial         7199    14904   9573    9371    24906   27120   44463   74973
alexnet         2791    4503    294     291     6058    6101    7480    8651
nasnet          na      53.8    53.0    52.2    61.0    60.0    104     na
resnet110       286     437     430     467     596     662     707     760
resnet110_v2    287     443     438     475     597     667     708     758
resnet20        1415    2234    2132    2251    3036    3282    3639    3937
resnet20_v2     1417    2193    2121    2249    2975    3284    3555    3842
resnet32        930     1453    1382    1485    1963    2162    2351    2532
resnet32_v2     931     1445    1391    1506    1943    2167    2312    2490
resnet44        695     1065    1030    1106    1451    1597    1735    1865
resnet44_v2     706     1069    1028    1107    1447    1609    1714    1846
resnet56        557     853     822     881     1151    1266    1369    1477
resnet56_v2     553     848     823     909     1145    1286    1363    1463
Average Gain    0       0       -3.1%   +3.5%   0       +9.5%   0       0
Median Gain     0       0       -3.3%   +3.6%   0       +10.4%  0       0

* Average and Median gains use 0 as baselines; 32 is baseline for 32F, 32XRF
* trivial and alexnet are excluded from gain, median calculations as outliers
NASNET-Large worked with a batch size of 8:
python tf_cnn_benchmarks.py --device=GPU --num_gpus=1 --compute_lr_on_cpu \
--batch_size=8  --num_batches=40 --model=nasnetlarge --data_name=imagenet
  [...]
  total images/sec: 0.69
DeepSpeech worked with a batch size of 16:
python tf_cnn_benchmarks.py --num_gpus=1 --batch_size=16 \
--model=deepspeech2 --data_name=librispeech
  [...]
  total images/sec: 0.56
rocm_bandwidth_test
RocmBandwidthTest Version: 2.3.4
Device: 0, AMD Ryzen 5 3600X 6-Core Processor
Device: 1, Ellesmere [Radeon RX 470/480/570/570X/580/580X], 2d:0.0
Unidirectional copy peak bandwidth GB/s
D/D 0 1
0 N/A 11.313248
1 11.323627 25.928202
Bdirectional copy peak bandwidth GB/s
D/D 0 1
0 N/A 14.760245
1 14.760245 N/Apython all_reduce_benchmark.py --variable_update=replicated
Average time per step: 0.000114479064941dkms status | grep amd
amdgpu, 2.8-13, 4.18.0-15-generic, x86_64: installeddmesg | grep kfd
[ 3.179217] kfd kfd: Allocated 3969056 bytes on gart
[ 3.179655] kfd kfd: added device 1002:67dfrocm-smi
========================ROCm System Management Interface====================
============================================================================
GPU Temp AvgPwr SCLK MCLK Fan Perf PwrCap VRAM% GPU%
0 75.0c 134.197W 1366Mhz 2000Mhz 54.9% auto 135.0W 98% 100%
============================================================================
==============================End of ROCm SMI Log ==========================Video Card: MSI Radeon RX 580 8GB OC (rocm-smi -v Cannot get VBIOS version)
Motherboard: MSI X570-A Pro with 32GB DDR4-2133 BIOS H.40
Processor: AMD Ryzen 5 3600X
OS: Ubuntu 18.04.0 no apt upgrade or apt dist-upgrade
Kernel: 4.15.0-20-generic
rocm-dkms: 1.9.3 installed through apt
tensorflow-rocm: 1.12.0 installed through pip
tensorflow benchmarks: 091ef1e4d8832e14d1f874e66bff78a2522d0947
tensorflow_models: 1.12.0
Benchmark dump and recreation of @kazulittlefox's results. My ROCm 2.8.13 results were significantly lower (~65%) than kazulittlefox's 1.9.2 results so I was concerned I may have a hardware issue. Always compare apples to apples. My 1.9.3 results are consistent with kazulittlefox's.
            |------batch size = 32------|    |------batch size = 64------|
model        @kaz   1.9.3  2.8.13  Perf%      @kaz   1.9.3  2.8.13  Perf%
alexnet      397    401    318     79%        518    511    396     78%
googlenet    239    247    155     63%        256    261    165     63%
inception3   47.8   48.9   26.6    54%        50.7   51.6   27.5    53%
resnet50     86.8   92.0   57.9    63%        98.6   100    61.0    61%
Between ROCm_1.9.3/TF1.12 and ROCm_2.8.13/TF1.14 performance gains were moved around and made more consistent at the expense of raw throughput. FP16 performance has improved. 2.8.13 is also more stable as I did not encounter a crash. ROCm 1.9.3 froze my computer twice and some benchmark attempts stalled indefinitely.
model   batchsize=   16      32      032F    032XRF  64      064XR   128
...
ROCm1.9.3/alexnet    256     401     262     263     511     529     627
ROCm2.8.13/alexnet   223     318     325     327     396     401     446
...
ROCm1.9.3/AVG Gain   0       0       -40.1%  -39.3%  0       +27.9%  0
ROCm1.9.3/MED Gain   0       0       -44.5%  -42.5%  0       +2.5%   0
...
ROCm2.8.13/AVG Gain  0       0       +4.9%   +6.2%   0       +1.5%   0
ROCm2.8.13/MED Gain  0       0       +6.4%   +7.3%   0       +0.7%   0
ROCm was installed without apt upgrade or apt dist-upgrade and used the version-specific ROCm repo:
sudo echo 'deb [arch=amd64] http://repo.radeon.com/rocm/apt/1.9.3/ xenial main'\
  | sudo tee /etc/apt/sources.list.d/rocm.list
Command-line permutations were generated with cmds.py and log output processed with parse.py. See here for more benchmark results.
imagenet dataset total images/sec:
python tf_cnn_benchmarks.py --device=GPU --num_gpus=1 --num_batches=40 \
--batch_size={16,32,64,128,256} --model={model} --data_name=imagenet

XR means XLA and ROCm Fusion were enabled
  export TF_XLA_FLAGS=--tf_xla_cpu_global_jit
  export TF_ROCM_FUSION_ENABLE=1
F means --use_fp16 option was used
na means the batch size was too large or benchmark would not run

model batchsize=16      32      032F    032XRF  64      064XR   128     256
trivial         3869    7012    1038    1038    11879   12030   18737   26770
alexnet         256     401     262     263     511     529     627     710
googlenet       209     247     136     142     261     261     271     248
inception3      47      48.9    23.8    24.2    51.6    53.3    na      na
inception4      21.1    23      11.2    11.4    11.4    na      na      na
lenet5          3670    6238    5354    5316    10041   10273   15455   20690
mobilenet       328     434     264     482     304     1263    485     513
nasnet          8       na      8.8     7.5     8.8     na      na      na
overfeat        92.7    145     75.1    75.7    201     201     229     275
resnet101       na      54.5    30.3    31.9    32      na      na      na
resnet101_v2    47.6    55.2    31.4    32.3    33      na      na      na
resnet152       33.5    38.2    21.2    21.7    22.3    na      na      na
resnet152_v2    33.8    38.5    21.3    21.9    22.4    na      na      na
resnet50        78.6    92.0    91.9    59.4    100     112     60.7    na
resnet50_v1.5   62.3    75.7    51.5    53.7    na      86.1    56.6    na
resnet50_v2     79.6    93.6    58.2    60.3    106     114     63.6    na
vgg11           64.7    82.7    39.3    39.2    92.9    94.5    95.5    41.7
vgg16           35.5    39.9    20.2    20.2    44.6    45.7    21      na
vgg19           31.2    35.6    16.1    16.1    37.8    37.7    16.7    na
Average Gain    0       0       -40.1%  -39.3%  0       +27.9%  0       0
Median Gain     0       0       -44.5%  -42.5%  0       +2.5%   0       0

* Average and Median gains use 0 as baselines; 32 is baseline for 32F, 32XRF
cifar10 dataset total images/sec:
python tf_cnn_benchmarks.py --device=GPU --num_gpus=1 --num_batches=40 \
--batch_size={16,32,64,128,256} --model={model} --data_name=cifar10
model batchsize=16 32 032F 032XRF 64 064XR 128 256
trivial 7965 15422 8041 8392 25992 22976 46789 71242
alexnet 3021 4782 248 250 6704 6707 8322 9838
nasnet na 47.9 49.8 19.7 53.7 na 55.3 na
resnet110 462 671 407 434 852 944 852 912
resnet110_v2 465 674 409 na 848 na 847 913
resnet20 2075 2988 1993 2093 3799 4073 3947 4313
resnet20_v2 2035 2902 1990 na 3674 na 3810 4197
resnet32 1437 2062 1320 1385 2616 2837 2664 2888
resnet32_v2 1442 2048 1310 na 2566 na 2615 2839
resnet44 1090 1571 979 1031 1988 2167 2005 2170
resnet44_v2 1094 1558 978 na 1960 na 1981 2141
resnet56 872 1272 785 826 1604 1745 1612 1739
resnet56_v2 881 1253 789 na 1585 na 1598 1719
Average Gain 0 0 -38.8 -45.8% 0 +4.7% 0 0
Median Gain 0 0 -37.2% -35.2% 0 +8.5% 0 0
* Average and Median gains use 0 as baselines; 32 is baseline for 32F, 32XRFNASNET-Large worked with a batch size of 8:
python tf_cnn_benchmarks.py --device=GPU --num_gpus=1 --compute_lr_on_cpu \
--batch_size=8  --num_batches=40 --model=nasnetlarge --data_name=imagenet
  [...]
  total images/sec: 0.70
DeepSpeech failed with Unable to find suitable algorithm for ... convolution
CPU (Ryzen 5 3600X) total images/sec:
python tf_cnn_benchmarks.py --device=CPU --batch_size={32,64,128}
--num_batches=40 --model={model} --data_name={dataset} {--use_fp16}

F means --use_fp16 option was used

model/dataset  batchsize= 32     32F    64     64F    128    128F
trivial/imagenet          1227   52.6   1387   52.6   1789   53.0
trivial/cifar10           22224  1050   22525  1914   37755  2504
mobilenet/imagenet        132    7.0    140    7.1    144    7.1
rocm_bandwidth_test
RocmBandwidthTest Version: 1.0.0
Device: 0, AMD Ryzen 5 3600X 6-Core Processor
Device: 1, Ellesmere [Radeon RX 470/480]
Unidirectional peak bandwidth GB/s
D/D 0 1
0 N/A 11.240193
1 7.645693 43.802111
Bdirectional peak bandwidth GB/s
D/D 0 1
0 N/A 14.460515
1 14.542496 N/Apython all_reduce_benchmark.py --variable_update=replicated
Average time per step: 0.000213811397552dkms status | grep amd
amdgpu, 1.9-320, 4.15.0-20-generic, x86_64: installeddmesg | grep kfd
[ 3.179217] kfd kfd: Allocated 3969056 bytes on gart
[ 3.179655] kfd kfd: added device 1002:67dfrocm-smi
==================== ROCm System Management Interface ================
============================================================================
GPU Temp AvgPwr SCLK MCLK Fan Perf SCLK OD MCLK OD
0 69c 135.227W 1366Mhz 2000Mhz 33.73% auto 0% 0%
============================================================================
==================== End of ROCm SMI Log ================Result for running benchmark in a GPU-passthrough QEMU/KVM virtual machine.
20191007 (kernel 5.0.21-1)rocm-dkms version 2.9.6 (installed via apt)tensorflow-rocm version 1.14.3 (installed via pip)Table 1: FP32 without TF_ROCM_FUSION_ENABLE
| batch_size | ResNet50 | Inception v3 | VGG16 | GoogLeNet | ResNet152 |
|---|---|---|---|---|---|
| 128 | x |
x |
x |
440.08 | x |
| 64 | 154.63 | 99.34 | 93.62 | 411.59 | x |
| 32 | 144.38 | 93.64 | 91.78 | 375.67 | 60.08 |
** x denotes failed benchmark due to out of memory.
Table 2: FP32 with TF_ROCM_FUSION_ENABLE
| batch_size | ResNet50 | Inception v3 | VGG16 | GoogLeNet | ResNet152 |
|---|---|---|---|---|---|
| 128 | x |
x |
x |
439.86 | x |
| 64 | 167.91 | 105.28 | 93.78 | 408.91 | x |
| 32 | 157.98 | 99.42 | 91.80 | 374.53 | 65.39 |
Table 3: FP16 without TF_ROCM_FUSION_ENABLE
| batch_size | ResNet50 | Inception v3 | VGG16 | GoogLeNet | ResNet152 |
|---|---|---|---|---|---|
| 128 | 159.80 | 60.10 | 55.03 | 372.76 | x |
| 64 | 153.81 | 58.61 | 54.53 | 342.67 | 58.91 |
| 32 | 139.40 | 56.85 | 51.68 | 297.95 | 53.42 |
Table 4: FP16 with TF_ROCM_FUSION_ENABLE
| batch_size | ResNet50 | Inception v3 | VGG16 | GoogLeNet | ResNet152 |
|---|---|---|---|---|---|
| 128 | 168.11 | 61.63 | 55.58 | 377.90 | x |
| 64 | 161.62 | 60.49 | 55.40 | 343.88 | 60.31 |
| 32 | 147.85 | 58.23 | 52.43 | 303.36 | 56.48 |
 extraymond
commented
4 years ago
extraymond
commented
4 years ago Results for running benchmark in lxc container, host ubuntu 18.04, guest 18.04
GPU: vega56 ROCM: 3.0 with rocm-dev(without dkms, kernel 5.3) tensorflow-rocm: 2.0.1
python3 tf_cnn_benchmarks.py --num_gpus=1 --batch_size=128 --model=resnet50

Done warm up
Step    Img/sec total_loss
1       images/sec: 130.3 +/- 0.0 (jitter = 0.0)        7.870
10      images/sec: 96.5 +/- 10.2 (jitter = 5.1)        7.957
20      images/sec: 103.9 +/- 6.3 (jitter = 10.1)       7.947
30      images/sec: 104.4 +/- 5.4 (jitter = 9.0)        7.934
40      images/sec: 108.8 +/- 4.2 (jitter = 9.0)        7.959
50      images/sec: 112.5 +/- 3.4 (jitter = 6.9)        7.703
60      images/sec: 115.3 +/- 2.9 (jitter = 5.4)        7.916
70      images/sec: 116.5 +/- 2.5 (jitter = 5.9)        7.836
80      images/sec: 117.3 +/- 2.3 (jitter = 7.4)        7.968
90      images/sec: 117.9 +/- 2.0 (jitter = 7.8)        7.789
100     images/sec: 117.6 +/- 1.9 (jitter = 11.0)       7.776
----------------------------------------------------------------
total images/sec: 117.61
----------------------------------------------------------------
 ant1s
commented
4 years ago
ant1s
commented
4 years ago GPU: radeon vii OS: ubuntu 18.04
ROCM: 3.0 tensorflow: 2.0
python tf_cnn_benchmarks.py --num_gpus=1 --batch_size=64 --model=resnet50
Done warm up
Step    Img/sec total_loss
1   images/sec: 222.7 +/- 0.0 (jitter = 0.0)    8.220
10  images/sec: 220.5 +/- 0.5 (jitter = 0.7)    7.880
20  images/sec: 220.0 +/- 0.4 (jitter = 1.3)    7.910
30  images/sec: 220.1 +/- 0.4 (jitter = 1.7)    7.821
40  images/sec: 219.9 +/- 0.3 (jitter = 2.0)    8.004
50  images/sec: 220.0 +/- 0.3 (jitter = 2.1)    7.769
60  images/sec: 219.8 +/- 0.2 (jitter = 2.2)    8.115
70  images/sec: 220.0 +/- 0.2 (jitter = 2.1)    7.816
80  images/sec: 220.0 +/- 0.2 (jitter = 2.1)    7.979
90  images/sec: 220.1 +/- 0.2 (jitter = 2.1)    8.098
100 images/sec: 220.1 +/- 0.2 (jitter = 2.2)    8.029
----------------------------------------------------------------
total images/sec: 219.98
python tf_cnn_benchmarks.py --num_gpus=1 --batch_size=64 --model=resnet50 --use_fp16
Done warm up
Step Img/sec total_loss
1 images/sec: 296.0 +/- 0.0 (jitter = 0.0) 8.105
10 images/sec: 299.9 +/- 1.2 (jitter = 2.2) 7.751
20 images/sec: 300.3 +/- 0.8 (jitter = 2.0) 7.913
30 images/sec: 299.8 +/- 0.6 (jitter = 3.1) 7.769
40 images/sec: 299.8 +/- 0.5 (jitter = 2.0) 7.918
50 images/sec: 299.6 +/- 0.5 (jitter = 2.4) 7.880
60 images/sec: 300.0 +/- 0.4 (jitter = 2.6) 7.718
70 images/sec: 300.2 +/- 0.4 (jitter = 2.5) 8.010
80 images/sec: 300.0 +/- 0.4 (jitter = 3.0) 7.772
90 images/sec: 299.9 +/- 0.4 (jitter = 3.2) 7.806
100 images/sec: 299.8 +/- 0.4 (jitter = 3.2) 8.043
----------------------------------------------------------------
total images/sec: 299.64ROCM: 3.1 tensorflow: 2.1
python tf_cnn_benchmarks.py --num_gpus=1 --batch_size=64 --model=resnet50
Done warm up
Step    Img/sec total_loss
1   images/sec: 288.1 +/- 0.0 (jitter = 0.0)    8.220
10  images/sec: 282.7 +/- 1.3 (jitter = 5.0)    7.880
20  images/sec: 281.3 +/- 2.1 (jitter = 3.0)    7.910
30  images/sec: 280.4 +/- 1.8 (jitter = 2.9)    7.820
40  images/sec: 281.7 +/- 1.4 (jitter = 2.4)    8.003
50  images/sec: 282.1 +/- 1.2 (jitter = 2.5)    7.768
60  images/sec: 282.4 +/- 1.0 (jitter = 2.0)    8.113
70  images/sec: 282.7 +/- 0.8 (jitter = 1.8)    7.818
80  images/sec: 283.1 +/- 0.7 (jitter = 1.7)    7.978
90  images/sec: 283.3 +/- 0.7 (jitter = 1.6)    8.100
100 images/sec: 283.6 +/- 0.6 (jitter = 1.6)    8.035
----------------------------------------------------------------
total images/sec: 283.44
----------------------------------------------------------------
python tf_cnn_benchmarks.py --num_gpus=1 --batch_size=64 --model=resnet50 --use_fp16
Done warm up
Step Img/sec total_loss
1 images/sec: 396.7 +/- 0.0 (jitter = 0.0) 8.107
10 images/sec: 397.1 +/- 0.8 (jitter = 2.5) 7.753
20 images/sec: 397.8 +/- 0.5 (jitter = 1.6) 7.907
30 images/sec: 398.0 +/- 0.4 (jitter = 2.0) 7.773
40 images/sec: 397.2 +/- 0.4 (jitter = 2.7) 7.926
50 images/sec: 397.7 +/- 0.4 (jitter = 2.9) 7.880
60 images/sec: 397.8 +/- 0.3 (jitter = 2.8) 7.704
70 images/sec: 397.1 +/- 0.4 (jitter = 3.0) 8.002
80 images/sec: 397.1 +/- 0.4 (jitter = 3.2) 7.783
90 images/sec: 397.4 +/- 0.3 (jitter = 3.0) 7.795
100 images/sec: 397.4 +/- 0.3 (jitter = 3.1) 8.041
----------------------------------------------------------------
total images/sec: 397.21
----------------------------------------------------------------a huge boost!!!
 qixiang109
commented
4 years ago
qixiang109
commented
4 years ago Radeon VII, with rocm 3.1 and tensorflow-rocm 1.15:
python tf_cnn_benchmarks.py --model=resnet50 --batch_size=128
Step    Img/sec total_loss
1   images/sec: 295.4 +/- 0.0 (jitter = 0.0)    8.326
10  images/sec: 299.1 +/- 1.7 (jitter = 7.6)    8.174
20  images/sec: 300.1 +/- 1.1 (jitter = 5.4)    8.261
30  images/sec: 301.2 +/- 0.9 (jitter = 4.8)    8.354
40  images/sec: 301.6 +/- 0.7 (jitter = 3.8)    8.399
50  images/sec: 301.4 +/- 0.7 (jitter = 4.0)    8.140
60  images/sec: 301.7 +/- 0.6 (jitter = 3.8)    8.363
70  images/sec: 301.6 +/- 0.5 (jitter = 3.6)    8.136
80  images/sec: 301.2 +/- 0.5 (jitter = 3.1)    8.418
90  images/sec: 301.4 +/- 0.4 (jitter = 2.5)    8.279
100 images/sec: 301.5 +/- 0.4 (jitter = 2.5)    8.344
----------------------------------------------------------------
total images/sec: 301.39
----------------------------------------------------------------
Happy with the performance, but I have another problem: each time I change the model (e.g., from resnet50 to vgg16) or even the batch size from 64 to 128, it turns to wait a long long time after libMIOpen.so loaded and before the 1st batch begins to run, with warnings keep printing like
2020-03-26 00:16:12.700464: I tensorflow/stream_executor/platform/default/dso_loader.cc:44]
Running warm up
Successfully opened dynamic library libMIOpen.so
warning: <unknown>:0:0: loop not unrolled: the optimizer was unable to perform the requested transformation; the transformation might be disabled or specified as part of an unsupported transformation ordering
warning: <unknown>:0:0: loop not unrolled: the optimizer was unable to perform the requested transformation; the transformation might be disabled or specified as part of an unsupported transformation ordering
warning: <unknown>:0:0: loop not unrolled: the optimizer was unable to perform the requested transformation; the transformation might be disabled or specified as part of an unsupported transformation ordering
usually, it takes 3~5 minutes for the warmup to be done and the 1st batch begins to run.
Done warm up
Step    Img/sec total_loss
1   images/sec: 249.9 +/- 0.0 (jitter = 0.0)    8.345
It seems MIOpen is searching for the best conv2d implementation during that time, and once found, stores it in ~/.cache/miopen for future using. However, the cache can only be reused when the model structure (even batch size) is absolutely the same, which makes itself rather useless.
My question is : since this searching step is way too much time wasting and useless , can I skip it ? Is that a must for miopen/rocm? If a must, it will be a huge disappointing to me...
 huanzhang12
commented
4 years ago
huanzhang12
commented
4 years ago It seems MIOpen is searching for the best conv2d implementation during that time, and once found, stores it in ~/.cache/miopen for future using. However, the cache can only be reused when the model structure (even batch size) is absolutely the same, which makes itself rather useless.
The majority of time seems to be spent on clang invocations. See https://github.com/ROCmSoftwarePlatform/MIOpen/issues/130
The optimal kernel depends on batch size, so when batch size is changed, different kernels need to be compiled.
qixiang109
commented
4 years ago It seems MIOpen is searching for the best conv2d implementation during that time, and once found, stores it in ~/.cache/miopen for future using. However, the cache can only be reused when the model structure (even batch size) is absolutely the same, which makes itself rather useless.
The majority of time seems to be spent on clang invocations. See ROCmSoftwarePlatform/MIOpen#130
The optimal kernel depends on batch size, so when batch size is changed, different kernels need to be compiled.
Thanks for the reply and link. I am not familiar with the "optimal kernel compiling" step before any training, seems tensorflow compiled against cuda/cudnn does not have such a step, it just start running immediately; why tensorflow on rocm/miopen does? The "optimal kernel compiling" time is really too long too frequent to use tf-rocm in any daily ML working... Can you provide a solution to that?
sunway513
commented
4 years ago Hi @qixiang109 , the behavior is well studied, and we're working on improving the user experiences with MIOpen and the compilation toolchains. We'll keep you posted when there are improvements available in the future ROCm releases.
huanzhang12
commented
4 years ago Benchmark dump and recreation of @kazulittlefox's results. My ROCm 2.8.13 results were significantly lower (~65%) than kazulittlefox's 1.9.2 results so I was concerned I may have a hardware issue. Always compare apples to apples. My 1.9.3 results are consistent with kazulittlefox's.
@mwrnd The performance regression on gfx803 has been fixed in ROCm v3.3. The issue was that assembly kernels were all disabled on gfx803 (see https://github.com/ROCmSoftwarePlatform/MIOpen/issues/134). On my RX570, resnet fp32 performance restored from 50 images/sec (ROCm v3.1) to 95 images/sec (ROCm v3.3). I have a script for patching miopen.db for gfx803 targets with 32 CUs (duplicating performance db from 36 CU devices). This improves performance by about 20 images/sec.
mwrnd
commented
4 years ago GPU: MSI Radeon RX 580 Armor 8GB OC
GPU BIOS: 015.050.002001 2017/11/13 21:41 according to Win10 Adrenalin 20.2.2
OS: Ubuntu 18.04.4
Kernel: 5.3.0-45-generic
rocm-dkms: 3.3.19 installed through apt
Python: 3.6.9
tensorflow-rocm: 2.1.1 installed through pip
tensorflow benchmarks: cnn_tf_v2.1_compatible
tensorflow_models: 2.1.0
Benchmark dump. Command-line permutations were generated with cmds.py and log output processed with parse.py.
Comparing ROCm 3.3.19 resnet50 performance to previous versions, 3.3.19 has improved throughput and stability. It did not crash even once for me. However, I ran into the ROCmSoftwarePlatform/MIOpen#130 issue. MIOpen pre-computations take longer than most of these benchmarks. I would not mind giving up drive space for a MIOpen database/cache but prefer the raw throughput for faster training runs on large models/datasets.
             batchsize=16     32     032F   032XRF   64     064XR   128
ROCm1.9.3/TF1.12.0     78.6   92.0   91.9   59.4     100    112     60.7
ROCm2.8.13/TF1.14.2    51.4   57.9   65.8   67.7     61.0   70.0    64.1
ROCm3.3.19/TF2.1.1     77.6   92.6   65.3   65.7     106    105     71.9
imagenet dataset total images/sec:
python tf_cnn_benchmarks.py --device=GPU --num_gpus=1 --num_batches=40 \
--batch_size={16,32,64,128,256} --model={model} --data_name=imagenet

XR means XLA and ROCm Fusion were enabled
  export TF_XLA_FLAGS=--tf_xla_cpu_global_jit
  export TF_ROCM_FUSION_ENABLE=1
F means --use_fp16 option was used
na means the batch size was too large or benchmark would not run

model/batchsize=16      32      032F    032XRF  64      064XR   128     256
trivial         4016    7942    1129    1126    13648   13895   21851   30133
alexnet         317     491     318     319     669     672     764     861
googlenet       207     241     155     162     277     279     288     290
inception3      49.8    56.7    37.4    37.5    58.4    58.6    34.7    na
inception4      22.6    25.4    17.6    18.2    17.6    na      na      na
lenet5          4541    7625    7536    7617    12178   12106   17257   22254
official_ncf    1373    2694    2767    2848    5440    5490    10812   21140
overfeat        95.7    145     81.6    82.1    198     na      233     250
resnet101       44.7    55.5    35.8    36.1    37.1    na      na      na
resnet101_v2    47.8    56.2    35.9    36.2    63.3    63.3    na      na
resnet152       33.5    38.9    24.2    24.5    25.2    na      na      na
resnet152_v2    33.9    39.4    24.5    24.7    25.4    na      na      na
resnet50        77.6    92.6    65.3    65.7    106     105     71.9    na
resnet50_v1.5   70.0    83.8    61.0    61.4    94.9    94.7    66.6    na
resnet50_v2     78.9    94.2    65.7    66.5    108     108     72.5    na
vgg11           70.4    87.7    44.4    44.6    100     100     103     47.2
vgg16           38.9    48.4    21.8    22.0    50.1    50.6    22.6    na
vgg19           33.3    39.4    17.5    17.6    41.4    41.4    18.1    na
cifar10 dataset total images/sec:
python tf_cnn_benchmarks.py --device=GPU --num_gpus=1 --num_batches=40 \
--batch_size={16,32,64,128,256} --model={model} --data_name=cifar10

model/batchsize=16      32      032F    032XRF  64      064XR   128     256
trivial         8651    15968   11978   11708   27686   29923   44124   89755
alexnet         3485    5403    472     480     7210    7159    513     10455
resnet110       na      na      725     727     na      na      1023    na
resnet110_v2    503     729     495     495     902     902     840     1032
resnet20        2372    3421    2483    2490    4364    4353    4246    5217
resnet20_v2     2330    3386    2483    2448    4242    4242    4178    5068
resnet32        1584    2301    1613    1618    2891    2876    2751    3399
resnet32_v2     1579    2268    1609    1614    2841    2836    2732    3335
resnet44        1180    1723    1197    1193    2153    2154    2033    2517
resnet44_v2     1172    1717    1195    1195    2134    2134    2028    2480
resnet56        944     1379    946     945     1720    1723    1616    2004
resnet56_v2     944     1375    952     952     1715    1711    1614    1981
DeepSpeech worked with a batch size of 16:
python3 tf_cnn_benchmarks.py --num_gpus=1 --batch_size=16 --num_batches=40 \
--model=deepspeech2 --data_name=librispeech
  [...]
  total images/sec: 0.56
CPU (Ryzen 5 3600X) total images/sec:
python3 tf_cnn_benchmarks.py --device=CPU  {--use_fp16} --num_batches=40 \
--batch_size={32,64,128} --model={model} --data_name=imagenet

F means --use_fp16 option was used

model/dataset batchsize=32      32F     64      64F     128     128F
trivial/cifar10         35401   2701    51733   2942    64842   3134
trivial/imagenet        2249    65.9    2821    66.4    4489    67.0
ncf/imagenet            347     326     701     558     1407    863
rocm-bandwidth-test
RocmBandwidthTest Version: 2.3.11
Device: 0, AMD Ryzen 5 3600X 6-Core Processor
Device: 1, Ellesmere [Radeon RX 470/480/570/570X/580/580X], 2d:0.0
Unidirectional copy peak bandwidth GB/s
D/D 0 1
0 N/A 11.325769
1 11.244692 24.659122
Bdirectional copy peak bandwidth GB/s
D/D 0 1
0 N/A 14.674771
1 14.674771 N/Apython3 all_reduce_benchmark.py --variable_update=replicated
Average time per step: 0.00011957406997680663dkms status | grep amd
amdgpu, 3.3-19, 5.3.0-45-generic, x86_64: installedrocm-smi
========================ROCm System Management Interface==================
==========================================================================
GPU Temp AvgPwr SCLK MCLK Fan Perf PwrCap VRAM% GPU%
0 31.0c 43.124W 1366Mhz 2000Mhz 26.67% high 135.0W 98% 100%
==========================================================================
==============================End of ROCm SMI Log ======================== ashaver
commented
4 years ago
ashaver
commented
4 years ago Anyone else still fighting the AMD/ROCM drivers on a laptop. Even with the latest (Rev 20.10) and/or the latest ROCm I have the following peristent bugs related to (https://bugzilla.kernel.org/show_bug.cgi?id=203035):
Specs and results:
TF_ROCM_FUSION_ENABLE=1 python3 tf_cnn_benchmarks.py --num_gpus=1 --batch_size=32 --model=resnet50Step Img/sec total_loss
1 images/sec: 131.4 +/- 0.0 (jitter = 0.0) 8.458
10 images/sec: 130.0 +/- 0.9 (jitter = 2.9) 7.997
20 images/sec: 129.1 +/- 0.6 (jitter = 2.2) 8.260
30 images/sec: 128.6 +/- 0.5 (jitter = 2.0) 8.338
40 images/sec: 128.4 +/- 0.4 (jitter = 2.3) 8.190
50 images/sec: 128.0 +/- 0.4 (jitter = 2.7) 7.742
60 images/sec: 128.2 +/- 0.4 (jitter = 2.4) 8.061
70 images/sec: 128.3 +/- 0.3 (jitter = 2.4) inf
80 images/sec: 128.3 +/- 0.3 (jitter = 2.5) inf
90 images/sec: 128.2 +/- 0.3 (jitter = 2.5) inf
100 images/sec: 128.2 +/- 0.3 (jitter = 2.5) inf
----------------------------------------------------------------
total images/sec: 128.13
----------------------------------------------------------------@qixiang109 , MIOpen released pre-compiled kernels in ROCm3.5 release, aiming to reduce the overheads on startup. For more details, you can refer to the following document: https://github.com/ROCmSoftwarePlatform/MIOpen#installing-miopen-kernels-package
 papadako
commented
4 years ago
papadako
commented
4 years ago I guess the following numbers are a bit problematic. Any ideas? Could it be the kernel?
GPU: Radeon VII Kernel: 5.7.0 rocm-dkms: from kernel Python: 3.8.2 rocm: 3.5 tensorflow-rocm: 2.2 compiled from source tensorflow benchmarks: master
python tf_cnn_benchmarks.py --model=resnet50 --batch_size=128

Step    Img/sec total_loss
1       images/sec: 95.9 +/- 0.0 (jitter = 0.0) 7.781
10      images/sec: 95.9 +/- 0.0 (jitter = 0.1) 7.740
20      images/sec: 95.9 +/- 0.0 (jitter = 0.1) 7.827
30      images/sec: 95.8 +/- 0.0 (jitter = 0.1) 7.965
40      images/sec: 95.8 +/- 0.0 (jitter = 0.1) 7.881
50      images/sec: 95.7 +/- 0.0 (jitter = 0.2) 7.795
60      images/sec: 95.7 +/- 0.0 (jitter = 0.1) 8.005
70      images/sec: 95.7 +/- 0.0 (jitter = 0.2) 7.863
80      images/sec: 95.7 +/- 0.0 (jitter = 0.2) 7.922
90      images/sec: 95.7 +/- 0.0 (jitter = 0.1) 7.740
100     images/sec: 95.7 +/- 0.0 (jitter = 0.1) 7.998
----------------------------------------------------------------
total images/sec: 95.66
----------------------------------------------------------------@papadako Can you try to set MIOPEN_DEBUG_CONV_IMPLICIT_GEMM=0 and/or MIOPEN_DEBUG_CONV_GEMM=0 and see if it can improve performance?
MIOPEN_DEBUG_CONV_IMPLICIT_GEMM=0 MIOPEN_DEBUG_CONV_GEMM=0 python tf_cnn_benchmarks.py --model=resnet50 --batch_size=128@papadako Can you try to set
MIOPEN_DEBUG_CONV_IMPLICIT_GEMM=0and/orMIOPEN_DEBUG_CONV_GEMM=0and see if it can improve performance?MIOPEN_DEBUG_CONV_IMPLICIT_GEMM=0 MIOPEN_DEBUG_CONV_GEMM=0 python tf_cnn_benchmarks.py --model=resnet50 --batch_size=128
I get even worse results with the above settings
Step    Img/sec total_loss
1       images/sec: 75.8 +/- 0.0 (jitter = 0.0) 7.781
10      images/sec: 75.6 +/- 0.0 (jitter = 0.1) 7.740
20      images/sec: 75.6 +/- 0.0 (jitter = 0.1) 7.826
30      images/sec: 75.5 +/- 0.0 (jitter = 0.1) 7.964
40      images/sec: 75.5 +/- 0.0 (jitter = 0.1) 7.880
50      images/sec: 75.5 +/- 0.0 (jitter = 0.1) 7.793
60      images/sec: 75.4 +/- 0.0 (jitter = 0.1) 8.007
70      images/sec: 75.4 +/- 0.0 (jitter = 0.1) 7.865
80      images/sec: 75.3 +/- 0.0 (jitter = 0.1) 7.928
90      images/sec: 75.2 +/- 0.0 (jitter = 0.2) 7.741
100     images/sec: 75.1 +/- 0.1 (jitter = 0.2) 7.998
I will try try to use a rocm-dkms supported kernel (i.e., 5.4.0) and report back
 witeko
commented
4 years ago
witeko
commented
4 years ago @papadako , @huanzhang12 , i have the same performance (or similar) issue. I use vega 7nm, rhel 8.2, dkms drivers, rocm 3.5, tensorflow 2.2.0 (on 2.1.0 works fine).
 logan-dunbar
commented
4 years ago
logan-dunbar
commented
4 years ago Running inside a Singularity container (v3.5.2) on host Ubuntu 18.04.
GPU: Asus Radeon RX Vega 56 ROG Strix OC 8GB Kernel: 5.4.0-37 Driver: amdgpu-pro 20.20 (Ubuntu would freeze sporadically with rock-dkms) Python: 3.7.7 (deadsnakes) rocm: 3.5.1 (apt) tensorflow-rocm: 2.2 (PyPI) tensorflow benchmarks: master (449e900)
python3.7 tf_cnn_benchmarks.py --model=resnet50 --batch_size=64

Step    Img/sec total_loss
1   images/sec: 132.0 +/- 0.0 (jitter = 0.0)    7.608
10  images/sec: 131.7 +/- 0.4 (jitter = 0.7)    7.849
20  images/sec: 131.4 +/- 0.3 (jitter = 0.8)    8.013
30  images/sec: 131.5 +/- 0.2 (jitter = 0.8)    7.940
40  images/sec: 131.4 +/- 0.2 (jitter = 0.8)    8.136
50  images/sec: 131.2 +/- 0.2 (jitter = 1.1)    8.052
60  images/sec: 131.2 +/- 0.1 (jitter = 1.0)    7.782
70  images/sec: 131.1 +/- 0.1 (jitter = 1.1)    7.853
80  images/sec: 131.2 +/- 0.1 (jitter = 1.1)    8.012
90  images/sec: 131.1 +/- 0.1 (jitter = 1.1)    7.843
100 images/sec: 131.0 +/- 0.1 (jitter = 1.3)    8.088
----------------------------------------------------------------
total images/sec: 130.97
----------------------------------------------------------------
 webber26232
commented
4 years ago
webber26232
commented
4 years ago Radeon VII
rocm==3.5 installed through apt
tensorflow==2.2 installed through pip
python3.7 tf_cnn_benchmarks.py --model=resnet50 --batch_size=128

Step    Img/sec total_loss
1   images/sec: 183.8 +/- 0.0 (jitter = 0.0)    7.781
10  images/sec: 183.7 +/- 0.1 (jitter = 0.3)    7.740
20  images/sec: 183.5 +/- 0.1 (jitter = 0.3)    7.827
30  images/sec: 183.4 +/- 0.1 (jitter = 0.2)    7.964
40  images/sec: 183.3 +/- 0.1 (jitter = 0.4)    7.882
50  images/sec: 183.3 +/- 0.1 (jitter = 0.3)    7.791
60  images/sec: 183.2 +/- 0.1 (jitter = 0.4)    8.016
70  images/sec: 183.2 +/- 0.1 (jitter = 0.4)    7.870
80  images/sec: 183.1 +/- 0.1 (jitter = 0.4)    7.933
90  images/sec: 183.1 +/- 0.1 (jitter = 0.4)    7.739
100 images/sec: 183.1 +/- 0.0 (jitter = 0.4)    8.008
----------------------------------------------------------------
total images/sec: 183.10
Seems not as good as other Radeon VII posts. Got similar overhead mentioned in qixiang109's post
 nickdon2007
commented
4 years ago
nickdon2007
commented
4 years ago I have similar issue, with lower than expected performance. The memory bandwidth is slow, which I don't know why.
CPU: AMD Ryzen 7 3700X GPU: AMD Radeon RX Vega 56 OS: Ubuntu 18.04 Python: 3.6 rocm: 3 (apt) tensorflow-rocm: 2.2 (PyPI)
python tf_cnn_benchmarks.py --num_gpus=1 --batch_size=32 --model=resnet50
Done warm up
Step    Img/sec total_loss
1   images/sec: 81.0 +/- 0.0 (jitter = 0.0) 7.765
10  images/sec: 80.7 +/- 0.1 (jitter = 0.2) 8.049
20  images/sec: 80.7 +/- 0.0 (jitter = 0.1) 7.808
30  images/sec: 80.7 +/- 0.0 (jitter = 0.1) 7.976
40  images/sec: 80.9 +/- 0.1 (jitter = 0.2) 7.591
50  images/sec: 81.2 +/- 0.1 (jitter = 0.3) 7.549
60  images/sec: 81.5 +/- 0.1 (jitter = 0.6) 7.819
70  images/sec: 81.7 +/- 0.1 (jitter = 1.1) 7.820
80  images/sec: 81.8 +/- 0.1 (jitter = 1.5) 7.847
90  images/sec: 82.0 +/- 0.1 (jitter = 0.8) 8.025
100 images/sec: 82.1 +/- 0.1 (jitter = 0.6) 8.029
----------------------------------------------------------------
total images/sec: 82.07
----------------------------------------------------------------
clinfo
Number of platforms:                 1
  Platform Profile:              FULL_PROFILE
  Platform Version:              OpenCL 2.0 AMD-APP (3137.0)
  Platform Name:                 AMD Accelerated Parallel Processing
  Platform Vendor:               Advanced Micro Devices, Inc.
  Platform Extensions:               cl_khr_icd cl_amd_event_callback

  Platform Name:                 AMD Accelerated Parallel Processing
Number of devices:               1
  Device Type:                   CL_DEVICE_TYPE_GPU
  Vendor ID:                     1002h
  Board name:                    Vega 10 XT [Radeon RX Vega 64]
  Device Topology:               PCI[ B#47, D#0, F#0 ]
  Max compute units:                 56
  Max work items dimensions:             3
    Max work items[0]:               1024
    Max work items[1]:               1024
    Max work items[2]:               1024
  Max work group size:               256
  Preferred vector width char:           4
  Preferred vector width short:          2
  Preferred vector width int:            1
  Preferred vector width long:           1
  Preferred vector width float:          1
  Preferred vector width double:         1
  Native vector width char:          4
  Native vector width short:             2
  Native vector width int:           1
  Native vector width long:          1
  Native vector width float:             1
  Native vector width double:            1
  Max clock frequency:               1590Mhz
  Address bits:                  64
  Max memory allocation:             7287183769
  Image support:                 Yes
  Max number of images read arguments:       128
  Max number of images write arguments:      8
  Max image 2D width:                16384
  Max image 2D height:               16384
  Max image 3D width:                2048
  Max image 3D height:               2048
  Max image 3D depth:                2048
  Max samplers within kernel:            26751
  Max size of kernel argument:           1024
  Alignment (bits) of base address:      1024
  Minimum alignment (bytes) for any datatype:    128
  Single precision floating point capability
    Denorms:                     Yes
    Quiet NaNs:                  Yes
    Round to nearest even:           Yes
    Round to zero:               Yes
    Round to +ve and infinity:           Yes
    IEEE754-2008 fused multiply-add:         Yes
  Cache type:                    Read/Write
  Cache line size:               64
  Cache size:                    16384
  Global memory size:                8573157376
  Constant buffer size:              7287183769
  Max number of constant args:           8
  Local memory type:                 Scratchpad
  Local memory size:                 65536
  Max pipe arguments:                16
  Max pipe active reservations:          16
  Max pipe packet size:              2992216473
  Max global variable size:          7287183769
  Max global variable preferred total size:  8573157376
  Max read/write image args:             64
  Max on device events:              1024
  Queue on device max size:          8388608
  Max on device queues:              1
  Queue on device preferred size:        262144
  SVM capabilities:
    Coarse grain buffer:             Yes
    Fine grain buffer:               Yes
    Fine grain system:               No
    Atomics:                     No
  Preferred platform atomic alignment:       0
  Preferred global atomic alignment:         0
  Preferred local atomic alignment:      0
  Kernel Preferred work group size multiple:     64
  Error correction support:          0
  Unified memory for Host and Device:        0
  Profiling timer resolution:            1
  Device endianess:              Little
  Available:                     Yes
  Compiler available:                Yes
  Execution capabilities:
    Execute OpenCL kernels:          Yes
    Execute native function:             No
  Queue on Host properties:
    Out-of-Order:                No
    Profiling :                  Yes
  Queue on Device properties:
    Out-of-Order:                Yes
    Profiling :                  Yes
  Platform ID:                   0x7fe56aa5fcf0
  Name:                      gfx900
  Vendor:                    Advanced Micro Devices, Inc.
  Device OpenCL C version:           OpenCL C 2.0
  Driver version:                3137.0 (HSA1.1,LC)
  Profile:                   FULL_PROFILE
  Version:                   OpenCL 2.0
  Extensions:                    cl_khr_fp64 cl_khr_global_int32_base_atomics cl_khr_global_int32_extended_atomics cl_khr_local_int32_base_atomics cl_khr_local_int32_extended_atomics cl_khr_int64_base_atomics cl_khr_int64_extended_atomics cl_khr_3d_image_writes cl_khr_byte_addressable_store cl_khr_fp16 cl_khr_gl_sharing cl_amd_device_attribute_query cl_amd_media_ops cl_amd_media_ops2 cl_khr_image2d_from_buffer cl_khr_subgroups cl_khr_depth_images cl_amd_copy_buffer_p2p cl_amd_assembly_program
rocminfo
ROCk module is loaded
Able to open /dev/kfd read-write
=====================
HSA System Attributes
=====================
Runtime Version:         1.1
System Timestamp Freq.:  1000.000000MHz
Sig. Max Wait Duration:  18446744073709551615 (0xFFFFFFFFFFFFFFFF) (timestamp count)
Machine Model:           LARGE
System Endianness:       LITTLE

==========
HSA Agents
==========
*******
Agent 1
*******
  Name:                    AMD Ryzen 7 3700X 8-Core Processor
  Uuid:                    CPU-XX
  Marketing Name:          AMD Ryzen 7 3700X 8-Core Processor
  Vendor Name:             CPU
  Feature:                 None specified
  Profile:                 FULL_PROFILE
  Float Round Mode:        NEAR
  Max Queue Number:        0(0x0)
  Queue Min Size:          0(0x0)
  Queue Max Size:          0(0x0)
  Queue Type:              MULTI
  Node:                    0
  Device Type:             CPU
  Cache Info:
    L1:                      32768(0x8000) KB
  Chip ID:                 0(0x0)
  Cacheline Size:          64(0x40)
  Max Clock Freq. (MHz):   0
  BDFID:                   0
  Internal Node ID:        0
  Compute Unit:            16
  SIMDs per CU:            0
  Shader Engines:          0
  Shader Arrs. per Eng.:   0
  WatchPts on Addr. Ranges:1
  Features:                None
  Pool Info:
    Pool 1
      Segment:                 GLOBAL; FLAGS: KERNARG, FINE GRAINED
      Size:                    16436616(0xfacd88) KB
      Allocatable:             TRUE
      Alloc Granule:           4KB
      Alloc Alignment:         4KB
      Accessible by all:       TRUE
    Pool 2
      Segment:                 GLOBAL; FLAGS: COARSE GRAINED
      Size:                    16436616(0xfacd88) KB
      Allocatable:             TRUE
      Alloc Granule:           4KB
      Alloc Alignment:         4KB
      Accessible by all:       TRUE
  ISA Info:
    N/A
*******
Agent 2
*******
  Name:                    gfx900
  Uuid:                    GPU-02151e1bb9ee2144
  Marketing Name:          Vega 10 XT [Radeon RX Vega 64]
  Vendor Name:             AMD
  Feature:                 KERNEL_DISPATCH
  Profile:                 BASE_PROFILE
  Float Round Mode:        NEAR
  Max Queue Number:        128(0x80)
  Queue Min Size:          4096(0x1000)
  Queue Max Size:          131072(0x20000)
  Queue Type:              MULTI
  Node:                    1
  Device Type:             GPU
  Cache Info:
    L1:                      16(0x10) KB
  Chip ID:                 26751(0x687f)
  Cacheline Size:          64(0x40)
  Max Clock Freq. (MHz):   1590
  BDFID:                   12032
  Internal Node ID:        1
  Compute Unit:            56
  SIMDs per CU:            4
  Shader Engines:          4
  Shader Arrs. per Eng.:   1
  WatchPts on Addr. Ranges:4
  Features:                KERNEL_DISPATCH
  Fast F16 Operation:      FALSE
  Wavefront Size:          64(0x40)
  Workgroup Max Size:      1024(0x400)
  Workgroup Max Size per Dimension:
    x                        1024(0x400)
    y                        1024(0x400)
    z                        1024(0x400)
  Max Waves Per CU:        40(0x28)
  Max Work-item Per CU:    2560(0xa00)
  Grid Max Size:           4294967295(0xffffffff)
  Grid Max Size per Dimension:
    x                        4294967295(0xffffffff)
    y                        4294967295(0xffffffff)
    z                        4294967295(0xffffffff)
  Max fbarriers/Workgrp:   32
  Pool Info:
    Pool 1
      Segment:                 GLOBAL; FLAGS: COARSE GRAINED
      Size:                    8372224(0x7fc000) KB
      Allocatable:             TRUE
      Alloc Granule:           4KB
      Alloc Alignment:         4KB
      Accessible by all:       FALSE
    Pool 2
      Segment:                 GROUP
      Size:                    64(0x40) KB
      Allocatable:             FALSE
      Alloc Granule:           0KB
      Alloc Alignment:         0KB
      Accessible by all:       FALSE
  ISA Info:
    ISA 1
      Name:                    amdgcn-amd-amdhsa--gfx900
      Machine Models:          HSA_MACHINE_MODEL_LARGE
      Profiles:                HSA_PROFILE_BASE
      Default Rounding Mode:   NEAR
      Default Rounding Mode:   NEAR
      Fast f16:                TRUE
      Workgroup Max Size:      1024(0x400)
      Workgroup Max Size per Dimension:
        x                        1024(0x400)
        y                        1024(0x400)
        z                        1024(0x400)
      Grid Max Size:           4294967295(0xffffffff)
      Grid Max Size per Dimension:
        x                        4294967295(0xffffffff)
        y                        4294967295(0xffffffff)
        z                        4294967295(0xffffffff)
      FBarrier Max Size:       32
*** Done ***
rocm-bandwidth-test
          RocmBandwidthTest Version: 2.3.11

          Launch Command is: rocm-bandwidth-test (rocm_bandwidth -a + rocm_bandwidth -A)

          Device: 0,  AMD Ryzen 7 3700X 8-Core Processor
          Device: 1,  Vega 10 XT [Radeon RX Vega 64],  2f:0.0

          Inter-Device Access

          D/D       0         1

          0         1         0

          1         1         1

          Inter-Device Numa Distance

          D/D       0         1

          0         0         N/A

          1         20        0

          Unidirectional copy peak bandwidth GB/s

          D/D       0           1

          0         N/A         9.295924

          1         8.892247    72.654038

          Bdirectional copy peak bandwidth GB/s

          D/D       0           1

          0         N/A         17.103560

1 17.103560 N/A Hi @nickdon2007 @webber26232 , thanks for reporting your observations. We've been looking into the performance drop reported for the TF2.2 release branch. The issue has been identified and we'll try to provide the fixes in the next a few weeks with the next ROCm release. cc @ekuznetsov139 @deven-amd
 joket1999
commented
4 years ago
joket1999
commented
4 years ago Ubuntu 20.04
Radeon VII VBIOS version: 113-D3600200-106
rocm==3.7 tensorflow==2.3 benchmarks==cnn_tf_v2.1_compatible
python3 ./tf_cnn_benchmarks.py --num_gpus=1 --batch_size=64 --model=resnet50

Step    Img/sec total_loss
1   images/sec: 284.8 +/- 0.0 (jitter = 0.0)    7.608
10  images/sec: 284.0 +/- 0.3 (jitter = 0.7)    7.849
20  images/sec: 284.0 +/- 0.2 (jitter = 0.6)    8.013
30  images/sec: 284.0 +/- 0.1 (jitter = 0.7)    7.939
40  images/sec: 283.9 +/- 0.1 (jitter = 0.8)    8.137
50  images/sec: 283.8 +/- 0.2 (jitter = 0.8)    8.051
60  images/sec: 283.7 +/- 0.1 (jitter = 0.8)    7.781
70  images/sec: 283.7 +/- 0.1 (jitter = 0.8)    7.856
80  images/sec: 283.7 +/- 0.1 (jitter = 0.9)    8.012
90  images/sec: 283.7 +/- 0.1 (jitter = 0.8)    7.842
100 images/sec: 283.7 +/- 0.1 (jitter = 0.7)    8.090
----------------------------------------------------------------
total images/sec: 283.60
----------------------------------------------------------------
python3 ./tf_cnn_benchmarks.py --num_gpus=1 --batch_size=64 --model=resnet50 --use_fp16
Done warm up
Step Img/sec total_loss
1 images/sec: 391.8 +/- 0.0 (jitter = 0.0) 7.573
10 images/sec: 394.2 +/- 0.5 (jitter = 1.9) 7.848
20 images/sec: 394.6 +/- 0.3 (jitter = 1.4) 7.966
30 images/sec: 394.7 +/- 0.3 (jitter = 1.1) 7.907
40 images/sec: 394.1 +/- 0.3 (jitter = 1.7) 8.070
50 images/sec: 394.2 +/- 0.2 (jitter = 1.6) 8.047
60 images/sec: 394.3 +/- 0.2 (jitter = 1.6) 7.769
70 images/sec: 394.4 +/- 0.2 (jitter = 1.5) 7.859
80 images/sec: 394.2 +/- 0.2 (jitter = 1.6) 7.965
90 images/sec: 394.1 +/- 0.2 (jitter = 1.7) 7.822
100 images/sec: 394.1 +/- 0.2 (jitter = 1.7) 8.058
----------------------------------------------------------------
total images/sec: 393.89
----------------------------------------------------------------
python3 ./tf_cnn_benchmarks.py --num_gpus=1 --batch_size=128 --model=resnet50

Done warm up
Step    Img/sec total_loss
1   images/sec: 292.8 +/- 0.0 (jitter = 0.0)    7.781
10  images/sec: 292.6 +/- 0.2 (jitter = 0.7)    7.740
20  images/sec: 292.3 +/- 0.1 (jitter = 0.6)    7.827
30  images/sec: 292.2 +/- 0.1 (jitter = 0.3)    7.963
40  images/sec: 292.0 +/- 0.1 (jitter = 0.4)    7.884
50  images/sec: 291.9 +/- 0.1 (jitter = 0.5)    7.792
60  images/sec: 291.8 +/- 0.1 (jitter = 0.5)    8.015
70  images/sec: 291.7 +/- 0.1 (jitter = 0.6)    7.868
80  images/sec: 291.6 +/- 0.1 (jitter = 0.6)    7.933
90  images/sec: 291.5 +/- 0.1 (jitter = 0.6)    7.746
100 images/sec: 291.4 +/- 0.1 (jitter = 0.7)    7.997
----------------------------------------------------------------
total images/sec: 291.38
----------------------------------------------------------------
python3 ./tf_cnn_benchmarks.py --num_gpus=1 --batch_size=128 --model=resnet50 --use_fp16

Done warm up
Step    Img/sec total_loss
1   images/sec: 426.1 +/- 0.0 (jitter = 0.0)    7.794
10  images/sec: 428.1 +/- 0.3 (jitter = 0.9)    7.737
20  images/sec: 427.7 +/- 0.3 (jitter = 0.9)    7.828
30  images/sec: 427.5 +/- 0.2 (jitter = 1.0)    7.960
40  images/sec: 427.2 +/- 0.2 (jitter = 1.3)    7.889
50  images/sec: 427.0 +/- 0.2 (jitter = 1.3)    7.788
60  images/sec: 427.0 +/- 0.1 (jitter = 1.2)    8.019
70  images/sec: 426.8 +/- 0.1 (jitter = 1.2)    7.869
80  images/sec: 426.7 +/- 0.1 (jitter = 1.1)    7.931
90  images/sec: 426.6 +/- 0.1 (jitter = 1.2)    7.731
100 images/sec: 426.4 +/- 0.1 (jitter = 1.2)    7.992
----------------------------------------------------------------
total images/sec: 426.36
----------------------------------------------------------------
 dcominottim
commented
3 years ago
dcominottim
commented
3 years ago Here are some RTX 3080 10GB results.
(Obs.: When you see some low scores at higher batch sizes with (UM), it's because CUDA Unified Memory and shared memory was used due to lack of VRAM.)
Ryzen 9 5950X 32GB 3200MHz RAM Pop_OS! 20.04.1 NVIDIA 460 driver tensorflow-gpu 2.4.0 NVIDIA 20.12-tf2-py3 Docker image
sudo docker run --gpus all --name tf-20.12 --shm-size=10g --ulimit memlock=-1 --ulimit stack=67108864 -it --rm -v $HOME/Projects/nvidia/tensorflow-gpu/benchmarks-master/scripts/tf_cnn_benchmarks:/projects nvcr.io/nvidia/tensorflow:20.12-tf2-py3
| FP32 | ResNet50 | AlexNet | Inception v3 | VGG16 | GoogLeNet | ResNet152 |
|---|---|---|---|---|---|---|
| batch_size=512 | / | 4715.95 | / | / | / | / |
| batch_size=256 | 54.2 (UM) | 4578.22 | / | / | / | / |
| batch_size=128 | 62.8 (UM) | 4237.48 | 52.8 (UM) | / | 1016.12 | / |
| batch_size=64 | 396.26 | 3373.96 | 278.23 | 245.71 | 906.01 | / |
| batch_size=32 | 362.88 | 2467.48 | 260.47 | 238.11 | 802.6 | 150.18 |
| FP16 | ResNet50 | AlexNet | Inception v3 | VGG16 | GoogLeNet | ResNet152 |
|---|---|---|---|---|---|---|
| batch_size=512 | / | 6504.74 | / | / | / | / |
| batch_size=256 | / | 5819.6 | / | / | 1790.52 | / |
| batch_size=128 | 947.3 | 4919.44 | 635.26 | 355.78 | 1645.71 | / |
| batch_size=64 | 900.25 | 3797.61 | 578.34 | 326.88 | 1498.69 | 384.89 |
| batch_size=32 | 736.35 | 2512.88 | 517.68 | 295.81 | 1307.13 | 321.85 |
 EmilPi
commented
3 years ago
EmilPi
commented
3 years ago Any 6900 XT benchmarks?
 Daniel451
commented
3 years ago
Daniel451
commented
3 years ago @EmilPi 6900 XT would be very interesting indeed
qixiang109
commented
3 years ago @dcominottim my GTX1080 and Radeon vii, training examples / second
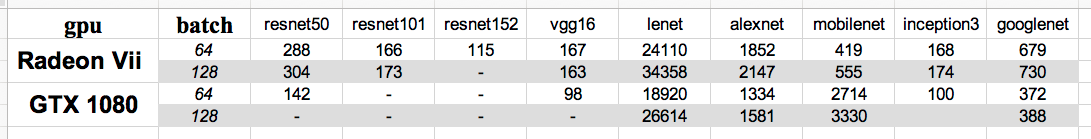
dcominottim
commented
3 years ago @Daniel451 @EmilPi @qixiang109 Unfortunately, without ROCm support for RDNA*, we can't test ROCm performance yet. However, I've managed to test a 6800 XT with tensorflow-directml (1.15.4, the latest version as of now) on W10! That's at least a little light for RDNA owners who are interested in ML. Here are the numbers:
Ryzen 9 5950X 32GB 3200MHz RAM 6800 XT Windows 10 20H2 19042.867 AMD Adrenalin 21.3.1 Python 3.7.10 tensorflow-directml 1.15.4
| FP32 | ResNet50 | AlexNet | Inception v3 | VGG16 | GoogLeNet | ResNet152 |
|---|---|---|---|---|---|---|
| batch_size=128 | 63.2 | 590.1 | 52.6 | 29.6 | 244.0 | / |
| batch_size=64 | / | / | / | / | / | 27.9 |
| FP16 | ResNet50 | AlexNet | Inception v3 | VGG16 | GoogLeNet | ResNet152 |
|---|---|---|---|---|---|---|
| batch_size=128 | 52 | 528.2 | 41.0 | 23.9 | 174.0 | 23.1 |
 plinnie
commented
3 years ago
plinnie
commented
3 years ago I have MI50 and V100 available which I can use for benchmarking. What would be the best benchmarks to run? I see the original benchmarks seem outdated
 cjm-sfw
commented
2 years ago
cjm-sfw
commented
2 years ago Dose anyone try the benchmark on Rocm 4.5? Seemly Rocm now support gfx1030(6800xt/6900xt)?
There is someone testing 6700xt:
Link:https://www.zhihu.com/question/469674526/answer/2189926640 From:ZHIHU
Linux-5.10, nvidia driver 460.91.03, cuda 11.2, pytorch-1.9.1,Tesla A100running benchmark for framework pytorch cuda version= 11.2 cudnn version= 8100 pytorch's vgg16 eval at fp32: 11.3ms avg pytorch's vgg16 train at fp32: 46.5ms avg pytorch's resnet152 eval at fp32: 44.4ms avg pytorch's resnet152 train at fp32: 157.3ms avg pytorch's densenet161 eval at fp32: 45.8ms avg pytorch's densenet161 train at fp32: 154.8ms avg pytorch's vgg16 eval at fp16: 7.8ms avg pytorch's vgg16 train at fp16: 41.9ms avg pytorch's resnet152 eval at fp16: 48.2ms avg pytorch's resnet152 train at fp16: 163.0ms avg pytorch's densenet161 eval at fp16: 48.1ms avg pytorch's densenet161 train at fp16: 174.4ms avg
Linux-5.14.5, ROCm-4.3.0, pytorch-1.9.1, Radeon 6700XT :running benchmark for framework pytorch cuda version= None cudnn version= 2012000 pytorch's vgg16 eval at fp32: 67.7ms avg pytorch's vgg16 train at fp32: 194.5ms avg pytorch's resnet152 eval at fp32: 57.8ms avg pytorch's resnet152 train at fp32: 226.2ms avg pytorch's densenet161 eval at fp32: 63.9ms avg pytorch's densenet161 train at fp32: 228.0ms avg pytorch's vgg16 eval at fp16: 25.8ms avg pytorch's vgg16 train at fp16: 118.2ms avg pytorch's resnet152 eval at fp16: 52.4ms avg pytorch's resnet152 train at fp16: 183.4ms avg pytorch's densenet161 eval at fp16: 54.5ms avg pytorch's densenet161 train at fp16: 195.7ms avg
 Djip007
commented
2 years ago
Djip007
commented
2 years ago Any 6900 XT benchmarks?
with not official support on rocm-4.5: ;)
>TF_ROCM_FUSION_ENABLE=1 python3 tf_cnn_benchmarks.py --num_gpus=1 --batch_size=128 --model=resnet50

Step    Img/sec total_loss
1   images/sec: 305.5 +/- 0.0 (jitter = 0.0)    7.781
10  images/sec: 304.3 +/- 0.3 (jitter = 1.1)    7.740
20  images/sec: 304.0 +/- 0.2 (jitter = 1.0)    7.827
30  images/sec: 304.0 +/- 0.2 (jitter = 0.9)    7.967
40  images/sec: 304.1 +/- 0.1 (jitter = 0.8)    7.885
50  images/sec: 304.1 +/- 0.1 (jitter = 0.7)    7.792
60  images/sec: 304.0 +/- 0.1 (jitter = 0.8)    8.011
70  images/sec: 303.9 +/- 0.1 (jitter = 0.8)    7.870
80  images/sec: 303.8 +/- 0.1 (jitter = 0.9)    7.923
90  images/sec: 303.8 +/- 0.1 (jitter = 0.9)    7.745
100 images/sec: 303.8 +/- 0.1 (jitter = 0.8)    7.990
----------------------------------------------------------------
total images/sec: 303.76
----------------------------------------------------------------
>TF_ROCM_FUSION_ENABLE=1 python3 tf_cnn_benchmarks.py --num_gpus=1 --batch_size=128 --model=resnet50 --use_fp16
Step Img/sec total_loss
1 images/sec: 457.7 +/- 0.0 (jitter = 0.0) 7.788
10 images/sec: 453.4 +/- 0.8 (jitter = 3.0) 7.738
20 images/sec: 452.8 +/- 0.6 (jitter = 2.0) 7.821
30 images/sec: 452.7 +/- 0.4 (jitter = 2.3) 7.962
40 images/sec: 452.6 +/- 0.4 (jitter = 2.3) 7.888
50 images/sec: 452.5 +/- 0.3 (jitter = 2.3) 7.795
60 images/sec: 452.5 +/- 0.3 (jitter = 2.5) 8.018
70 images/sec: 452.5 +/- 0.3 (jitter = 2.7) 7.868
80 images/sec: 452.7 +/- 0.3 (jitter = 2.9) 7.916
90 images/sec: 452.5 +/- 0.3 (jitter = 2.8) 7.739
100 images/sec: 452.4 +/- 0.3 (jitter = 2.9) 8.006
----------------------------------------------------------------
total images/sec: 452.35
----------------------------------------------------------------My previous Radeon VII results are here: https://github.com/ROCmSoftwarePlatform/tensorflow-upstream/issues/173#issuecomment-485216090
Hopefully AMD's next generation consumer GPUs include Matrix cores if they are actually bringing support to RDNA.
Titan RTX:
python3 tf_cnn_benchmarks.py --num_gpus=1 --batch_size=128 --model=resnet50

Step    Img/sec total_loss
1   images/sec: 352.6 +/- 0.0 (jitter = 0.0)    7.781
10  images/sec: 355.6 +/- 0.7 (jitter = 1.8)    7.740
20  images/sec: 355.5 +/- 0.4 (jitter = 1.1)    7.827
30  images/sec: 355.4 +/- 0.3 (jitter = 0.9)    7.966
40  images/sec: 355.6 +/- 0.2 (jitter = 1.0)    7.880
50  images/sec: 355.5 +/- 0.2 (jitter = 1.0)    7.790
60  images/sec: 355.4 +/- 0.2 (jitter = 0.9)    8.013
70  images/sec: 355.4 +/- 0.2 (jitter = 0.9)    7.866
80  images/sec: 355.3 +/- 0.1 (jitter = 0.9)    7.920
90  images/sec: 355.3 +/- 0.1 (jitter = 0.9)    7.743
100 images/sec: 355.3 +/- 0.1 (jitter = 0.9)    7.991
----------------------------------------------------------------
total images/sec: 355.08
----------------------------------------------------------------
python3 tf_cnn_benchmarks.py --num_gpus=1 --batch_size=128 --model=resnet50 --use_fp16
Step Img/sec total_loss
1 images/sec: 1127.1 +/- 0.0 (jitter = 0.0) 7.788
10 images/sec: 1119.9 +/- 3.7 (jitter = 7.1) 7.741
20 images/sec: 1122.1 +/- 2.6 (jitter = 9.3) 7.826
30 images/sec: 1121.3 +/- 2.1 (jitter = 5.0) 7.962
40 images/sec: 1121.6 +/- 1.9 (jitter = 5.6) 7.885
50 images/sec: 1119.3 +/- 1.7 (jitter = 8.4) 7.795
60 images/sec: 1117.8 +/- 1.6 (jitter = 9.5) 8.012
70 images/sec: 1116.1 +/- 1.6 (jitter = 12.6) 7.874
80 images/sec: 1115.2 +/- 1.4 (jitter = 13.9) 7.929
90 images/sec: 1114.7 +/- 1.5 (jitter = 13.8) 7.739
100 images/sec: 1114.1 +/- 1.4 (jitter = 14.1) 8.000
----------------------------------------------------------------
total images/sec: 1112.65
----------------------------------------------------------------CDNA and up compute carte (MI100 ...) have already Matrix core ... but yes not "consomer" card The support is not official... hop it may have some optimisations after official support..
Compared with RTX 3080 ... the old Titan is as fast... This benchmark is not optimised and no more update for tensorflow2... May be we can find some more update benchmark...
WannaBeOCer
commented
2 years ago The Titan RTX is slightly faster than a RTX 3080 since its FP32 accumulation runs at full throughput like Nvidia's professional/data center cards when using Tensor cores. Geforce RTX cards are limited to 0.5x throughput when using Tensor cores, it's a way to segment their lineup similar to how AMD/Nvidia limit FP64 throughput.
https://lambdalabs.com/gpu-benchmarks
I used this benchmark to test my MacBook M1 Pro and my Titan RTX: https://github.com/tlkh/tf-metal-experiments
python train_benchmark.py --type cnn --model resnet50 --xla --fp16 --steps 100
python train_benchmark.py --type cnn --model mobilenetv2 --xla --fp16 --steps 100
python train_benchmark.py --type transformer --model distilbert-base-uncased --xla --fp16 --steps 100
python train_benchmark.py --type transformer --model bert-large-uncased --bs 16 --xla --fp16 --steps 30
Model | GPU | BatchSize | Throughput
ResNet50 | Titan RTX |128 |901.0 img/sec
MobileNetV2 | Titan RTX |128 |1467.2 img/sec
DistilBERT | Titan RTX | 64 | 1216.9 seq/sec
BERTLarge | Titan RTX | 16 | 126.7 seq/sec
 tedliosu
commented
2 years ago
tedliosu
commented
2 years ago If it's alright I'd like to post here the benchmark results I got with my rx 6800 using ROCm 4.5.2 and amdgpu-dkms version 1:5.11.32.40502-1350682 (from the latest amdgpu-pro driver stack):
> TF_ROCM_FUSION_ENABLE=1 python3 tf_cnn_benchmarks.py --num_gpus=1 --batch_size=128 --model=resnet50

Step    Img/sec total_loss
1       images/sec: 226.9 +/- 0.0 (jitter = 0.0)        7.781
10      images/sec: 226.4 +/- 0.3 (jitter = 0.1)        7.740
20      images/sec: 226.5 +/- 0.2 (jitter = 0.2)        7.827
30      images/sec: 226.4 +/- 0.1 (jitter = 0.2)        7.966
40      images/sec: 226.4 +/- 0.1 (jitter = 0.2)        7.883
50      images/sec: 226.5 +/- 0.1 (jitter = 0.2)        7.800
60      images/sec: 226.5 +/- 0.1 (jitter = 0.3)        8.008
70      images/sec: 226.5 +/- 0.1 (jitter = 0.2)        7.872
80      images/sec: 226.5 +/- 0.1 (jitter = 0.2)        7.930
90      images/sec: 226.5 +/- 0.1 (jitter = 0.2)        7.743
100     images/sec: 226.6 +/- 0.1 (jitter = 0.2)        7.996
----------------------------------------------------------------
total images/sec: 226.54
----------------------------------------------------------------
> TF_ROCM_FUSION_ENABLE=1 python3 tf_cnn_benchmarks.py --num_gpus=1 --batch_size=128 --model=resnet50 --use_fp16
Step Img/sec total_loss
1 images/sec: 316.8 +/- 0.0 (jitter = 0.0) 7.786
10 images/sec: 316.4 +/- 0.3 (jitter = 0.5) 7.742
20 images/sec: 316.7 +/- 0.2 (jitter = 0.6) 7.826
30 images/sec: 316.8 +/- 0.1 (jitter = 0.7) 7.964
40 images/sec: 316.8 +/- 0.1 (jitter = 0.7) 7.884
50 images/sec: 316.9 +/- 0.1 (jitter = 0.6) 7.799
60 images/sec: 316.8 +/- 0.1 (jitter = 0.6) 8.015
70 images/sec: 316.7 +/- 0.1 (jitter = 0.7) 7.867
80 images/sec: 316.7 +/- 0.1 (jitter = 0.6) 7.922
90 images/sec: 316.7 +/- 0.1 (jitter = 0.6) 7.753
100 images/sec: 316.7 +/- 0.1 (jitter = 0.6) 7.999
----------------------------------------------------------------
total images/sec: 316.61
----------------------------------------------------------------I guess these results are somewhat in line with @Djip007's results, as at least according to userbenchmark.com the 6900 XT is around 40% faster than the 6800.
However, what I don't understand is how is the Radeon VII able to basically match the 6900 XT and beat the rx 6800 with the above set of benchmarks which I ran, when both the 6900 XT and 6800 are clearly the faster GPUs at least according to Geekbench's OpenCL benchmarks (note how the 6900 XT scores 167460, the 6800 scores 129251, and the Vega 20 i.e. Radeon VII only scores 96073). Could this performance discrepancy be explained by the Radeon VII's massive memory bandwidth, or the fact that the RDNA series of GPUs are not as optimized for compute (microarch-wise) as Radeon VII, or is it just that ROCm and the amdgpu-pro drivers haven't been optimized for performing compute tasks on RDNA cards?
 gururise
commented
2 years ago
gururise
commented
2 years ago Ran some benchmarks on my RX6800XT (Quiet Mode Switch) in the Docker ROCm5.2.0-TF2.8-dev container:
>TF_ROCM_FUSION_ENABLE=1 python3 tf_cnn_benchmarks.py --num_gpus=1 --batch_size=128 --model=resnet50

Step    Img/sec total_loss
1       images/sec: 258.0 +/- 0.0 (jitter = 0.0)        7.781
10      images/sec: 168.1 +/- 20.7 (jitter = 0.5)       7.740
20      images/sec: 203.7 +/- 10.6 (jitter = 0.3)       7.826
30      images/sec: 219.1 +/- 7.1 (jitter = 0.4)        7.965
40      images/sec: 227.7 +/- 5.4 (jitter = 0.4)        7.878
50      images/sec: 233.1 +/- 4.3 (jitter = 0.3)        7.790
60      images/sec: 236.9 +/- 3.6 (jitter = 0.3)        8.006
70      images/sec: 239.7 +/- 3.1 (jitter = 0.4)        7.866
80      images/sec: 241.8 +/- 2.7 (jitter = 0.4)        7.929
90      images/sec: 243.4 +/- 2.4 (jitter = 0.5)        7.745
100     images/sec: 244.8 +/- 2.2 (jitter = 0.5)        7.997
----------------------------------------------------------------
total images/sec: 244.74
----------------------------------------------------------------
> TF_ROCM_FUSION_ENABLE=1 python3 tf_cnn_benchmarks.py --num_gpus=1 --batch_size=128 --model=resnet50 --use_fp16
Step Img/sec total_loss
1 images/sec: 360.7 +/- 0.0 (jitter = 0.0) 7.784
10 images/sec: 368.3 +/- 0.9 (jitter = 1.5) 7.745
20 images/sec: 368.8 +/- 0.5 (jitter = 0.9) 7.827
30 images/sec: 368.9 +/- 0.3 (jitter = 0.6) 7.964
40 images/sec: 368.9 +/- 0.3 (jitter = 0.6) 7.881
50 images/sec: 368.9 +/- 0.2 (jitter = 0.6) 7.792
60 images/sec: 368.7 +/- 0.2 (jitter = 0.8) 8.013
70 images/sec: 368.6 +/- 0.2 (jitter = 1.0) 7.873
80 images/sec: 368.6 +/- 0.2 (jitter = 1.0) 7.926
90 images/sec: 368.5 +/- 0.1 (jitter = 1.0) 7.739
100 images/sec: 368.2 +/- 0.2 (jitter = 1.2) 7.999
----------------------------------------------------------------
total images/sec: 368.10
----------------------------------------------------------------I would try it in Power Mode, but that would involve opening my case and flipping the BIOS switch on the card, which is too much work at this time.
It would be very useful to compare real training performance on amd and nvidia cards. For Nvidia cards we have a lot of graphs and tests, for example: https://github.com/u39kun/deep-learning-benchmark But for AMD cards there is no performance metrics. It will be great to made direct comparsion between AND and NVIDIA with last cuDNN.