Enhanced Usage Tracking for OBIEE
This is licensed under the MIT license. See license.txt for details.
Introduction
OBIEE provides Usage Tracking as part of the core product functionality. It writes directly to a database table every Logical Query that hits the BI Server, including details of who ran it, when, and information about how it executed including for how long, how many rows, and so on. This in itself is a veritable goldmine of information about your OBIEE system. All OBIEE deployments should have Usage Tracking enabled, for supporting performance analysis, capacity planning, catalog rationalisation, and more.
What Usage Tracking doesn't track is interactions between the end user and the Presentation Services component. Presentation Services sits between the end user and the BI Server from where the actual queries get executed. This means that until a user executes an analysis, there's no record of their actions in Usage Tracking. There is this audit data available, but you have to manually enable and collect it, which can be tricky. This is where Enhanced Usage Tracking comes in. It enables the collection and parsing of every click a user makes in OBIEE. For an overview of the potential of this data, see the article here and here.
Highlights of the data include:
-
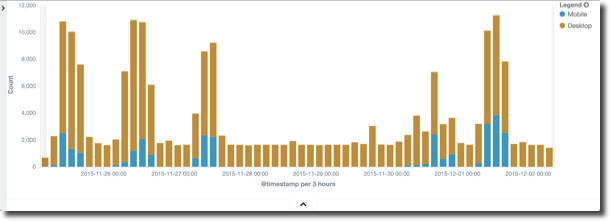
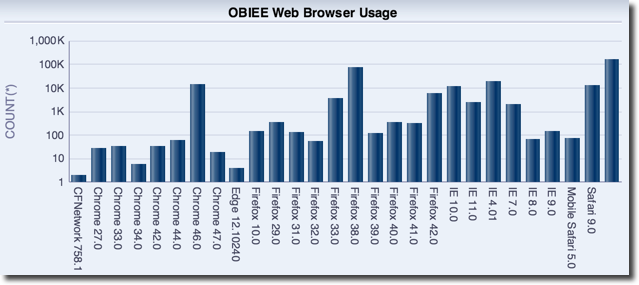
Which web browsers do people use? Who is accessing OBIEE with a mobile device?
-
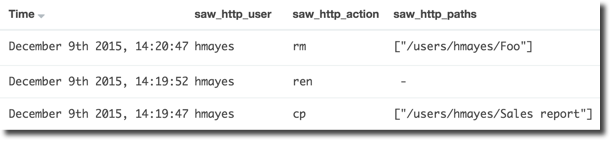
Who deleted a catalog object? Who moved it?
-
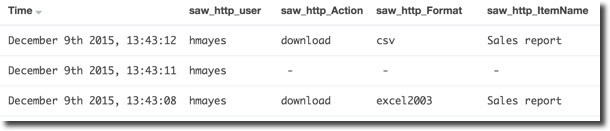
What dashboards get exported to Excel most frequently, and by whom?
How to use Enhanced Usage Tracking
Configure Click Event Logging for Presentation Services
N.B. For high-concurrency systems you should test the impact that this increased logging may have on the server
For a background to Presentation Services logging, see this article here.
To enable logging at a granular level for HTTP events, do the following:
-
Backup Presentation Services config file
cp /app/oracle/biee/user_projects/domains/bi/config/fmwconfig/biconfig/OBIPS/instanceconfig.xml /app/oracle/biee/user_projects/domains/bi/config/fmwconfig/biconfig/OBIPS/instanceconfig.xml.bak -
Amend configuration to interlace following configuration with the
Loggingsection.<Writer implementation="FileLogWriter" name="RM http req" disableCentralControl="true" writerClassId="6" dir="{%ORACLE_BIPS_INSTANCE_LOGDIR%}" filePrefix="rm_http" maxFileSizeKb="10240" filesN="10" fmtName="ODL-Text"/> [...] <WriterClassGroup name="RM_HTTP_REQ">6</WriterClassGroup> [...] <FilterRecord writerClassGroup="RM_HTTP_REQ" disableCentralControl="true" path="saw.httpserver.request.showrequest" information="32" warning="32" error="32" trace="32" incident_error="32"/>
-
Restart Presentation Services
Now go to OBIEE and signin - you should see the rm_http.log file being written to on every click:
[oracle@demo logs]$ tail -n20 -f rm_http0.log
Request params:
bieehome
icharset=utf-8
caj_token=FNSo1JVMhPo
[[
File:httpserver.cpp
Line:351
Location:
    saw.httpserver.request.showrequest
    saw.httpserver.processrequest
    saw.rpc.server.responder
    saw.rpc.server
    saw.rpc.server.handleConnection
    saw.rpc.server.dispatch
    saw.threadpool.socketrpcserver
    saw.threads
SessionID: 192.168.10.105.5.pmavru1
RemoteIP: 192.168.10.105
SIKey: ssi
]]
[2016-12-06T10:12:49-05:00] [OBIPS] [TRACE:1] [] [saw.httpserver.request.showrequest] [ecid: 42b9c14b-9be8-48cc-8d90-922f5b822c44-00071885,0:1] [tid: 1308186368] [SI-Name: ] [IDD-Name: ] [IDD-GUID: ] [userId: weblogic] Request received.
Configure and Run Log Parser
Download and install the last release of Logstash 2.4 (this has not been tested with Logstash 5.0)
wget https://download.elastic.co/logstash/logstash/packages/centos/logstash-2.4.1.noarch.rpm
sudo rpm -i logstash-2.4.1.noarch.rpm
Clone the github repo:
cd ~
git clone https://github.com/RittmanMead/obi-enhanced-usage-tracking.git
Edit the logstash-obi-clickstream.conf config file, to set the path :
- in the input stanza for the
rm_httpfile generated by Presentation Services - in the output csv configuration. It's up to you where you write the CSV file. The assumption is that this is
/home/oracle/obi-clickdata- if using a different path update scripts accordingly.
Run logstash
/opt/logstash/bin/logstash -f ~/obi-enhanced-usage-tracking/logstash-obi-clickstream.confNow go to the path you set in the output clause of the logstash configuration file above, and you should see a CSV being written to with events each time you click on something.

Note that you could optionally send this data also to Elasticsearch at this point, simply by adding an additional configuration line in the output stanza.
Set up Tables in Oracle
First, set up the necessary tables in Oracle. Modify the script first to set the credentials and connection details for the database where you want to create the tables:
./obi-clickdata-setup.shMake sure that you run this from the obi-enhanced-usage-tracking folder. This creates a set of tables and views in the BIEE_BIPLATFORM schema, as well as a Oracle directory object through which the data is going to be loaded:
OBI_CLICKDATA_STAGE
OBI_CLICKDATA_REQUESTGROUP
OBI_CLICKDATA
VW_OBI_CLICKDATA_SESS_SUMMARY
Load Click Data into Oracle
Update the obi-clickdata-incremental-load.sh script to set the credentials for the BIEE_BIPLATFORM schema. Now run this script to populate the Oracle table with new data since the last script run.
[oracle@demo obi-enhanced-usage-tracking]$ ./obi-clickdata-incremental-load.sh

SQL*Plus: Release 12.1.0.2.0 Production on Tue Dec 6 12:26:48 2016

Copyright (c) 1982, 2014, Oracle.  All rights reserved.

Last Successful login time: Tue Dec 06 2016 12:25:41 -05:00

Connected to:
Oracle Database 12c Enterprise Edition Release 12.1.0.2.0 - 64bit Production
With the Partitioning, OLAP, Advanced Analytics and Real Application Testing options

8 rows created.

Commit complete.

Disconnected from Oracle Database 12c Enterprise Edition Release 12.1.0.2.0 - 64bit Production
With the Partitioning, OLAP, Advanced Analytics and Real Application Testing options
You can run this script on demand, write your own schedule wrapper for it - or simply use the Linux watch command to invoke it every x seconds:
watch -n 30 ./obi-clickdata-incremental-load.shHead over to the OBI_CLICKDATA table and you'll see the scraped data:


Using the TIMESTAMP WITH TIMEZONE datatype in the OBI_CLICKDATA table causes a problem for some software (including the latest version of DV). To get around this, you can create a view with the timestamp simply cast to a standard TIMESTAMP datatype. You may need to modify this to cope with the actual timezone that you're working in:
create view vw_obi_clickdata as
select SESSIONID
    ,CLICK_NUMBER
    ,to_date(to_char(click_ts,'YYYY-MM-DD HH24:MI:SS'),'YYYY-MM-DD HH24:MI:SS') as click_ts
    ,SAW_USER
    ,REQUESTTYPE
    ,REQUEST_GROUP
    ,REQUEST
    ,FOLDER
    ,ITEMNAME
    ,EDITORID
    ,REPORTEDITOR
    ,SUBJECTAREA
    ,SATABLE
    ,ACTION
    ,USERAGENT
    ,MOBILE_IND
    ,COOKIE_ORA_BIPS_NQID
    ,ECID
from obi_clickdata;
With this view created you can easily chuck the data into DV and explore it some more:


Problems?
Please raise any issues on the github issue tracker. This is open source, so bear in mind that it's no-one's "job" to maintain the code - it's open to the community to use, benefit from, and maintain.
If you'd like specific help with an implementation, Rittman Mead would be delighted to assist - please do get in touch to discuss our rates.