 This is the repository of the project developed for the course "Software Engineering for Geoinformatics" by [@Se4GEO/contributors](https://github.com/Rkomi98/S4GEO/graphs/contributors).
```diff
!Read it before downloading the files!
```
We are including here a short description on what our software provides to users and how they can use it.
Our webiste is an Open-Source Web Application, created to give to all users the possibility to get informed about air pollution and pollutants, on 5 cities: it is possible thanks to visualization of air quality data from sensors and through further analysis provided by the application.
## What do I need to run the application on my device?
Firstly, download all the folders and files that are inside the repository:
* static (all folder)
* templates (all folder)
* main.py (crucial for making the application run)
* createSchema.py
* dbConfig.txt
* useful files folder (It has inside it the Database Creation.ipynb (explanation of this file is provided below))
To run the application on your device it is mandatory to have installed all the libraries you can find at the beginning of the python script written in the main.py file. Then:
1. Configure the database in the PGADMIN application (the installation of PGADMIN and the extention of Postgis is mandatory to run the application). If you haven't installed PGADMIN and PostgresSQL we suggest you to use the username and password we used in the dbconfig.txt file. Otherwise you will have to change in the application the password ('Gram2021'), the name of user and of the database according to the one used in your device.
2. Before running the application for the first time you the "createschema.py" file and then to use jupyter notebook "DatabaseCreation.ipynb"
3. Check if the databases exist in your local database.
4. Be careful to open your Python editor and have in the path the main, the dbconfig.txt file exactly as you can find it in the repository.
5. Run the app from main.py file.
## Sections of the web application
After running the main.py file the users can access the homepage. On the top menu bar the users can access only the:
- "More Info" page without logging in. Inside this page they can view general information about our application (inside the "General Idea" section) and about the air quality data we use (inside the "Data" section).In this last one it is possible to view a dynamic popup map with all the stations, from which we retrieve the data, in all 5 cities.

- To be able to open the "Project" section the users need to be registered, so it is important that the database is correctly configured. There they can find all possible steps for creating their new project with the functionalities provided by the application.
#### How to register and login
To register the user has to go in the login page and then in register. Once registered, the user can login.
* If the user is already registered and tries to register with the same user, the page is automatically reloaded
* If the user tries to login with the wrong user or password, the page is automatically reloaded
This is the repository of the project developed for the course "Software Engineering for Geoinformatics" by [@Se4GEO/contributors](https://github.com/Rkomi98/S4GEO/graphs/contributors).
```diff
!Read it before downloading the files!
```
We are including here a short description on what our software provides to users and how they can use it.
Our webiste is an Open-Source Web Application, created to give to all users the possibility to get informed about air pollution and pollutants, on 5 cities: it is possible thanks to visualization of air quality data from sensors and through further analysis provided by the application.
## What do I need to run the application on my device?
Firstly, download all the folders and files that are inside the repository:
* static (all folder)
* templates (all folder)
* main.py (crucial for making the application run)
* createSchema.py
* dbConfig.txt
* useful files folder (It has inside it the Database Creation.ipynb (explanation of this file is provided below))
To run the application on your device it is mandatory to have installed all the libraries you can find at the beginning of the python script written in the main.py file. Then:
1. Configure the database in the PGADMIN application (the installation of PGADMIN and the extention of Postgis is mandatory to run the application). If you haven't installed PGADMIN and PostgresSQL we suggest you to use the username and password we used in the dbconfig.txt file. Otherwise you will have to change in the application the password ('Gram2021'), the name of user and of the database according to the one used in your device.
2. Before running the application for the first time you the "createschema.py" file and then to use jupyter notebook "DatabaseCreation.ipynb"
3. Check if the databases exist in your local database.
4. Be careful to open your Python editor and have in the path the main, the dbconfig.txt file exactly as you can find it in the repository.
5. Run the app from main.py file.
## Sections of the web application
After running the main.py file the users can access the homepage. On the top menu bar the users can access only the:
- "More Info" page without logging in. Inside this page they can view general information about our application (inside the "General Idea" section) and about the air quality data we use (inside the "Data" section).In this last one it is possible to view a dynamic popup map with all the stations, from which we retrieve the data, in all 5 cities.

- To be able to open the "Project" section the users need to be registered, so it is important that the database is correctly configured. There they can find all possible steps for creating their new project with the functionalities provided by the application.
#### How to register and login
To register the user has to go in the login page and then in register. Once registered, the user can login.
* If the user is already registered and tries to register with the same user, the page is automatically reloaded
* If the user tries to login with the wrong user or password, the page is automatically reloaded

 ### Create Project page
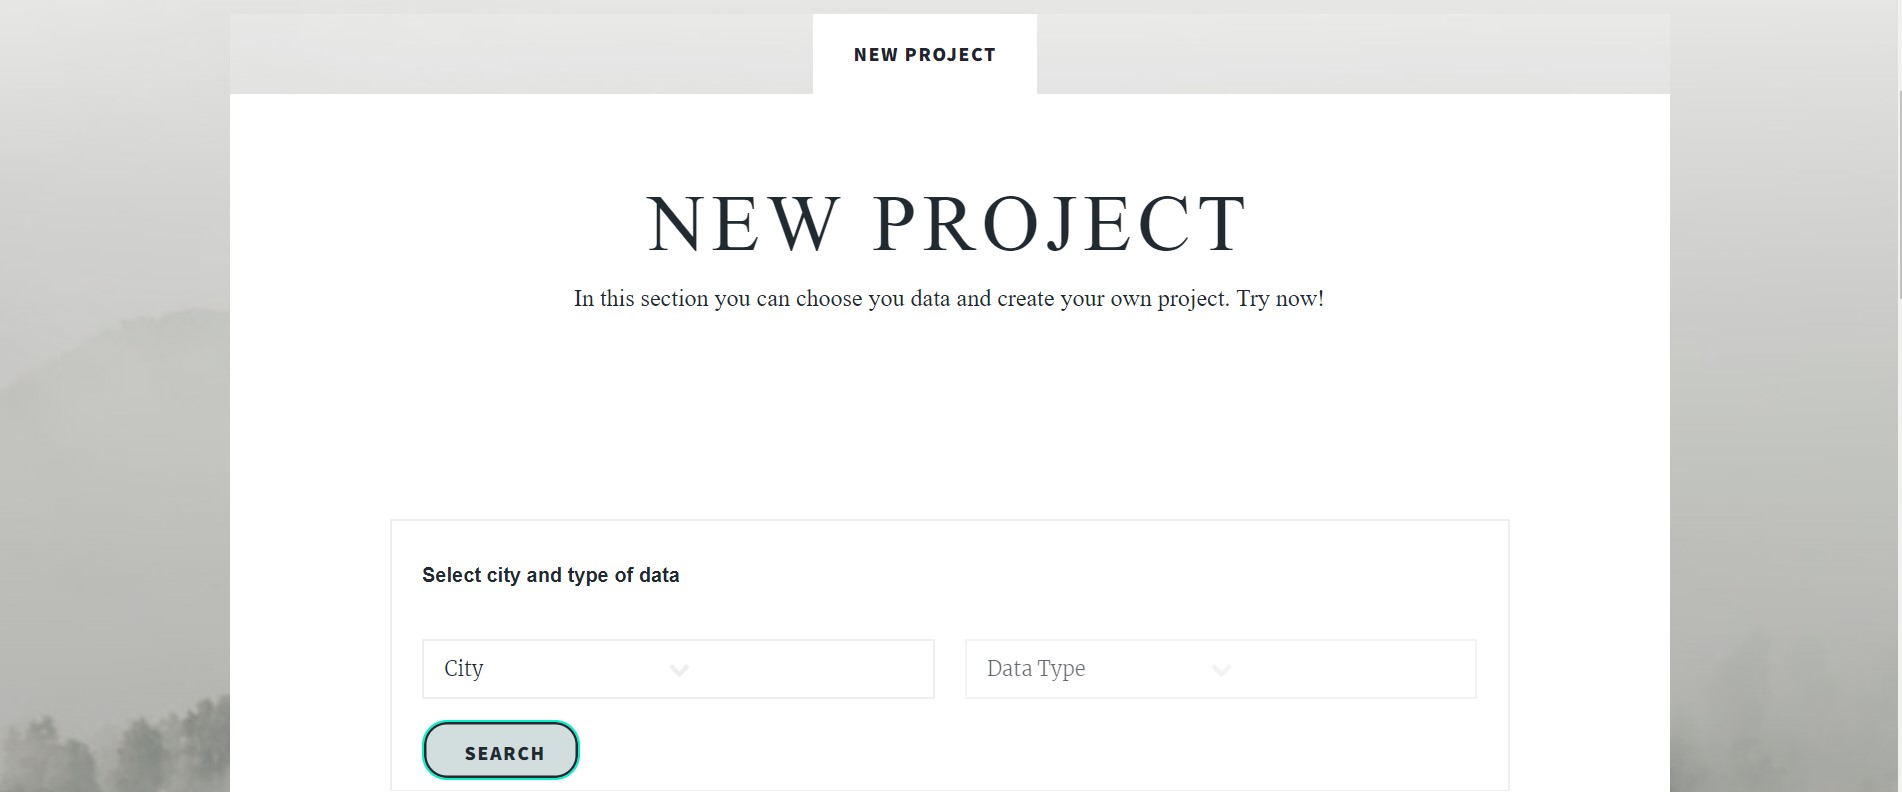
In the "Create project" follow these steps:
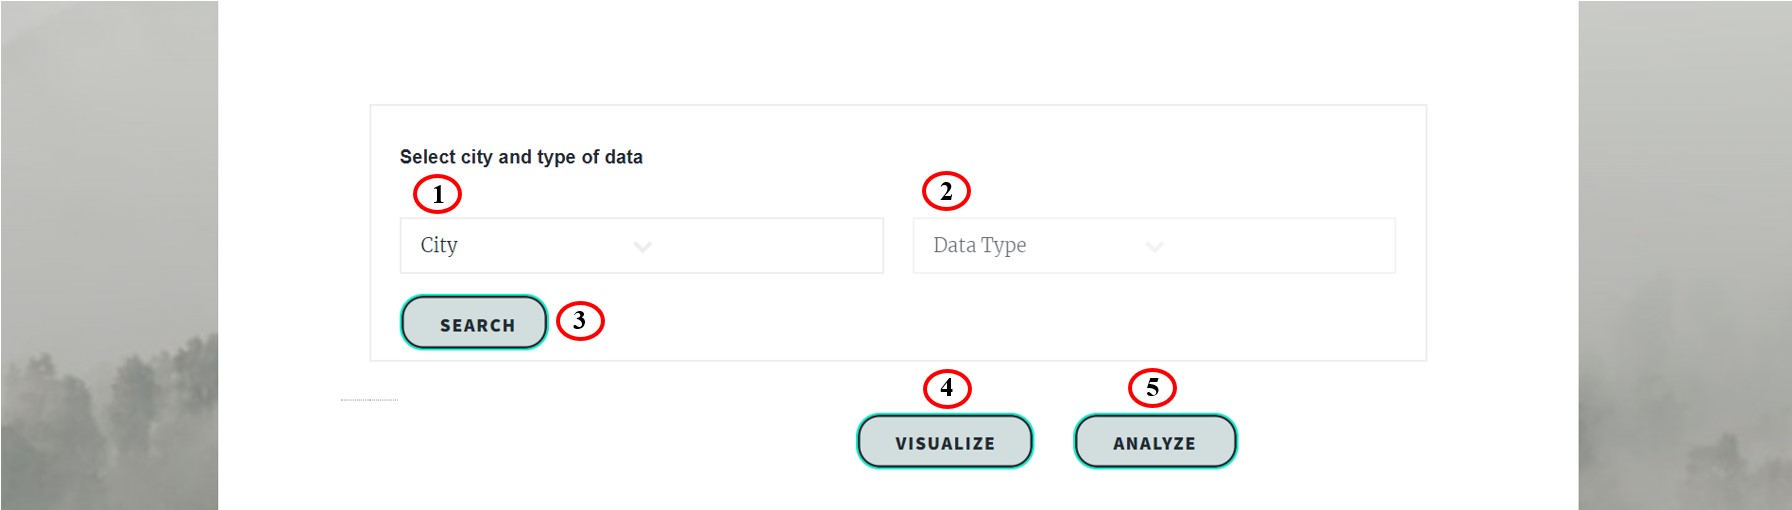
1. Select a city of which you want to retrieve data. You can decide a city between:
* Skopje
* Belgrad
* Krakow
* Paris
* London
2. Select the type of data. You can decide between:
* Real Time (the frequence of data update changes between city and city)
* Forecast (so data of pollutants of the last 2 days, today and the next 5 days)
* Both (In the last case the analysis will be performed only on forecast data.)
Attention: You cannot choose the data type before choosing the city!
3. Click on Search button to retrieve the table with the queried data.
3.1 In case you choose forecast option or both (in step 2), you have the possibility to sort and filter your data.
### Create Project page

In the "Create project" follow these steps:

1. Select a city of which you want to retrieve data. You can decide a city between:
* Skopje
* Belgrad
* Krakow
* Paris
* London
2. Select the type of data. You can decide between:
* Real Time (the frequence of data update changes between city and city)
* Forecast (so data of pollutants of the last 2 days, today and the next 5 days)
* Both (In the last case the analysis will be performed only on forecast data.)
Attention: You cannot choose the data type before choosing the city!
3. Click on Search button to retrieve the table with the queried data.
3.1 In case you choose forecast option or both (in step 2), you have the possibility to sort and filter your data.
 4. Click on Visualize button to view the interactive map of the station from which the data was queried.
5. Click on Analyze button to view the table of the simple statistic analysis of the queried data.
6. Click on Export Analysis to access a new page with more advanced analysis performed on these data. (This button appears at the end of the analysis table.)
4. Click on Visualize button to view the interactive map of the station from which the data was queried.
5. Click on Analyze button to view the table of the simple statistic analysis of the queried data.
6. Click on Export Analysis to access a new page with more advanced analysis performed on these data. (This button appears at the end of the analysis table.)
 :warning: **If you have performed only some requests it is normal if you receive error**: Try the jupyter notebook if you want to see the problem. You need some observations to perform a pandas profiling analysis.