The Wheezer

Intel Hackathon 2017
Project Link: https://devpost.com/software/wheezer-418n3w
What is it?
Our device measures the exhalation flow rate via the pressure drop through a venturi. Based on the venturi dimensions, the fluid density, and the pressure drop, the flow rate can be calculated and integrated for the total lung capacity. This information is plotted on a digital display on the device and is also transmitted via bluetooth to a connected android device.
Inspiration
Asthma affects approximately 1 in 12 people in the US (AAAAI, 2001). The most significant measurement for quantifying asthma severity is the pulmonary lung function test. One such function test includes spirometry, which is used to assess the lung volume and exhalation rate of the patient. Without health insurance, these tests can cost over $200 per visit (Healthcare Bluebook). Our goal is to design a low-cost device for spirometry testing that can accurately assess the patients lung capacity and flow rate during exhalation.
Circuit Information


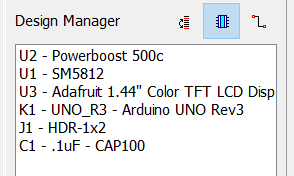
This image is a snapshot of a schematic in DIPTRACE. DIPTRACE is a freeware program used for circuitry design. The schematic file is inside the Electrical Schematic folder.
To avoid the lower resolution of the Arduino 101*, we needed to use a differential pressure sensor with i2c communication. We chose to use the SM5812 because it was affordable and had the option to output data over i2c or its analog output. We wanted our device to be portable, so we chose a 3.7V 500 mAh battery from Adafruit. The SM5812 needs to have 5V, so we chose the Powerboost 500c charger in order to boost the battery voltage. The Powerboost 500c charger also has the capability to charge the battery, which is super aweosome. To turn on and off the device, there is a switch between EN and ground on the PowerBoost 500 charger. When we started the project, the 1.44" TFT LCD Display was going to perform the realtime graphing operations for the data; however, we ended up deciding to switch to performing the realtime operations on an Android device through Bluetooth (which kind of defeats the purpose of the LCD.) This switch allowed us to fully use the arduino 101's BLE. An important note on the LCD: If you want to control the Backlight, you'll need to hook the LITE pin up to a PWM pin on the Arduino 101. I chose not to, which can clearly be seen in the schematic. Also, to run the code with no errors, use a SD card with the intel.bmp image in it. The purchasing links are in the BOM section.
*The arduino 101 operating voltage is 3.3V, thus the analog input pins go from 0 to 3.3V. That cuts off everything over 3.3V that a 5V sensor would output. You can scale the a voltage output to fit the 3.3V cut off; however, we found that i2c was the simplest method that would require the least components.
Our PCB
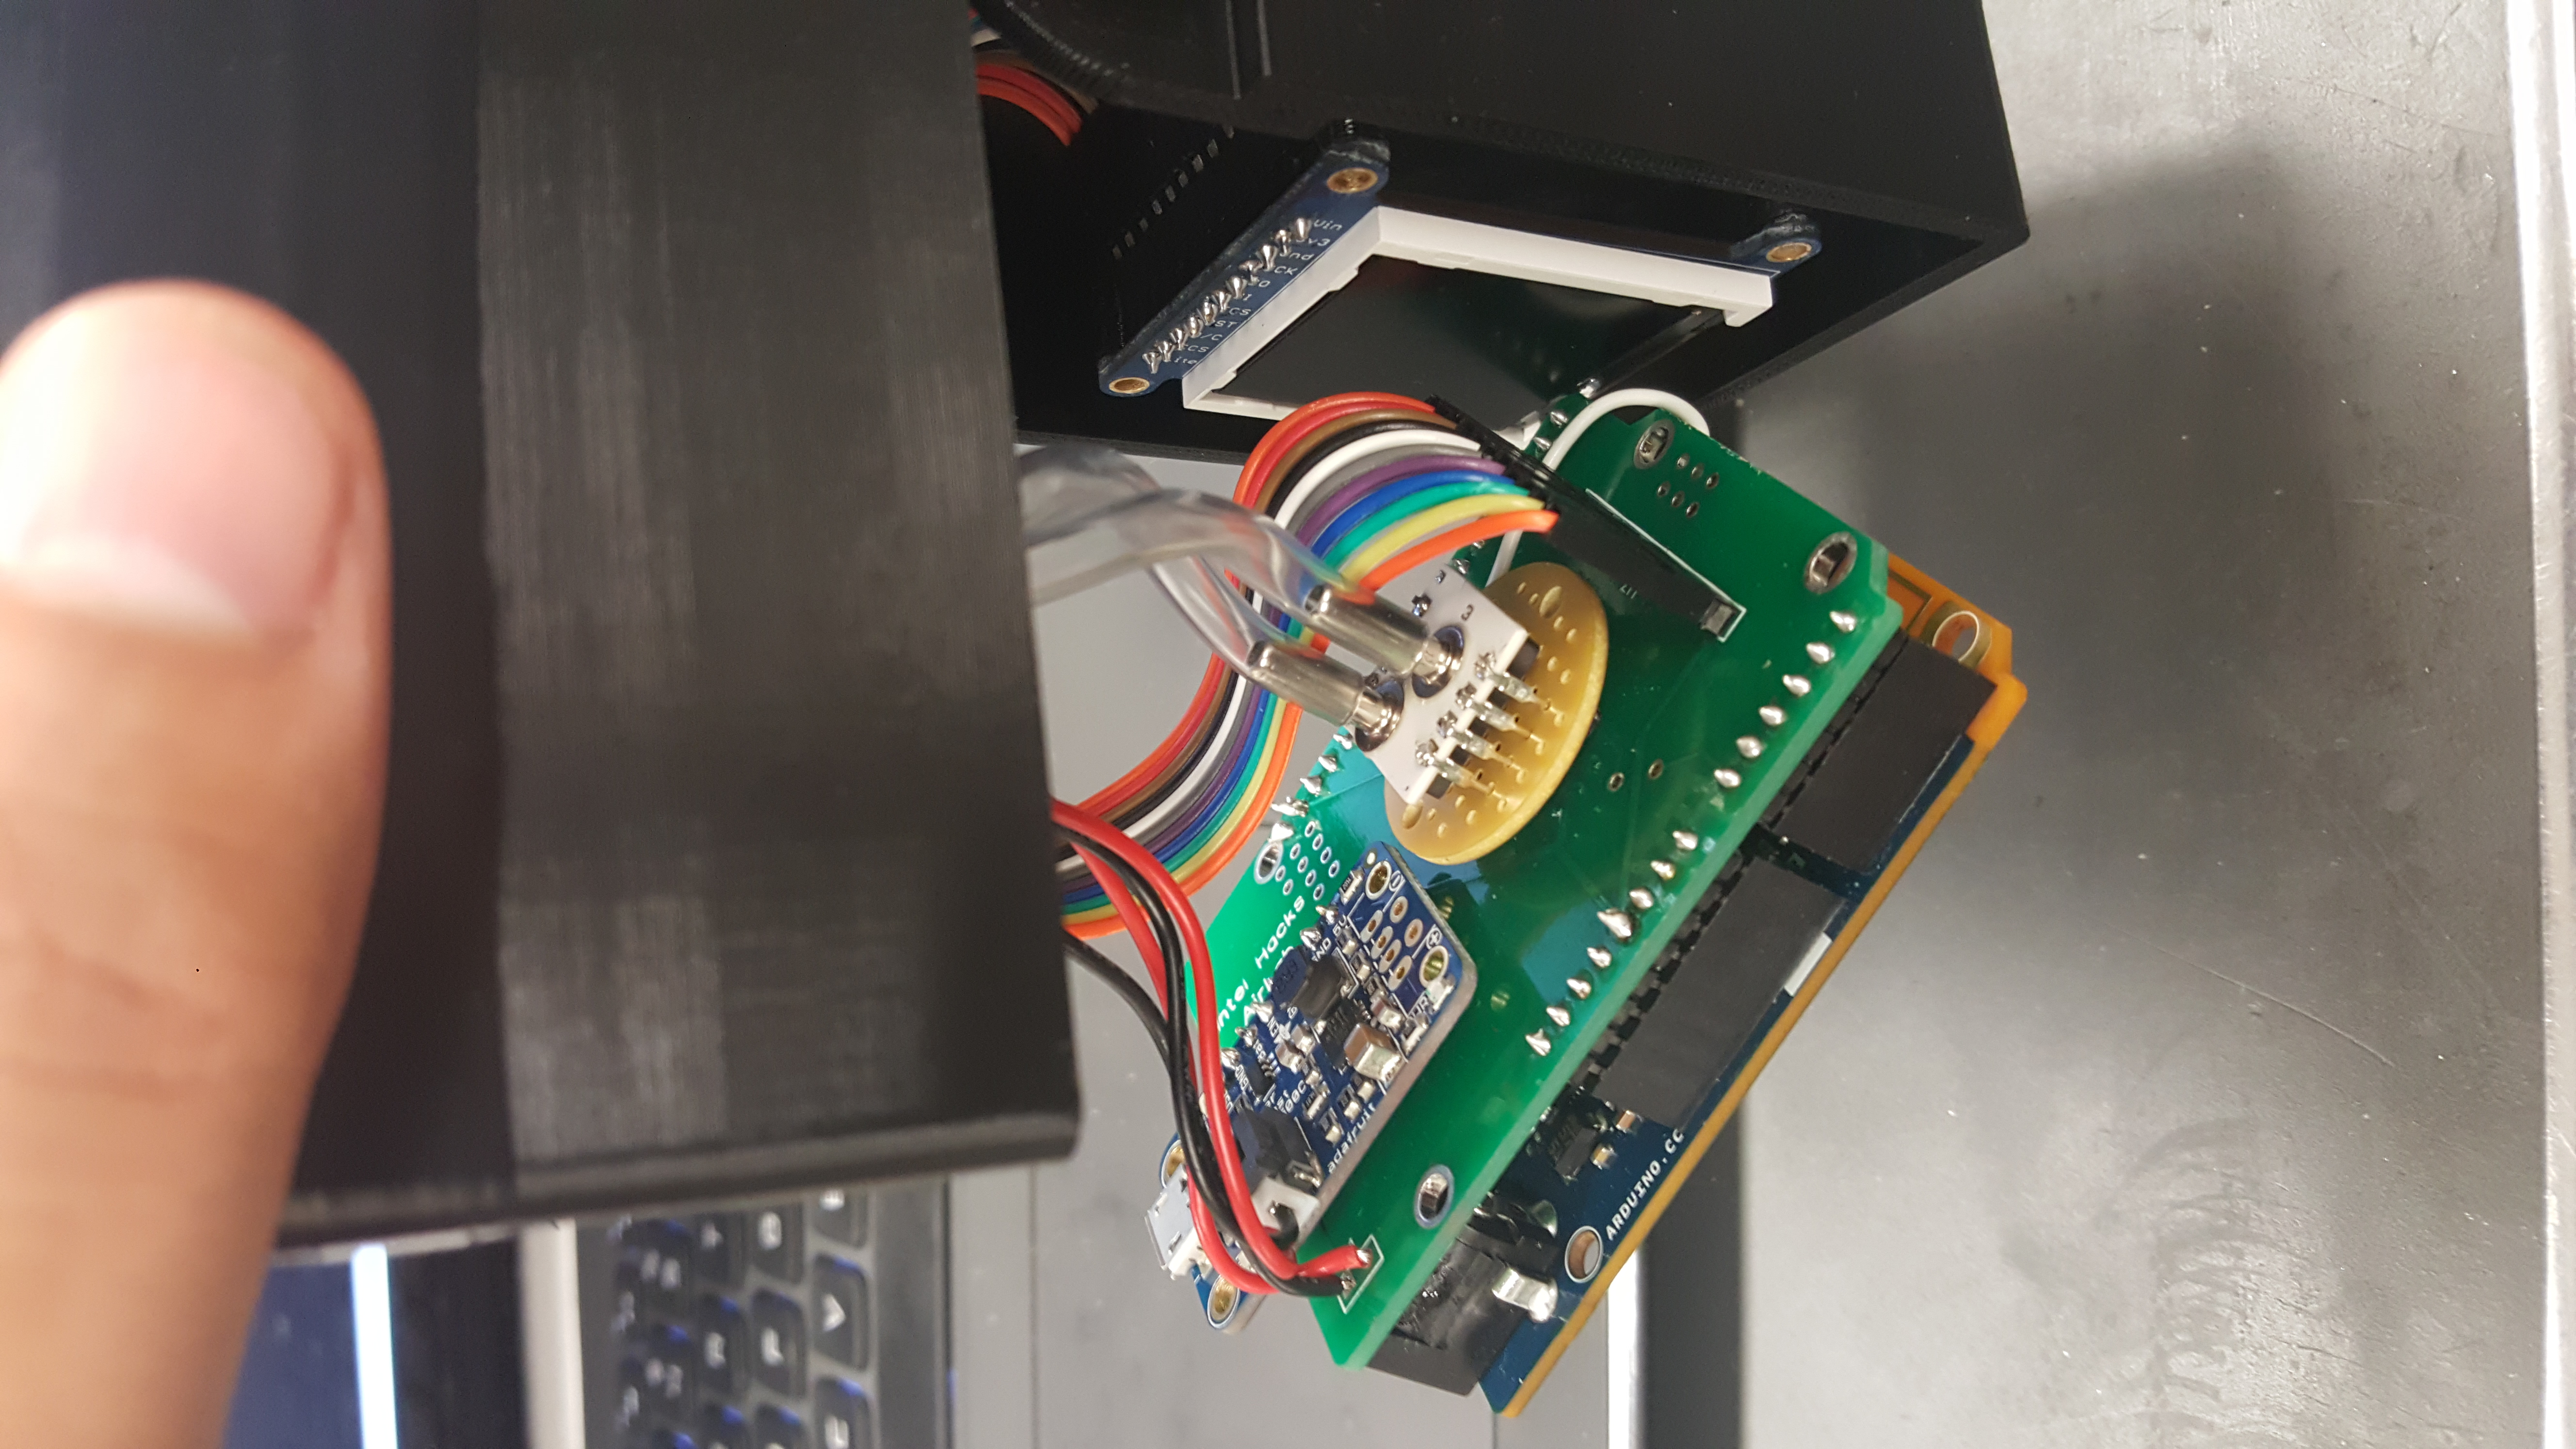
We ordered our PCB from SEEEDStudio*. We were debating on whether or not to provide the routing and GERBER files on Github; we ended up deciding not to because the SM5812 has recently become an NRND (Not recommended for new designs) component.
SEEEDStudio: https://www.seeedstudio.com/fusion_pcb.html
Data Comparison
In order to see how accurate #TheWheezer was, we needed to compare it to a medical grade instrument. Since Tyler has asthma, it was very easy to get the spirometry data.
Data gathered at the doctors office:
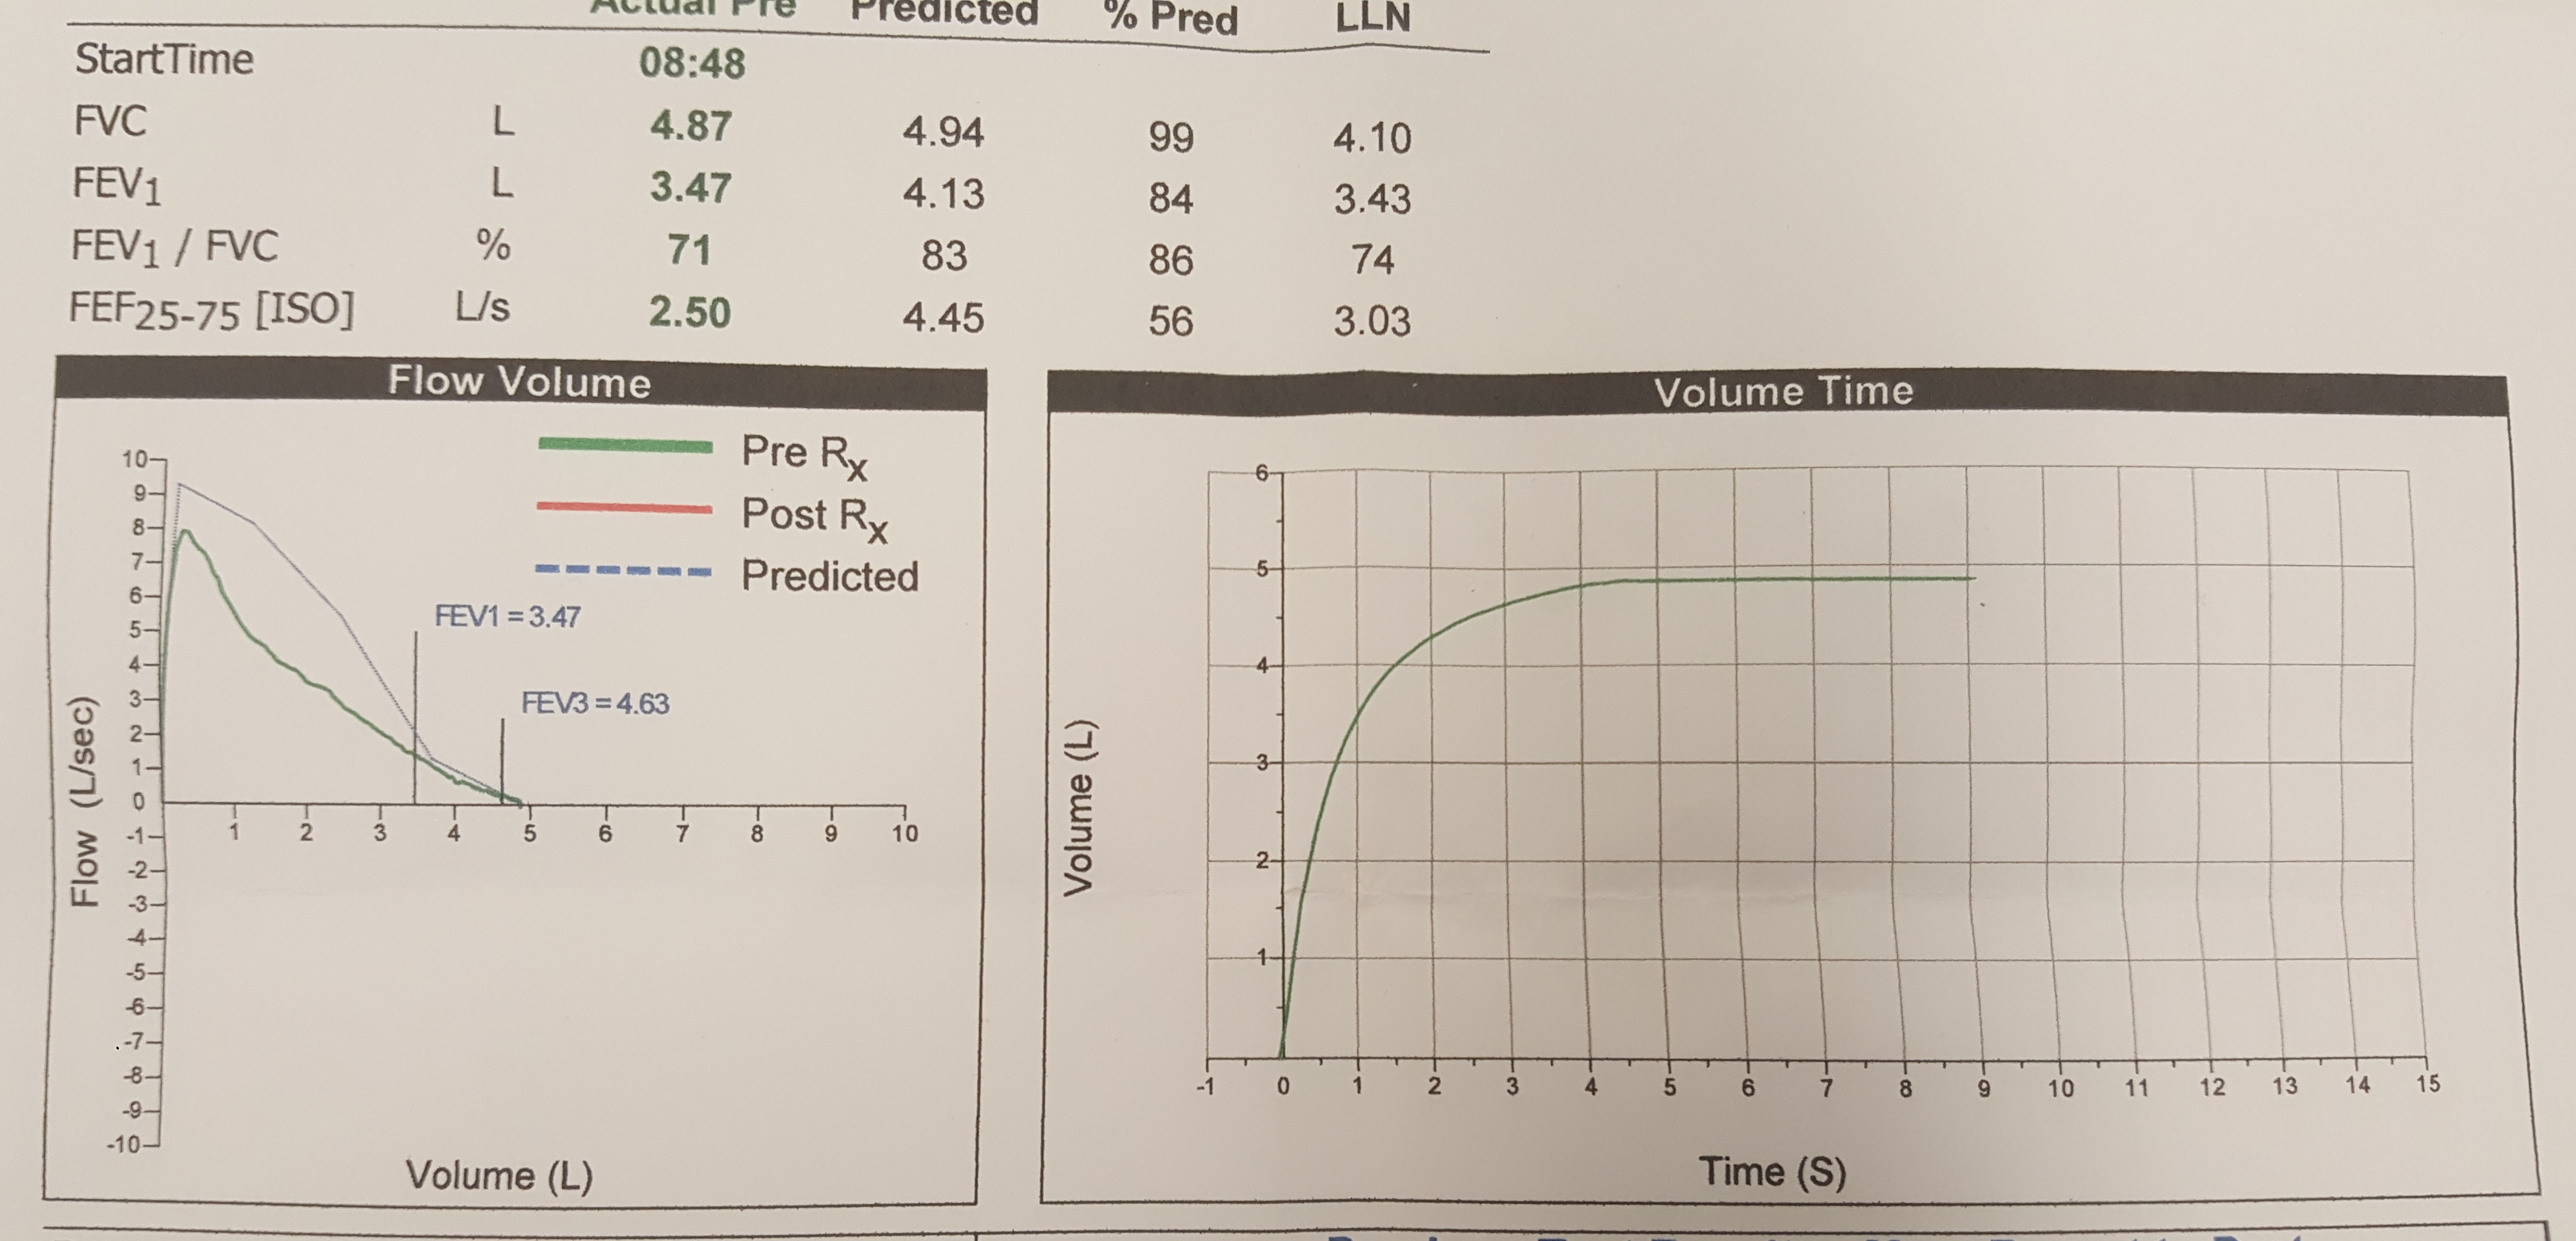
-
FVC = ~8
-
Peak = 4.87
-
FEV1 = 3.47
Important Takeaways
-
The peak in the left graph represents how well air is moving through your airways at the time you take the test. Typically asthmatics have something called a "peak flow meter" which only measure the fastest flow you expel. It can be a helpful monitor for measuring present asthma symptoms; however, the peak doesn't tell you anything about your small airways- which makes these available devices limited.
-
FVC stands for forced vital capacity. FVC is the total amount of air exhaled during the test.
-
FEV stands for Forced expiratory volume, which measures how much air you can exhale during a forced breath.
-
FEV1 - The amount of air exhaled may be measured during the first second
Our Data:

-
FVC = 8.2
-
Peak = 5.1
-
FEV1 = ~2.6
Important Takeaways
-
Note that the Volume vs Time graph is created by integrating the Flow Rate vs Time Data.
-
The blue line on the Flow Rate vs Time graph drops off at 2.74 L/s because it is the threshold that #TheWheezer is set to. The threshold is relatively high because the Differential pressure sensor is not sensitive enough to measure very low pressure drops. It ends on 2.74V and not 0 because the arduino code exits the plotting loop when the sensor is below the threshold. We expected the threshold to be lower.
Conclusion
- Our graph compares nicely with the Doctors graph. Our results are not identical because we do not have a medically accurate instrument with required margins of error; however, the results correlate very well!
Future Improvements?
It is possible that future iterations of Wheezer could also include a parallel measurement using a hot-wire anemometer to cover the low flow range while the venturi covers the upper range. Future iterations of Wheezer will also be able to save the patients data to their phone to track lung strengthening or deterioration over time. The instrument will also be redesigned for greater portability and convenience in maintenance.
Datasheets
SM5812: http://www.mouser.com/ds/2/589/SM5812-254991.pdf
BOM (Build of Materials)
- ($14.95) Adafruit 1.44" Color TFT LCD Display with MicroSD Card breakout: https://www.adafruit.com/product/2088#tutorials
- ($14.95) PowerBoost 500 Basic - 5V USB Boost @ 500mA from 1.8V+: https://www.adafruit.com/product/1944
- ($7.95) Lithium Ion Polymer Battery - 3.7v 500mAh: https://www.adafruit.com/product/1578#tutorials
- Switch: We just found a SPDT switch lying around somewhere
- ($39.95) Arduino 101 Curie: https://www.adafruit.com/product/3033
- ($4.90 (without shipping)) PCB from SEEEDstudio
- ($17.35) Pressure Sensor: http://www.mouser.com/ProductDetail/Silicon-Microstructures-Inc/SM5812-005-A-3-LR/?qs=SaTeGCoDkn3W1sd7OhXrnA%3D%3D