KmeaningfulR
![]()
Have you ever encountered a dataset that seems to have different patterns in it? Have you ever tried to group similar things together in a dataset and to assign a new sample based on your findings?
We created kmeaningfulR to help solve such problems. kmeaningfulR is
a R package that uses the k-means algorithm to find clusters and assign
new data points to them. It also contains functions to help with data
preprocessing, hyperparameter tuning and visualizing clusters.
Installation
You can install the released version of kmeaningfulR from github with
devtools::install_github("UBC-MDS/kmeaningfulR")KmeaningfulR’s Place in the R Ecosystem
There already exist several packages that implement k-means clustering
in R. Most notably there is the stats::kmeans implementation. There
are also several functions for modified versions of k-means available in
the ClusterR package. We are not trying to break new ground with
kmeaningfulR, but rather to build a simple and lightweight
implementation from scratch.
Features
preprocess(X)- Automatic dataset preprocessing: scales numerical featuresfind_elbow(X)- Automatic hyperparameter tuning to select optimal number of clusters,k, according to silhouette scorefit_assign(X, k)- Wrapper function that callsfit(X, k)andassign(X, centres)fit(X, k)- finds centroid location for all of thekclustersassign(X, centres)- assigns each example to a cluster
show_clusters(X, centres)- Visualize clusters according to 2d PCA representation
Dependencies
- R 4.0.3
- cluster 2.1.1
- FactoMineR
- forcats
- dplyr
Usage
library(kmeaningfulR)
#>
#> Attaching package: 'kmeaningfulR'
#> The following object is masked from 'package:base':
#>
#>     assign

# helper data X
X  <- array(c(0, 1, 10, 10, 10, 10, 0, 1, 10, 11, 0, 1), dim = c(6,2))

# scale data
X_scaled <- preprocess(X)

# find optimal number of clusters
optimal_K <- find_elbow(X_scaled)

# find location of cluster centers
centers <- fit(X_scaled, optimal_K)

# assign label of nearest center to every point
labels <- assign(X_scaled,centers)

# plot a 2D PCA visualisation of the points clusters
# show_clusters(X_scaled, labels, centers)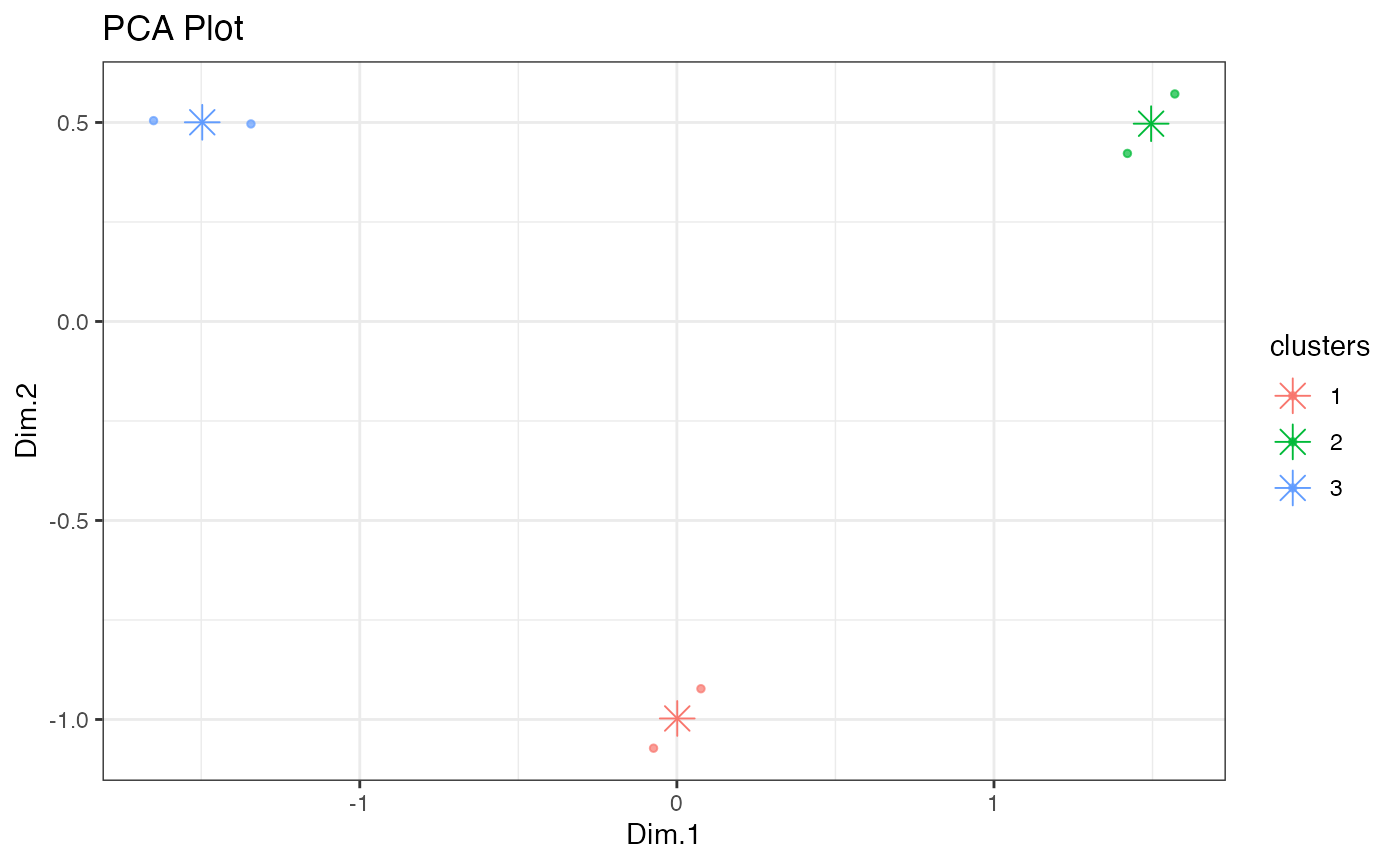
| Task | Function |
|---|---|
| Scale numerical features | preprocess(df) |
| Find list of centroid points | fit(df, 3) |
| Assign new data point to cluster | assign(df, array2d) |
| Find optimal number of cluster | fit_elbow(X) |
| Visualize data coloured by cluster | show_cluster(df, array2d) |
Documentation
The official documentation is hosted here: https://ubc-mds.github.io/kmeaningfulR/
Contributors
This project was created by DSCI 524 Group 16:
- Yihong (Hazel) Jiang
- Mike Lynch
- Trevor Kinsey
- Sasha Babicki
We welcome and recognize all contributions. You can see a list of current contributors in the contributors tab.