
ProtEGOnist is a tool for the visualization of small-world networks. It is a web application that allows users to upload their own networks and visualize them in a target-centered manner. Additionally, several example networks are provided to demonstrate the tool's capabilities, including a protein-protein interaction network and a social network. The tool is designed to be user-friendly and interactive, allowing users to explore their networks simply and intuitively.
Originally developed for the Bio+MedVis Challenge @ IEEE VIS 2023, the aim was to develop a tool for the visualization of protein-protein interaction networks in the context of a large-scale cancer protein-marker study. ProtEGOnist was awarded 1st place in the Bio+MedVis challenge.
ProtEGOnist was then further developed to be a more general tool for the visualization of small-world networks. It was presented at the EuroVis 2024 conference and the accompanying paper is available here.
The tool is developed jointly by the Big Data Visual Analytics group and the Integrative Transcriptomics group at the Institute for Bioinformatics and Medical Informatics at the University of Tübingen.
ProtEGOnist is available as a web application and can be accessed at https://protegonist-tuevis.cs.uni-tuebingen.de.
Concept
ProtEGOnist aims at reducing the visual clutter commonly found in small-world networks by aggregating nodes based on the concept of ego graphs. An ego graph is a subgraph that consists of a central node (the ego) and its neighbors (the alters).

We then construct a network out of these aggregated ego-graphs, where the edges indicate overlap, i.e., the number of alters that two egos have in common. To provide the user with detail on demand, we allow the user to interact with the network by selecting a node and expanding its ego graph. Additionally, up to three expanded ego graphs can be displayed simultaneously---akin to a Venn diagram---allowing the user to compare similarities and differences between the neighborhoods of the selected nodes.
Views
In ProtEGOnist there are several Views that allow the user to explore the network in a target-centered manner.
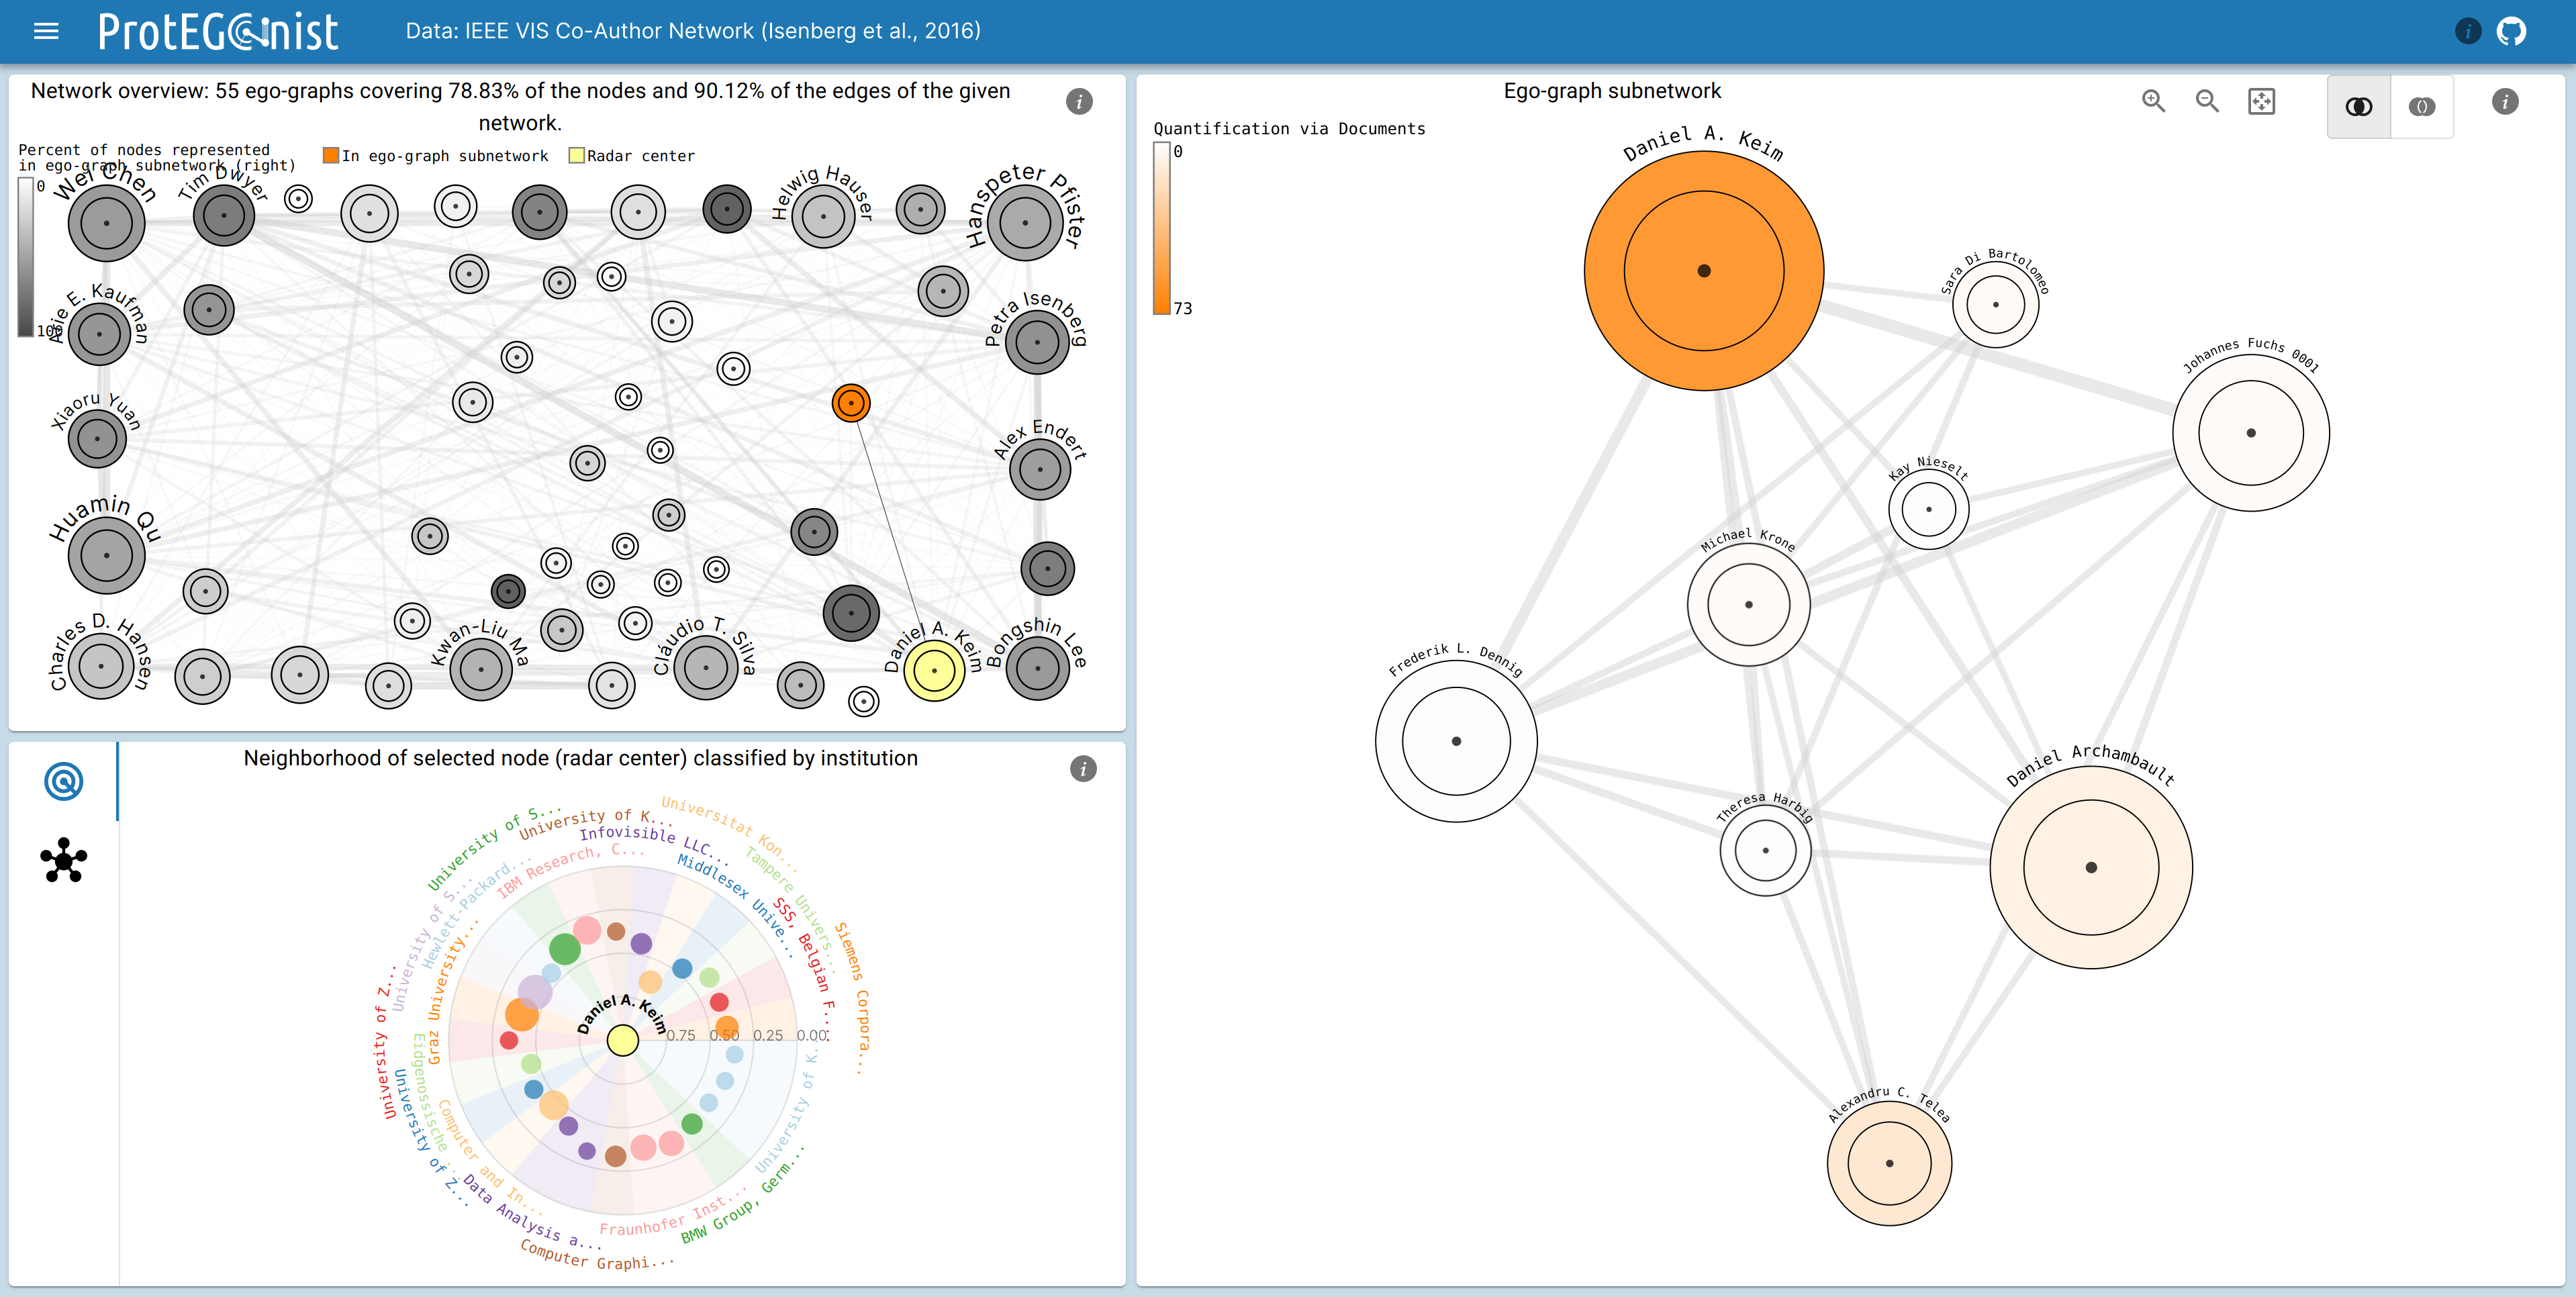
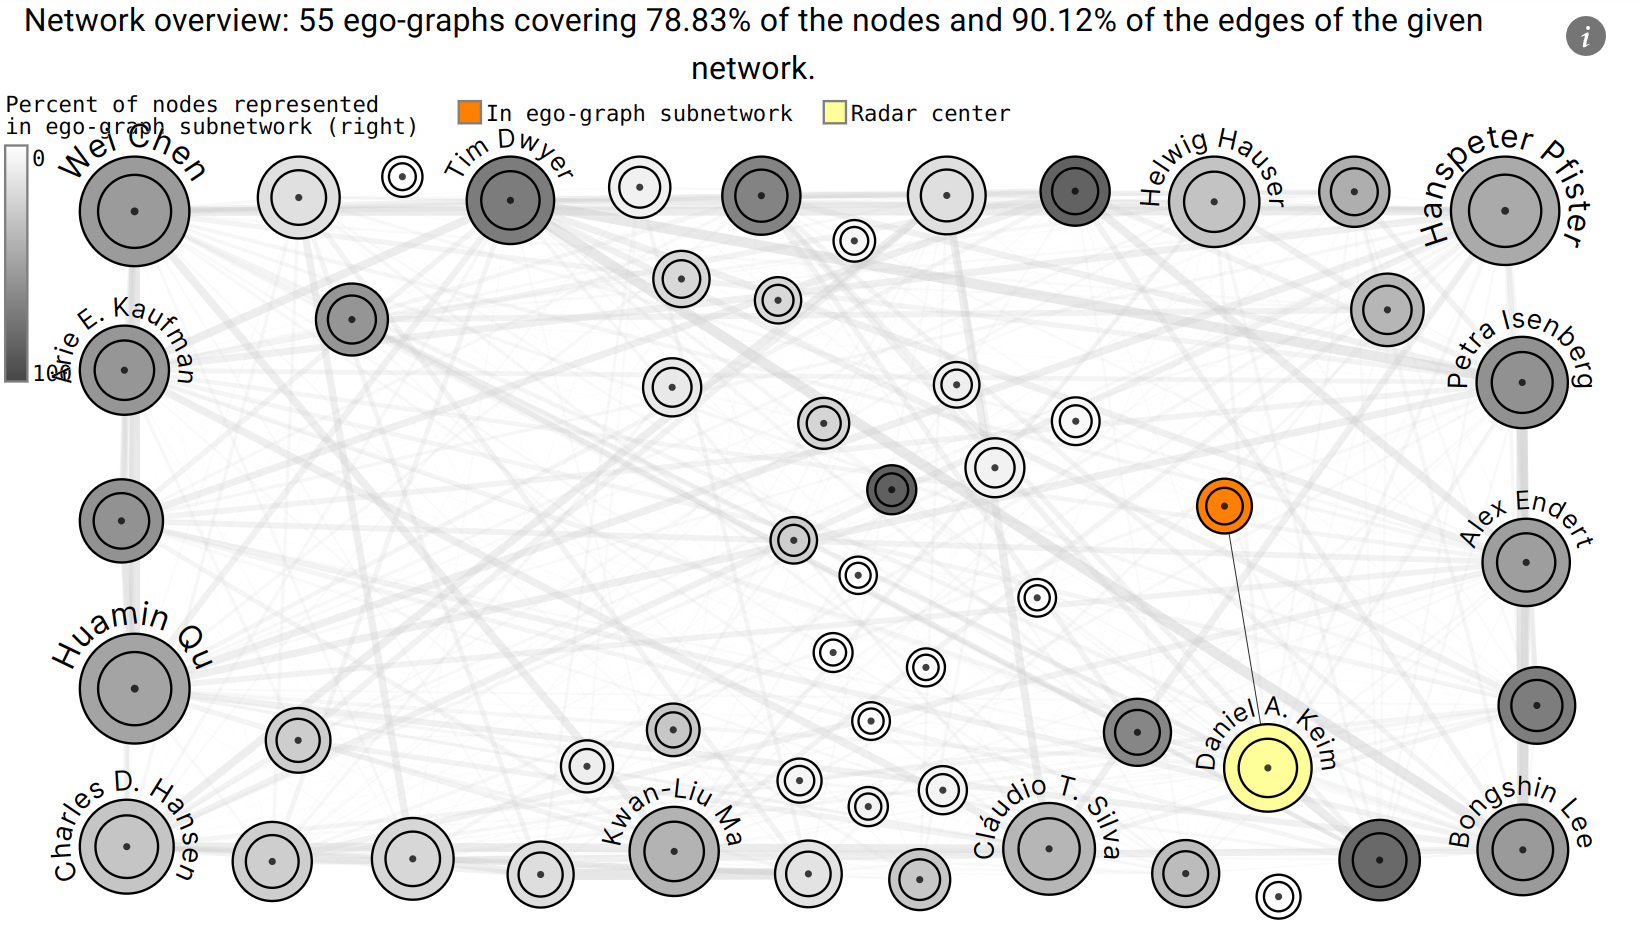
Network Overview
The Network Overview shows the aggregated network, where each node represents an ego graph. Not all nodes are displayed at once, but only the ones that cover the most connections, i.e., the most important nodes with a heuristic algorithm for the set cover problem. The size of the node indicates the number of alters in the ego graph and the edges indicate overlap between ego graphs. The color indicates how many of the contained connections and nodes are present in the Ego-Gpaph Subnetwork.
Ego-Graph Subnetwork
The Ego-Graph Subnetwork shows user-selected ego graphs, either in aggregated form or expanded. The nodes are colored according to the metadata variable, and the edges indicate overlap between the ego graphs. The user can select up to three ego graphs to be displayed as an ego-graph group, meaning three expanded ego-graphs that highlight identical nodes between them.


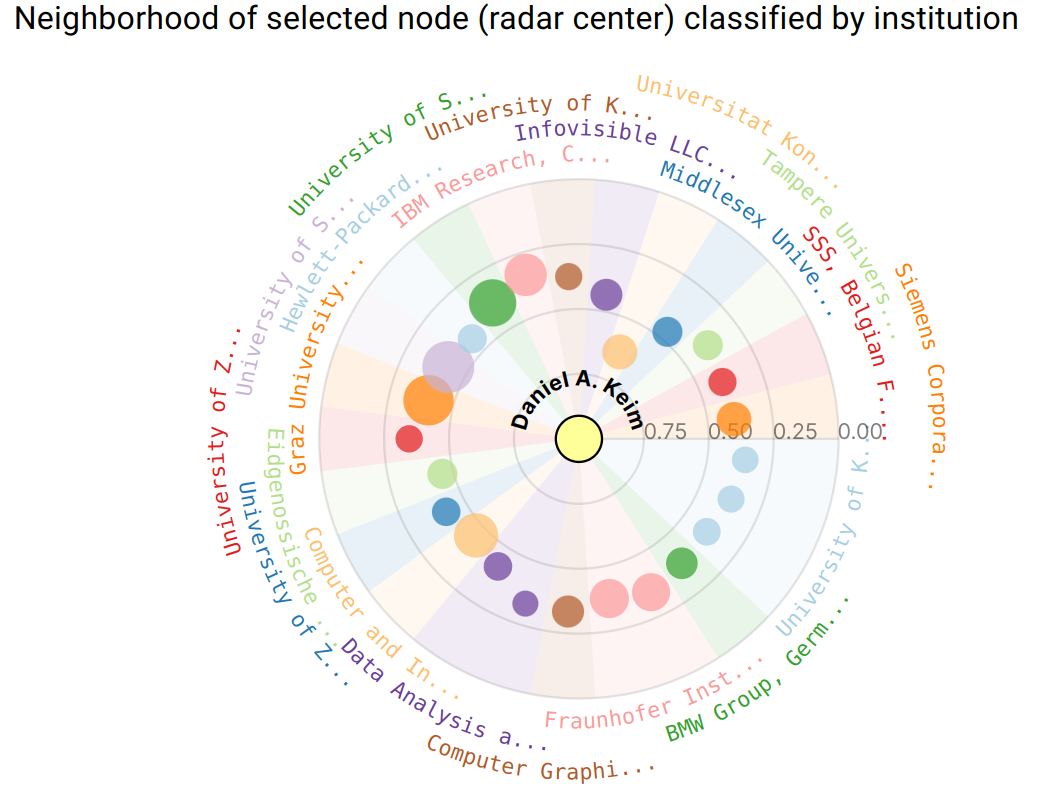
Radar Chart
The Radar chart shows the ego graphs of the whole network that are most similar to the selected ego graph. For this, the Jaccard index of their corresponding neighborhoods is used as a metric. Additionally, a metadata variable can be selected to group the ego graphs.
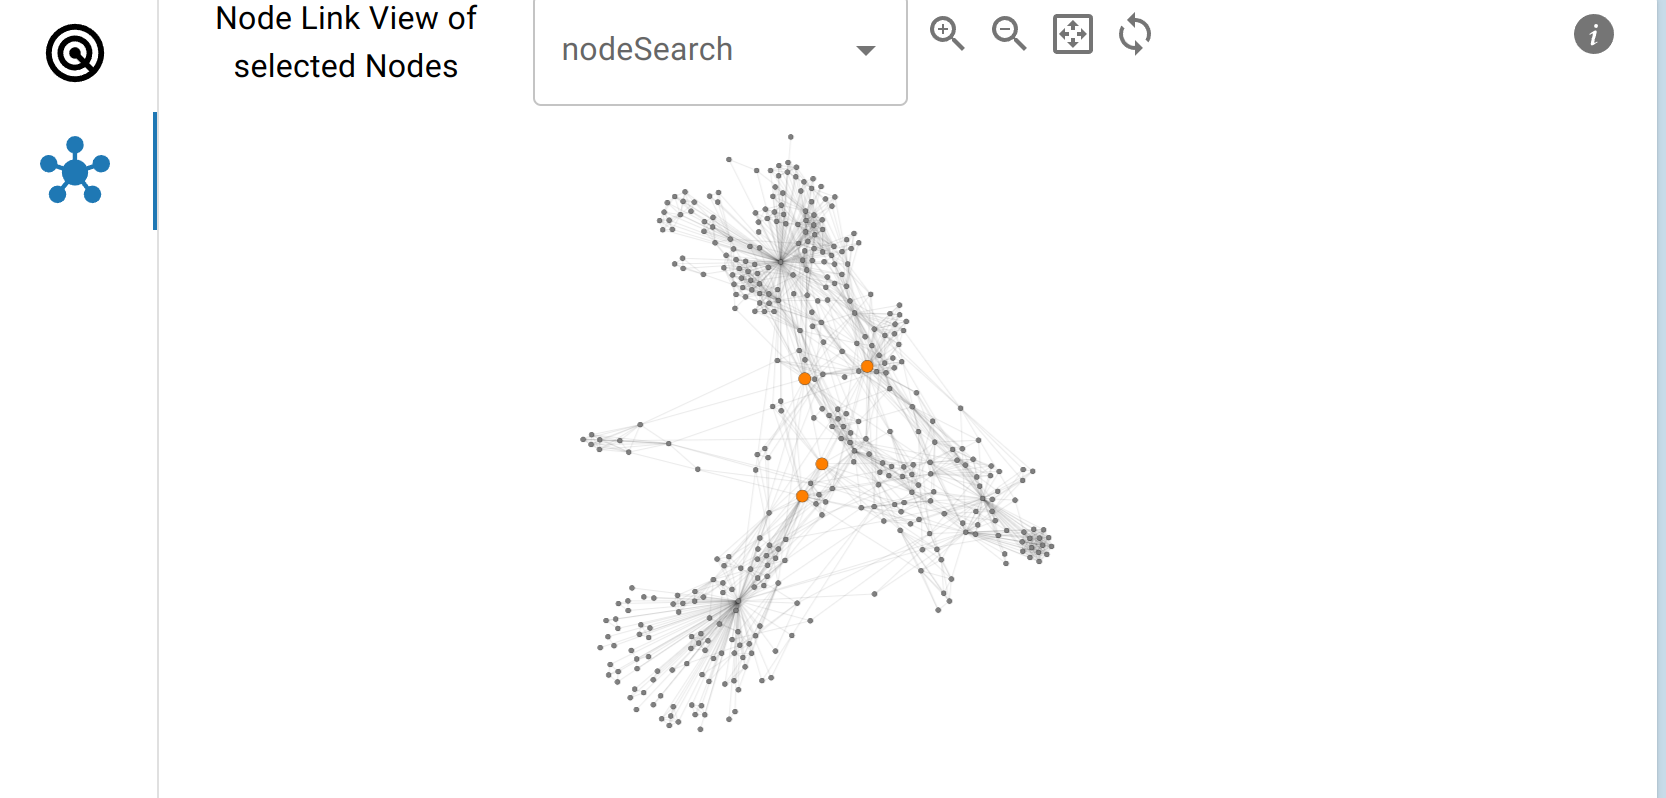
Node Link Diagram
Ego graphs and intersections in the Ego-Graph Subnetwork can be selected to be displayed in a conventional Node Link Diagram, allowing the investigation of topology and connections in the network.
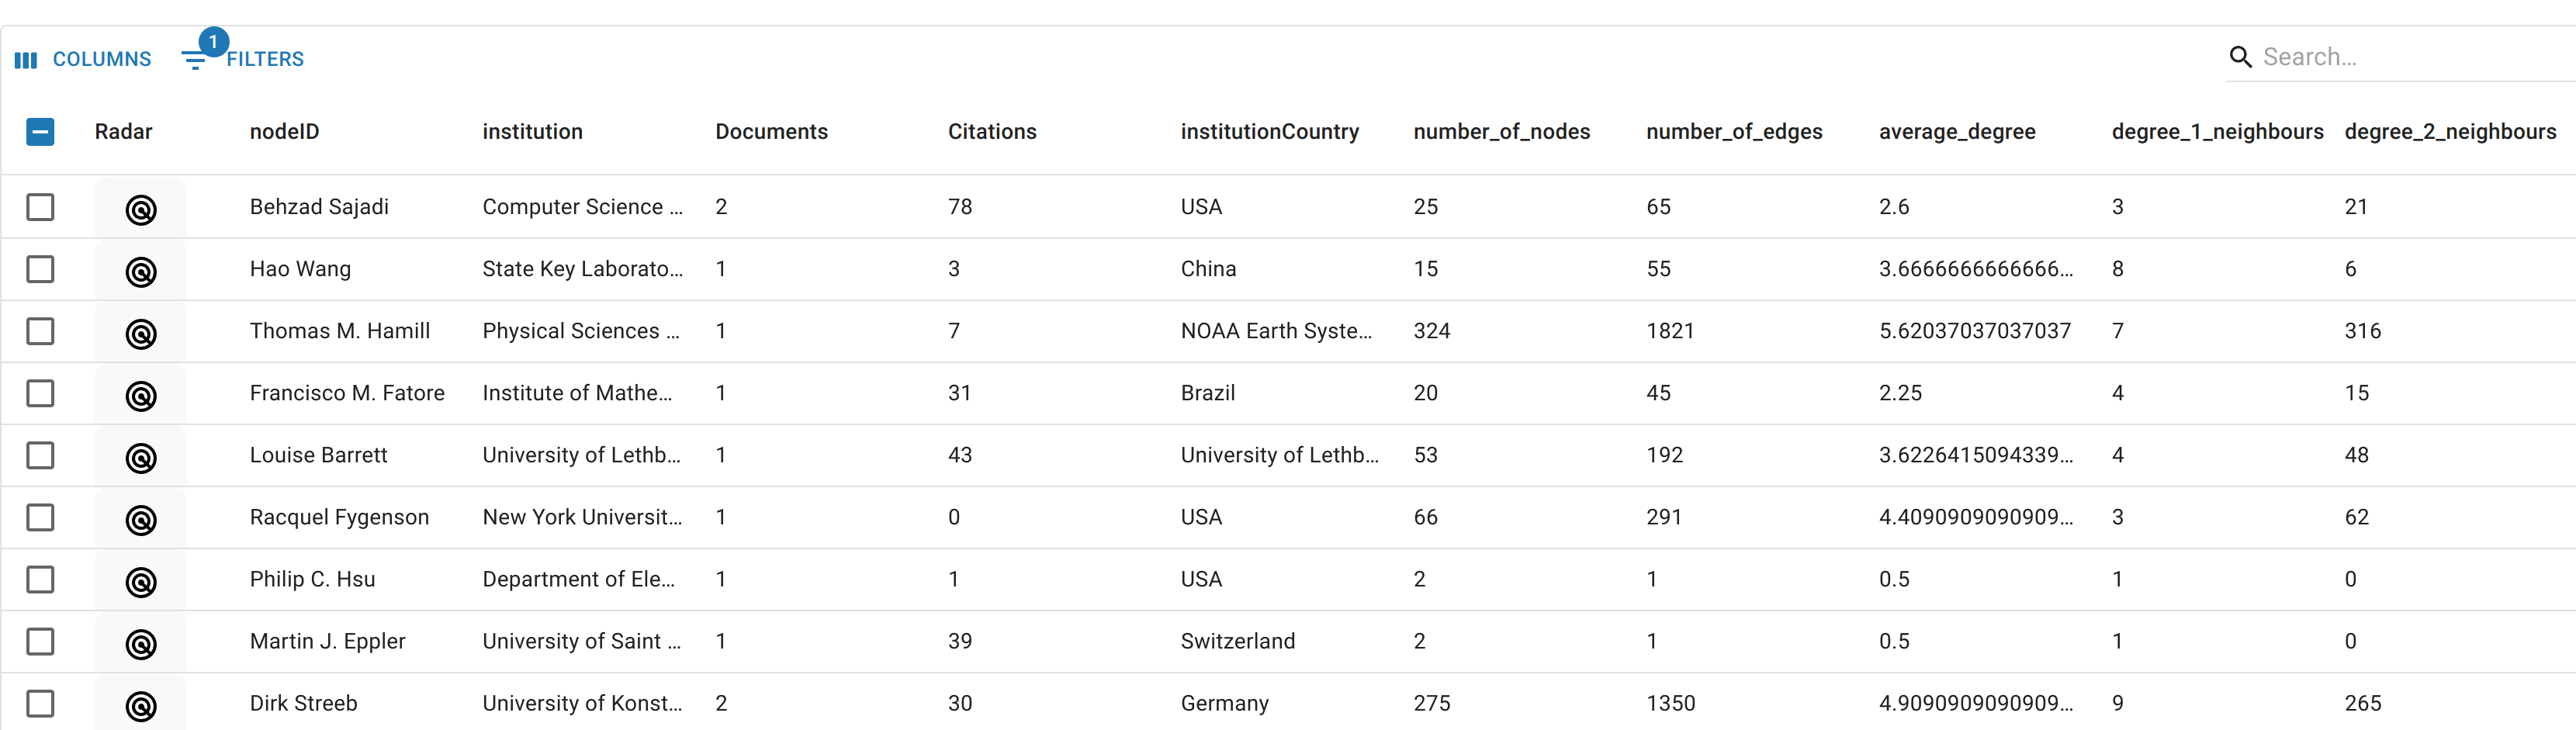
Metadata Table
The Metadata Table shows the metadata of the nodes in the Ego-Graph Subnetwork.
Development
Installation
1) Requirements
- A conda/miniconda/mamba installation, the conda environment will be 3.11
- Node.js (tested with v18.18.0)
2) Installing yarn via Corepack
This project uses yarn as a package manager. To install yarn, you can use Corepack, which is a package manager for package managers.
user@example:~$ npm install -g corepack
user@example:~$ corepack enable
3) Setting up the conda environment
For the tool to work, you need to create a conda environment with the required packages. The environment can be created using the provided requirements.yml file.
cd to the root of the project
user@example:~/path/to/project$ conda env create -f requirements.yml
user@example:~/path/to/project$ conda activate biovischallenge
3) Install required javascript packages
To install the required javascript packages, you can use yarn.
user@example:~/path/to/project$ yarn installRunning the tool
To run the tool, you need to activate the conda environment and run the following command:
(<your-env>) user@example:~$ yarn run dev