- Introduction hyundai_kia_connect_monitor
- How to install python, packages and hyundai_connect_monitor
- configuration of gspread for "python summary.py sheetupdate" and "python dailystats.py sheetupdate"
- Translations
- monitor.py
- summary.py
- summary.py sheetupdate
- dailystats.py
- kml.py
- shrink.py
- debug.py
- check_monitor.py
- monitor_utils.py
- logging_config.ini
- Raspberry pi configuration
- Examples
- Development Environment
- FAQ
Introduction hyundai_kia_connect_monitor
Automatic trip administration tools for Hyundai Bluelink or Kia UVO Connect users. Determining afterwards your private and/or business trips and information about those trips and usage of the car. Best of all is the fact that it does NOT drain your 12 volt battery of the car, because it only uses the cached server information!
Examples of supported cars (including cars with newer ccNC Infotainment):
- Hyundai (Bluelink): Ioniq, IONIQ 5, IONIQ 6, Kona
- Kia (Connect): EV6, EV9, Niro, Soul
Here a video with some nice diagrams in Google Spreadsheet, showing:
Daily Statistics:
- Total
- Recuperation
- Consumption
- Engine
- Climate
- Electric devices
- Battery Care
Trip information:
- Totals
- Trip Start Time
- Trip End Time
- Matched consumption or distance figures from summary.py between round brackets
- Distance
- Average speed
- Maximum speed
- Idle minutes

This video shows why it is important to avoid awakening the car for actual values.

30 nov 6:10 a refresh via the Bluelink App has been done and you see a dip from 12.92 Volt to 12.42 Volt for a moment and then back to 12.83 Volt.
Note the tool asks only for server cache updates and the car decides when to send push notifications with actual values to the server.
Example screenshots showing the results in a Google Spreadsheet:
-
DailyStats
-
DailyStats in browser with nice diagrams
-
Summary
Run monitor.py e.g. once per hour or infinite (I use it on a Raspberry Pi and on Windows 10 with pure Python, but it will also run on Mac or a linux Operating System) and you can always check afterwards:
- captured locations
- odometer at specific day/hour
- how much driven at a specific day
- how much battery% used at a specific day (for BEV or HEV users)
- where you have been at a specific day/hour
- when you have charged and how much
- see your 12 volt battery percentage fluctuation
- EV range
- daily statistics from the car (Europe only)
- trip info information from the car (Europe only)
You can analyze the information over time with other scripts or e.g. with Excel:
- summaries (see summary.py script)
- daily statistics (see dailstats.py script)
- odometer trend over the lifetime
- SOC trend and charging trend
- 12V battery fluctuations
The following tools are available as pure Python3 scripts:
- monitor.py: Simple Python3 script to monitor values using hyundai_kia_connect_api
- summary.py: make summary per TRIP, DAY, WEEK, MONTH, YEAR with monitor.csv as input
- dailystats.py: represent the gathered daily statistics and trip info in a nice formatted text, including computed totals.
- kml.py: transform the monitor.csv data to monitor.kml, so you can use it in e.g. Google My Maps to see on a map the captured locations
- shrink.py: Simple Python3 script to shrink monitor.csv, identical lines removed (first date/time column excluded)
- debug.py: same sort of python script as monitor.py, but debug logging enabled and all the (internal) data is just printed to standard output in pretty print
- Raspberry pi configuration: example script to run the scripts on a linux based system
How to install python, packages and hyundai_connect_monitor
Explanation for someone with no knowledge of python. I don't know what computer you have. Part of the tools is the regular retrieval of the data with the Python script monitor.py. For this you need to install Python 3.9 or higher. I have installed Python 3.9.13. Here is more information about installing Python
Steps:
- Download the latest release source code of hyundai_kia_connect_api here
- Download the latest hyundai_kia_connect_monitor release here
- Extract both and move the hyundai_kia_connect_api subfolder of hyundai_kia_connect_api-[version] underneath hyundai_kia_connect_monitor.
- Then configure monitor.cfg
- Then run: python monitor.py
Probably some packages needed for Hyundai Connect API are not installed (error messages). Learn more about installing Python packages I have installed the following packages (e.g. use python -m pip install "package_name"), see requirements.txt
beautifulsoup4==4.11.1
python_dateutil==2.8.2
pytz==2022.2.1
requests==2.28.1
In hyundai_kia_connect_monitor summary.py and dailystats.py also the following packages are used:
gspread==5.6.2If everything works, it's a matter of regularly collecting the information, for example by running the "python monitor.py" command once an hour or infinite. A server is of course best, I use a Raspberry Pi, but it can also regularly be done on a Windows 10 or Mac computer, provided the computer is on.
Note: each time you run monitor.py it makes a snapshot of the latest server cache values. How more often you run it, the better charges and trips can be detected by summary.py. The easiest way is to run monitor.py infinite.
configuration of gspread for "python summary.py sheetupdate" and "python dailystats.py sheetupdate"
For updating a Google Spreadsheet, summary.py and dailystats.py are using the package gspread. For Authentication with Google Spreadsheet you have to configure authentication for gspread. This authentication configuration is described here
The summary.py and dailystats.py script uses access to the Google spreadsheets on behalf of a bot account using Service Account.
Follow the steps in this link above, here is the summary of these steps:
- Enable API Access for a Project
- Head to Google Developers Console and create a new project (or select the one you already have).
- In the box labeled "Search for APIs and Services", search for "Google Drive API" and enable it.
- In the box labeled "Search for APIs and Services", search for "Google Sheets API" and enable it
- For Bots: Using Service Account
- Go to "APIs & Services > Credentials" and choose "Create credentials > Service account key".
- Fill out the form
- Click "Create" and "Done".
- Press "Manage service accounts" above Service Accounts.
- Press on : near recently created service account and select "Manage keys" and then click on "ADD KEY > Create new key".
- Select JSON key type and press "Create".
- You will automatically download a JSON file with credentials
- Remember the path to the downloaded credentials json file. Also, in the next step you will need the value of client_email from this file.
- Move the downloaded json file to ~/.config/gspread/service_account.json. Windows users should put this file to %APPDATA%\gspread\service_account.json.
- Setup a Google Spreasheet to be updated by sheetupdate
- In Google Spreadsheet, create an empty Google Spreadsheet with the name: hyundai-kia-connect-monitor or monitor.VIN (latter if vin=VIN is given as parameter)
- Go to your spreadsheet and share it with the client_email from the step above (inside service_account.json)
- In Google Spreadsheet, create an empty Google Spreadsheet with the name: monitor.dailystats or monitor.dailystats.VIN (latter if vin=VIN is given as parameter). If you want nice diagrams, you can copy this example Google spreadsheet and change e.g. diagram titles into your own language.
- Go to your spreadsheet and share it with the client_email from the step above (inside service_account.json).
- How to share a Google Spreadsheet:
- Open the Sheet you want to share (that you own or have edit access to).
- Click Share.
- Enter the client_email address as mentioned inside service_account.json.
- Choose kind of access: Editor.
- Click Send.
- run "python summary.py sheetupdate" and if everything is correct, the hyundai-kia-connect-monitor or monitor.VIN spreadheet will be updated with a summary and the last 122 lines of standard output
- run "python dailystats.py sheetupdate" and if everything is correct, the monitor.dailystats or monitor.dailystats.VIN spreadheet will be updated with the last 122 lines of standard output
- configure to run "python summary.py sheetupdate" regularly, after having run "python monitor.py"
- configure to run "python dailystats.py sheetupdate" regularly, after having run "python summary.py sheetupdate"
Translations
There are translations available for the following tools (only the standard output and sheetupdate, not the other generated csv files):
- dailystats.py
- summary.py
Remarks:
- The configured language in monitor.cfg is used for the translations, see monitor.cfg in monitor.py.
- Translations are inside monitor.translations.xlsx for easier Unicode editing and are saved in monitor.translations.csv as comma separated csv file in UTF-8 format, so unicode characters are preserved.
- All the supported languages have been translated with Google Translate and German is checked/corrected by a goingelectric.de user (thanks)
- Polish, Czech, Slovak, Hungarian are not translated, feel free to provide translations for those languages
- If (some) translations are not correct, please submit an issue with the proposed corrections, but be careful to provide them as unicode text, preferably using monitor.translations.xlsx
monitor.py
Simple Python3 script to monitor values using hyundai_kia_connect_api
Usage:
python monitor.pyINPUTFILE:
- monitor.cfg (configuration of input to hyundai_kia_connect_api)
OUTPUTFILES:
- monitor.csv (appended when the last line is different) or monitor.VIN.csv (latter when multiple vehicles found)
- monitor.dailystats.csv (appended with daily stats) or monitor.dailystats.VIN.csv (latter when multiple vehicles found)
- monitor.tripinfo.csv (appended with trip info) or monitor.tripinfo.VIN.csv
- monitor.lastrun or monitor.VIN.lastrun (rewritten with last run date/time of monitor.py and other vehicle data)
Note: dailystats and tripinfo are only available in Europe.
Make sure to configure monitor.cfg once:
[monitor]
region = 1
brand = 2
username = your_email
password = your_password
pin =
use_geocode = True
use_geocode_email = True
language = en
odometer_metric = km
include_regenerate_in_consumption = False
consumption_efficiency_factor_dailystats = 1.0
consumption_efficiency_factor_summary = 1.0
monitor_infinite = False
monitor_infinite_interval_minutes = 60
monitor_execute_commands_when_something_written_or_error =
Explanation of the configuration items:
- region: 1: REGION_EUROPE, 2: REGION_CANADA, 3: REGION_USA
- brand: 1: BRAND_KIA, 2: BRAND_HYUNDAI
- username: your bluelink account email address
- password: password of your bluelink account
- pin: pincode of your bluelink account, required for CANADA, and potentially USA, otherwise pass a blank string
- use_geocode: (default: True) find address with the longitude/latitude for each entry
- use_geocode_email: (default: True) use email to avoid abuse of address lookup
- language: (default: en) the Bluelink App is reset to English for users who have set another language in the Bluelink App in Europe when using hyundai_kia_connect_api, you can configure another language as workaround. See Note 3
- odometer_metric, e.g. km or mi
- include_regenerate_in_consumption, when set to True the regeneration is taken into account for the consumption calculation in daily stats. However, I think that the next 2 configuration items will better match the boardcomputer values.
- consumption_efficiency_factor_dailystats, see Note 2
- consumption_efficiency_factor_summary, see Note 2
- monitor_infinite, if set to True monitor.py keeps running using monitor_infinite_interval_minutes between getting cached server values
- monitor_infinite_interval_minutes, interval in minutes between getting cached server values
- monitor_execute_commands_when_something_written_or_error, when new cached server values are retrieved, the specified commands (separated by semicolon ;) are executed. See Note 1.
- example: monitor_execute_commands_when_something_written_or_error = python -u summary.py sheetupdate > summary.log;python -u dailystats.py sheetupdate > dailystats.log
Note 1: in combination with infinite (monitor_infinite = True) summary.py and dailystats.py are only run when something is changed or error occurred (or once a day). You do not need to run summary.py and dailystats.py separately and it is only run when it is needed.
Note 2: I think that the consumption values of the on-board computer are corrected with an efficiency number, e.g. 1 kWh of energy results in 0.9 kWh of real energy (losses when converting battery kWh by the car). So therefor I introduced an efficiency configuration factor in monitor.cfg, consumption_efficiency_factor_dailystats and consumption_efficiency_factor_summary. For example, when setting this to 0.9, 10% of the energy is lost during the conversion and is used in the consumption calculation. Default the values are 1.0, so no correction.
Note 3: language is only implemented for Europe currently.
For a list of language codes, see here.. Currently in Europe the Bluelink App shows the following languages:
- "en" English
- "de" German
- "fr" French
- "it" Italian
- "es" Spanish
- "sv" Swedish
- "nl" Dutch
- "no" Norwegian
- "cs" Czech
- "sk" Slovak
- "hu" Hungarian
- "da" Danish
- "pl" Polish
- "fi" Finnish
- "pt" Portuguese
Following information from hyundai_kia_connect_api is added to the monitor.csv file:
- datetime
- longitude
- latitude
- engineOn
- 12V%
- odometer
- SOC%
- charging
- plugged
- address (dependent on use_geocode configuration)
- EV range
Following information from hyundai_kia_connect_api is added to the monitor.dailystats.csv file (gathered by the car, so not computed by summary.py), with per day the following information (only available for Europe):
- date
- distance
- distance unit (km or miles)
- total consumed (Wh)
- regenerated energy (Wh)
- engine consumption (Wh)
- climate consumption (Wh)
- onboard electronics consumption (Wh)
- battery care consumption (Wh)
Following information from hyundai_kia_connect_api is added to the monitor.tripinfo.csv file (gathered by the car, so not computed by summary.py), with per trip the following information (only available for Europe):
- Date
- Start time
- Drive time
- Idle time
- Distance
- Average speed
- Maximum speed
This information is used by the other tools:
- summary.py
- dailystats.py (only available for Europe)
- kml.py
- shrink.py
The monitor.py tool will by never do a forced update and only asks for cached server values, so the 12 volt battery is NOT drained by the tool. Note that if you do a lot of refresh calls by Hyundai Bluelink or Kia Connect App, than definitely the car 12 volt battery can be drained. See here some results of someone with an IONIQ 5 using refresh, so use refresh carefully:
With 15-minute refreshed:
95% to 80% in 8 hours, approx. 1.8%/hour

With 60-minute refreshed:
93% to 82% in 14 hours, approx. 0.78%/hour
Therefor it is chosen to make it not possible to do a forcerefresh via the monitor tools (earlier versions of monitor had this non-default possibility).
Note that the number of API calls is restricted for Hyundai Bluelink or Kia UVO Connect users, see this page for API Rate Limits
Region Daily Limits    Per Action  Comments
- USA  30              10
- CA   TBD             TBD         You must wait 90 seconds before vehicle commands
- EU   200
- KR   ???
Note that a Bluelink USA user has detected that there is a limit in the number of logins, not for the subsequent calls, therefore the option to run monitor.py infinite is a good choice. The monitor.py infinite does only login once per day and then the subsequent calls are done with the retrieved information. Unfortunately for Europe the total is restricted to about 200, so the number of logins does not matter. For the other regions I do not know the limit and behavior.
So maybe you can capture more than once per hour, but you might run into the problem that you use too much API calls, especially when you also regularly use the Hyndai Bluelink or Kia UVO Connect app. You also can consider only to monitor between e.g. 6:00 and 22:00 (saves 1/3 of the calls). Dependent on your regular driving habit, choose the best option for you. Examples:
- run monitor.py infinite (monitor_infinite = True) with monitor_infinite_interval_minutes = 15 (means 96 requests per day and 1 login per day)
- twice a day, e.g. 6.00 and 21:00, when you normally do not drive that late in the evening and charge in the night after 21:00
- each hour means 24 requests per day
- each hour between 6:00 and 19:00 means 13 requests per day
- each hour between 6:00 and 22:00 means 16 requests per day
- each half hour means 48 requests per day
- each half hour between 6:00 and 19:00 means 26 requests per day
- each half hour between 6:00 and 22:00 means 32 requests per day
- each quarter hour means 96 requests per day
- each quarter hour between 6:00 and 19:00 means 52 requests per day
- each quarter hour between 6:00 and 22:00 means 64 requests per day
summary.py
make summary per TRIP, DAY, WEEK, MONTH, YEAR or a combination with monitor.csv as input or monitor.VIN.csv (latter if vin=VIN is given as parameter)
Usage:
python summary.py
or
python summary.py vin=VIN
or
python summary.py -trip
or
python summary.py day
or
python summary.py trip
or
python summary.py trip day
or
python summary.py week
or
python summary.py month
or
python summary.py year
INPUT:
- summary.cfg (see below)
- monitor.csv or monitor.VIN.csv (latter if vin=VIN is given as parameter)
OUTPUT:
- standard output: summary per TRIP, DAY, WEEK, MONTH, YEAR in csv format, default all summaries when no parameters given
- summary.charged.csv or summary.charged.VIN.csv, showing per day "date, odometer, +kWh, end of charge SOC%", can be used by other tools. Is also used by dailystats.py
- summary.trip.csv or summary.trip.VIN.csv, showing per trip "date, odometer, distance, -kWh, +kWh"
- summary.day.csv or summary.day.VIN.csv, showing per day "date, odometer, distance, -kWh, +kWh"
Notes:
- add trip, day, week, month, year or -trip or a combination as parameter, which respectively only shows lines for TRIP, DAY, WEEK, MONTH, YEAR or all without TRIP or a combination
- the summary is done in one go, keeping track of TRIP, DAY, WEEK, MONTH and YEAR totals
- the summary is based on the captured data, so in fact there might be e.g. charges or drives missed or consumption for trips is inaccurate
Example configuration of summary.cfg:
[summary]
net_battery_size_kwh = 70.0
average_cost_per_kwh = 0.246
cost_currency = Euro
min_consumption_discharge_kwh = 1.5
ignore_small_positive_delta_soc = 2
ignore_small_negative_delta_soc = -2
show_zero_values = False
Explanation of configuration items:
- net_battery_size_kwh, I have an IONIQ 5 Project 45 with 72.6 kWh battery and 3.5% buffer, so net 70 kWh
- average_cost_per_kwh, currently the kWh prices are higher in the Netherlands, but I have also solar panels for home charging
- cost_currency, e.g. Euro or Dollar
- min_consumption_discharge_kwh, do not show consumption figures when the discharge in kWh is below this number
- ignore_small_positive_delta_soc, do not see this as charge% when not charging/moved, because with temperature changes the percentage can increase
- ignore_small_negative_delta_soc, do not see this as discharge% when not moved, because with temperature changes the percentage can decrease
- show_zero_values = True shows also zero values in the standard output, can be easier for spreadsheets, but more difficult to read
summary.py sheetupdate
make summary per TRIP, DAY, WEEK, MONTH, YEAR with monitor.csv as input and write summary to Google Spreadsheet
Usage:
python summary.py sheetupdate
or
python summary.py sheetupdate -trip
or
python summary.py sheetupdate vin=VIN
For sheetupdate configure once gspread and a specific Google Spreadsheet:
- See configuration of gspread here
- In Google Spreadsheet, create an empty Google Spreadsheet with the name: hyundai_kia_connect_monitor or monitor.VIN (latter if vin=VIN is given as parameter)
- Go to your spreadsheet and share it with the client_email inside service_account.json created above
INPUT:
- summary.cfg (see above)
- monitor.csv or or monitor.VIN.csv (latter if vin=VIN is given as parameter)
OUTPUT:
- standard output: summary per TRIP, DAY, WEEK, MONTH, YEAR in csv format
- summary.charged.csv or summary.charged.VIN.csv, showing detected sharges per day "date, odometer, +kWh, end of charge SOC%", can be used by other tools. Is also used by dailystats.py
- summary.trip.csv or summary.trip.VIN.csv, showing per detected trip "date, odometer, distance, -kWh, +kWh", can be used by other tools. Is also used by dailystats.py
- Google spreadsheet update with name: hyundai-kia-connect-monitor or monitor.VIN or (latter if vin=VIN is given as parameter)
For easier use on a mobile phone, the spreadsheet will contain first the overall information in the first number of rows:
- Last run
- last update at datetime
- location last updated at datetime
- Last entry
- Last address
- Odometer km
- Driven km
- +kWh
- -kWh
- km/kWh
- kWh/100km
- Cost Euro
- Current SOC%
- Average SOC%
- Min SOC%
- Max SOC%
- Current 12V%
- Average 12V%
- Min 12V%
- Max 12V%
-
Charges
-
Trips
- EV range
And thereafter the last 122 lines of the summary in reverse order, so you do not need to scroll to the bottom for the latest values. The following columns per row:
Period date info odometer delta km +kWh -kWh km/kWh kWh/100km cost Euro SOC%CUR AVG MIN MAX 12V%CUR AVG MIN MAX #charges #trips EV range addressdailystats.py
Read the daily stats, trip info and charge files and represent these in a nice formatted text, including computed totals.
Note dailystats and tripinfo from hyundai_kia_connect_api is currently only available for Europe
Note summary input information is represented using round brackets, examples: (+33.6kWh) or (11.2kWh) or (4.1km/kWh), because the other information is probably more accurate
For sheetupdate configure once gspread and a specific Google Spreadsheet:
- See configuration of gspread here
- In Google Spreadsheet, create an empty Google Spreadsheet with the name: monitor.dailystats or monitor.dailystats.VIN (latter if if vin=VIN is given as parameter). If you want nice diagrams, you can copy this example Google spreadsheet and e.g. change diagram titles into your own language.
- Go to your spreadsheet and share it with the client_email inside service_account.json created above
Usage:
python dailystats.py
or
python dailystats.py sheetupdate
or
python dailystats.py vin=VIN
or
python dailystats.py vin=VIN sheetupdate
INPUT:
- monitor.dailystats.csv or monitor.dailystats.VIN.csv (latter if vin=VIN is given as parameter)
- monitor.tripinfo.csv or monitor.tripinfo.VIN.csv
- summary.charge.csv or summary.charge.VIN.csv
- summary.trip.csv or summary.trip.VIN.csv
- summary.day.csv or summary.day.VIN.csv
OUTPUT:
- standard output: totals, daily and tripinfo statistics in a nice formatted text, including charge information using summary.charge.csv
- Google spreadsheet update with name: monitor.dailystats or monitor.dailystats.VIN or (latter if vin=VIN is given as parameter)
kml.py
Transform the monitor.csv data to monitor.kml, so you can use it in e.g. Google My Maps to see on a map the captured locations. Lines are not written, when the following info is the same as previous line: longitude, latitude, engineOn, charging
Usage:
python kml.py
or
python kml.py vin=VIN
INPUT:
- monitor.csv or monitor.VIN.csv (latter if vin=VIN as parameter given)
OUTPUT:
- standard output: summary per kml placemark
- monitor.kml or monitor.VIN.kml (latter if vin=VIN as parameter given)
The following information is written in the kml file:
- document name: monitor + now in format "yyyymmdd hh:mm"
- per placemark
- name of place (index of Google Maps): datetime in format "yyyymmdd hh:mm" and optionally "C" when charging and "D" when in drive
- description: SOC: nn% 12V: nn% ODO: odometer [(+distance since yyyymmdd hh:mm)] [drive] [charging] [plugged: n]
- coordinate (longitude, latitude)
Note:
- the placemark lines are one-liners, so you can also search in monitor.kml
How to import kml in Google Maps
shrink.py
Simple Python3 script to shrink monitor.csv, identical lines removed (first date/time column excluded). Handy for analyzing with other tools (e.g. Excel) with less data. Later versions of monitor.py do only append data when the data is different, so less need for this tool.
Usage:
python shrink.py
or
python shrink.py vin=VIN- INPUTFILE: monitor.csv or monitor.VIN.csv (latter if vin=VIN as parameter given)
- OUTPUTFILE: shrinked_monitor.csv or shrinked_monitor.VIN.csv (latter if vin=VIN as parameter given)
debug.py
Same sort of python script as monitor.py, but debug logging enabled and all the (internal) data is just printed to standard output in pretty print. It uses the configuration from monitor.cfg.
Usage:
python debug.py- INPUTFILE: monitor.cfg (configuration of input to hyundai_kia_connect_api)
- standard output: debug output and pretty print of the data got from API calls
check_monitor.py
Python script for testing: print when the odometer between two monitor.csv entries are the same, but the next SOC is lower. Also compute if delta time is within 20 minutes.
monitor_utils.py
Generic utility methods, used by the other python scripts.
logging_config.ini
Configuration of default logging and formatting of logging.
Raspberry pi configuration
Examples of running on Raspberry Pi or a linux based system.
There are 2 different options to run monitor.py. Run infinitely or only once. The first one is more efficient, because then only summary.py and dailystats.py are run when there is new cached server data received. Also running infinitely does a login once per day, which is also more efficient and for Bluelink USA the rate limit is not restricted.
Running monitor.py infinitely and only running summary.py and dailystats.py when there is new cached server data received
Example script run_monitor_infinite.sh to run monitor.py infinitely
Steps:
- create a directory hyundai_kia_connect_monitor in your home directory
- copy hyundai_kia_connect_api as subdirectory of directory hyundai_kia_connect_monitor
- copy run_monitor_infinite.sh, monitor.py, monitor.cfg, monitor.translations.csv, monitor_utils.py, summary.py, summary.cfg, dailystats.py and logging_config.ini
- change inside monitor.cfg the appropriate hyundai_kia_connect settings, e.g. monitor_infinite = True and monitor_execute_commands_when_something_written_or_error = /usr/bin/python -u ~/hyundai_kia_connect_monitor/summary.py sheetupdate > summary.log;/usr/bin/python -u ~/hyundai_kia_connect_monitor/dailystats.py sheetupdate > dailystats.log
- chmod +x run_monitor_infinite.sh
Add to your crontab to run once per hour to restart after crashes or reboot (crontab -e)
9 * * * * ~/hyundai_kia_connect_monitor/run_monitor_infinite.sh >> ~/hyundai_kia_connect_monitor/crontab_run_monitor_infinite.log 2>&1
@reboot sleep 125 && ~/hyundai_kia_connect_monitor/run_monitor_infinite.sh >> ~/hyundai_kia_connect_monitor/crontab_run_monitor_infinite.log 2>&1
Note: there is a limit in the number of request per country, but 1 request per hour should not hamper using the Bluelink or UVO Connect App at the same time
Running monitor.py once
Example script run_monitor_once.sh to run monitor.py once on a linux based system.
Steps:
- create a directory hyundai_kia_connect_monitor in your home directory
- copy hyundai_kia_connect_api as subdirectory of directory hyundai_kia_connect_monitor
- copy run_monitor_once.sh, monitor.py, monitor.cfg, monitor.translations.csv, monitor_utils.py and logging_config.ini in the hyundai_kia_connect_monitor directory
- change inside monitor.cfg the appropriate hyundai_kia_connect settings, e.g. monitor_infinite = False and monitor_execute_commands_when_something_written_or_error =
- chmod +x run_monitor_once.sh
Add the following line in your crontab -e to run it once per hour (crontab -e):
0 * * * * ~/hyundai_kia_connect_monitor/run_monitor_once.sh >> ~/hyundai_kia_connect_monitor/run_monitor_once.log 2>&1Add the following line in your crontab -e to run it every 15 minutes between 6 and 22 hour (crontab -e):
*/15 6-21 * * * ~/hyundai_kia_connect_monitor/run_monitor_once.sh >> ~/hyundai_kia_connect_monitor/run_monitor_once.log 2>&1Note: there is a limit in the number of request per country, but 1 request per hour should not hamper using the Bluelink or UVO Connect App at the same time
follow the last content of monitor.csv or run_monitor_infinite.log
There is another python tool to follow the content of a file on a server and send it to a Google Sheet with the same filename. See tail2GoogleSheet.
Another example is tail_run_monitor_infinite.log.sh which is following ~/hyundai_kia_connect_monitor/run_monitor_infinite.log
Examples
I show here rather short examples, but of course when more information is gathered, how more useful the tools are. The examples are anonymized data gathered from my IONIQ 5 from 2023-01-14 till 2023-01-18.
monitor.csv
Example output file monitor.csv
datetime, longitude, latitude, engineOn, 12V%, odometer, SOC%, charging, plugged, address, EV range
2023-01-13 09:04:04+01:00, 6.401608, 51.934742, False, 85, 22162.2, 60, False, 0, 7;Kwakstraat; Duckstad; Nederland; 7054; AN, 221
2023-01-13 10:12:13+01:00, 6.401561, 51.934731, False, 85, 22163.4, 60, False, 0, 9;Kwakstraat; Duckstad; Nederland; 7054; AN, 221
2023-01-13 10:15:25+01:00, 6.401561, 51.934731, False, 85, 22163.4, 58, False, 0, 9;Kwakstraat; Duckstad; Nederland; 7054; AN, 223
2023-01-13 13:01:22+01:00, 6.401561, 51.934731, True, 86, 22163.4, 58, False, 0, 9;Kwakstraat; Duckstad; Nederland; 7054; AN, 223
2023-01-13 13:16:22+01:00, 6.401561, 51.934731, True, 87, 22163.4, 58, False, 0, 9;Kwakstraat; Duckstad; Nederland; 7054; AN, 222
2023-01-13 13:31:23+01:00, 6.401561, 51.934731, True, 88, 22163.4, 58, False, 0, 9;Kwakstraat; Duckstad; Nederland; 7054; AN, 222
2023-01-13 13:50:26+01:00, 6.401561, 51.934731, False, 89, 22163.4, 58, False, 0, 9;Kwakstraat; Duckstad; Nederland; 7054; AN, 222
2023-01-14 13:34:53+01:00, 5.135314, 51.687433, False, 90, 22165.5, 57, False, 0, 33; Achterstraat; Drunen; Heusden; Noord-Brabant; Nederland; 5151 BT; Nederland, 217
2023-01-14 13:58:34+01:00, 5.135314, 51.687433, False, 90, 22165.5, 57, False, 0, 33; Achterstraat; Drunen; Heusden; Noord-Brabant; Nederland; 5151 BT; Nederland, 217
2023-01-14 14:27:22+01:00, 6.401553, 51.934731, False, 89, 22167.5, 57, False, 0, 9;Kwakstraat; Duckstad; Nederland; 7054; AN, 205
2023-01-15 13:41:01+01:00, 5.698608, 51.244322, False, 93, 22244.9, 35, False, 0, 1; Het Dal; Parkhof; Weert; Limburg; Nederland; 6006 KV; Nederland, 125
2023-01-15 17:30:04+01:00, 5.696136, 51.244042, False, 91, 22245.5, 40, True, 1, Keulerstraat; Parkhof; Weert; Limburg; Nederland; 6006 LA; Nederland, 147
2023-01-15 17:41:04+01:00, 5.696136, 51.244042, False, 91, 22245.5, 50, True, 1, Keulerstraat; Parkhof; Weert; Limburg; Nederland; 6006 LA; Nederland, 189
2023-01-15 18:01:29+01:00, 5.696136, 51.244042, False, 91, 22245.5, 70, True, 1, Keulerstraat; Parkhof; Weert; Limburg; Nederland; 6006 LA; Nederland, 273
2023-01-15 18:15:07+01:00, 5.696136, 51.244042, False, 91, 22245.5, 83, False, 1, Keulerstraat; Parkhof; Weert; Limburg; Nederland; 6006 LA; Nederland, 331
2023-01-15 19:13:56+01:00, 6.401575, 51.934731, False, 91, 22323, 83, False, 1, 9;Kwakstraat; Duckstad; Nederland; 7054; AN, 331
2023-01-15 19:17:20+01:00, 6.401575, 51.934731, False, 95, 22323, 67, False, 0, 9;Kwakstraat; Duckstad; Nederland; 7054; AN, 255
2023-01-16 10:49:02+01:00, 5.131272, 51.678608, False, 91, 22327.1, 65, False, 0, Drunen; Heusden; Noord-Brabant; Nederland; 5151 SM; Nederland, 243
2023-01-16 17:50:02+01:00, 6.401606, 51.934739, False, 76, 22328.6, 65, False, 0, 7;Kwakstraat; Duckstad; Nederland; 7054; AN, 241
2023-01-17 14:54:06+01:00, 6.401578, 51.934733, False, 86, 22334.4, 63, False, 0, 9;Kwakstraat; Duckstad; Nederland; 7054; AN, 228
2023-01-18 09:39:03+01:00, 6.401578, 51.934733, True, 89, 22334.4, 61, False, 0, 9;Kwakstraat; Duckstad; Nederland; 7054; AN, 209
2023-01-18 09:50:49+01:00, 5.152414, 51.656597, False, 89, 22339.5, 59, False, 0, Giersbergen; Drunen; Heusden; Noord-Brabant; Nederland; 5151 RG; Nederland, 223
2023-01-18 12:15:04+01:00, 6.401569, 51.934731, False, 89, 22344.6, 59, False, 0, 9;Kwakstraat; Duckstad; Nederland; 7054; AN, 223
2023-01-18 12:19:00+01:00, 6.401569, 51.934731, False, 88, 22344.6, 58, False, 0, 9;Kwakstraat; Duckstad; Nederland; 7054; AN, 202
Example output file monitor.dailystats.csv
datetime, distance, distance_unit, total_consumed, regenerated_energy, engine_consumption, climate_consumption, onboard_electronics_consumption, battery_care_consumption
20230114, 4, km, 825, 275,  471, 54, 300, 0
20230115, 154, km, 26548, 3163,  24604, 534, 1410, 0
20230116, 5, km, 1204, 427,  707, 147, 350, 0
20230117, 5, km, 1327, 446,  683, 274, 370, 0
20230118, 10, km, 1942, 448,  1374, 178, 390, 0
Example output file monitor.tripinfo.csv
Date, Start time, Drive time, Idle time, Distance, Avg speed, Max speed
20230114,132456,7,1,2,23,48
20230114,141825,6,1,2,27,51
20230115,123407,64,2,77,77,95
20230115,172054,2,0,0,18,38
20230115,181454,59,0,77,81,103
20230116,103521,10,2,4,31,51
20230116,174248,4,1,1,30,56
20230117,141846,32,19,5,28,60
20230118,093825,9,1,5,40,63
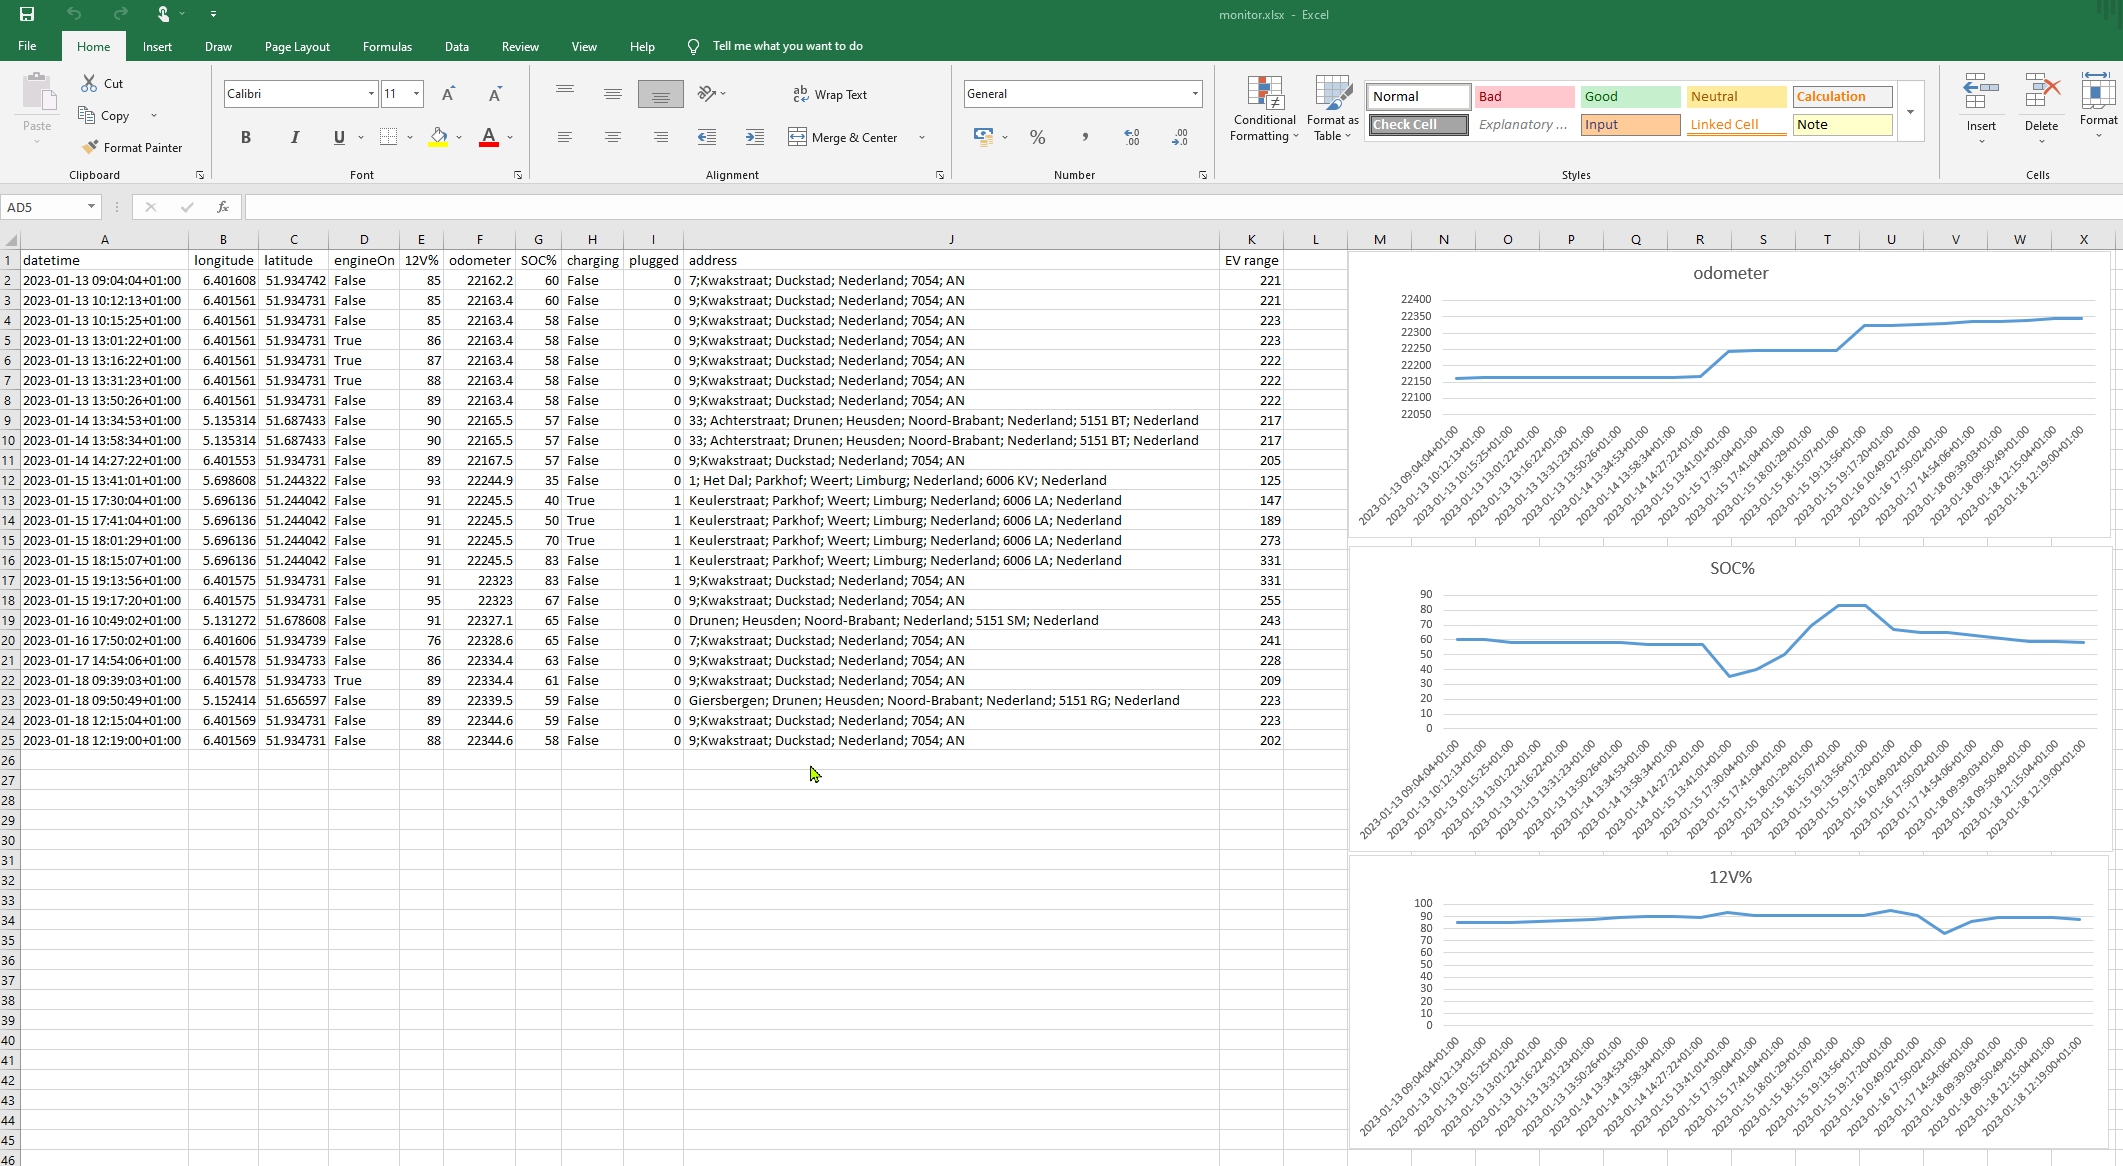
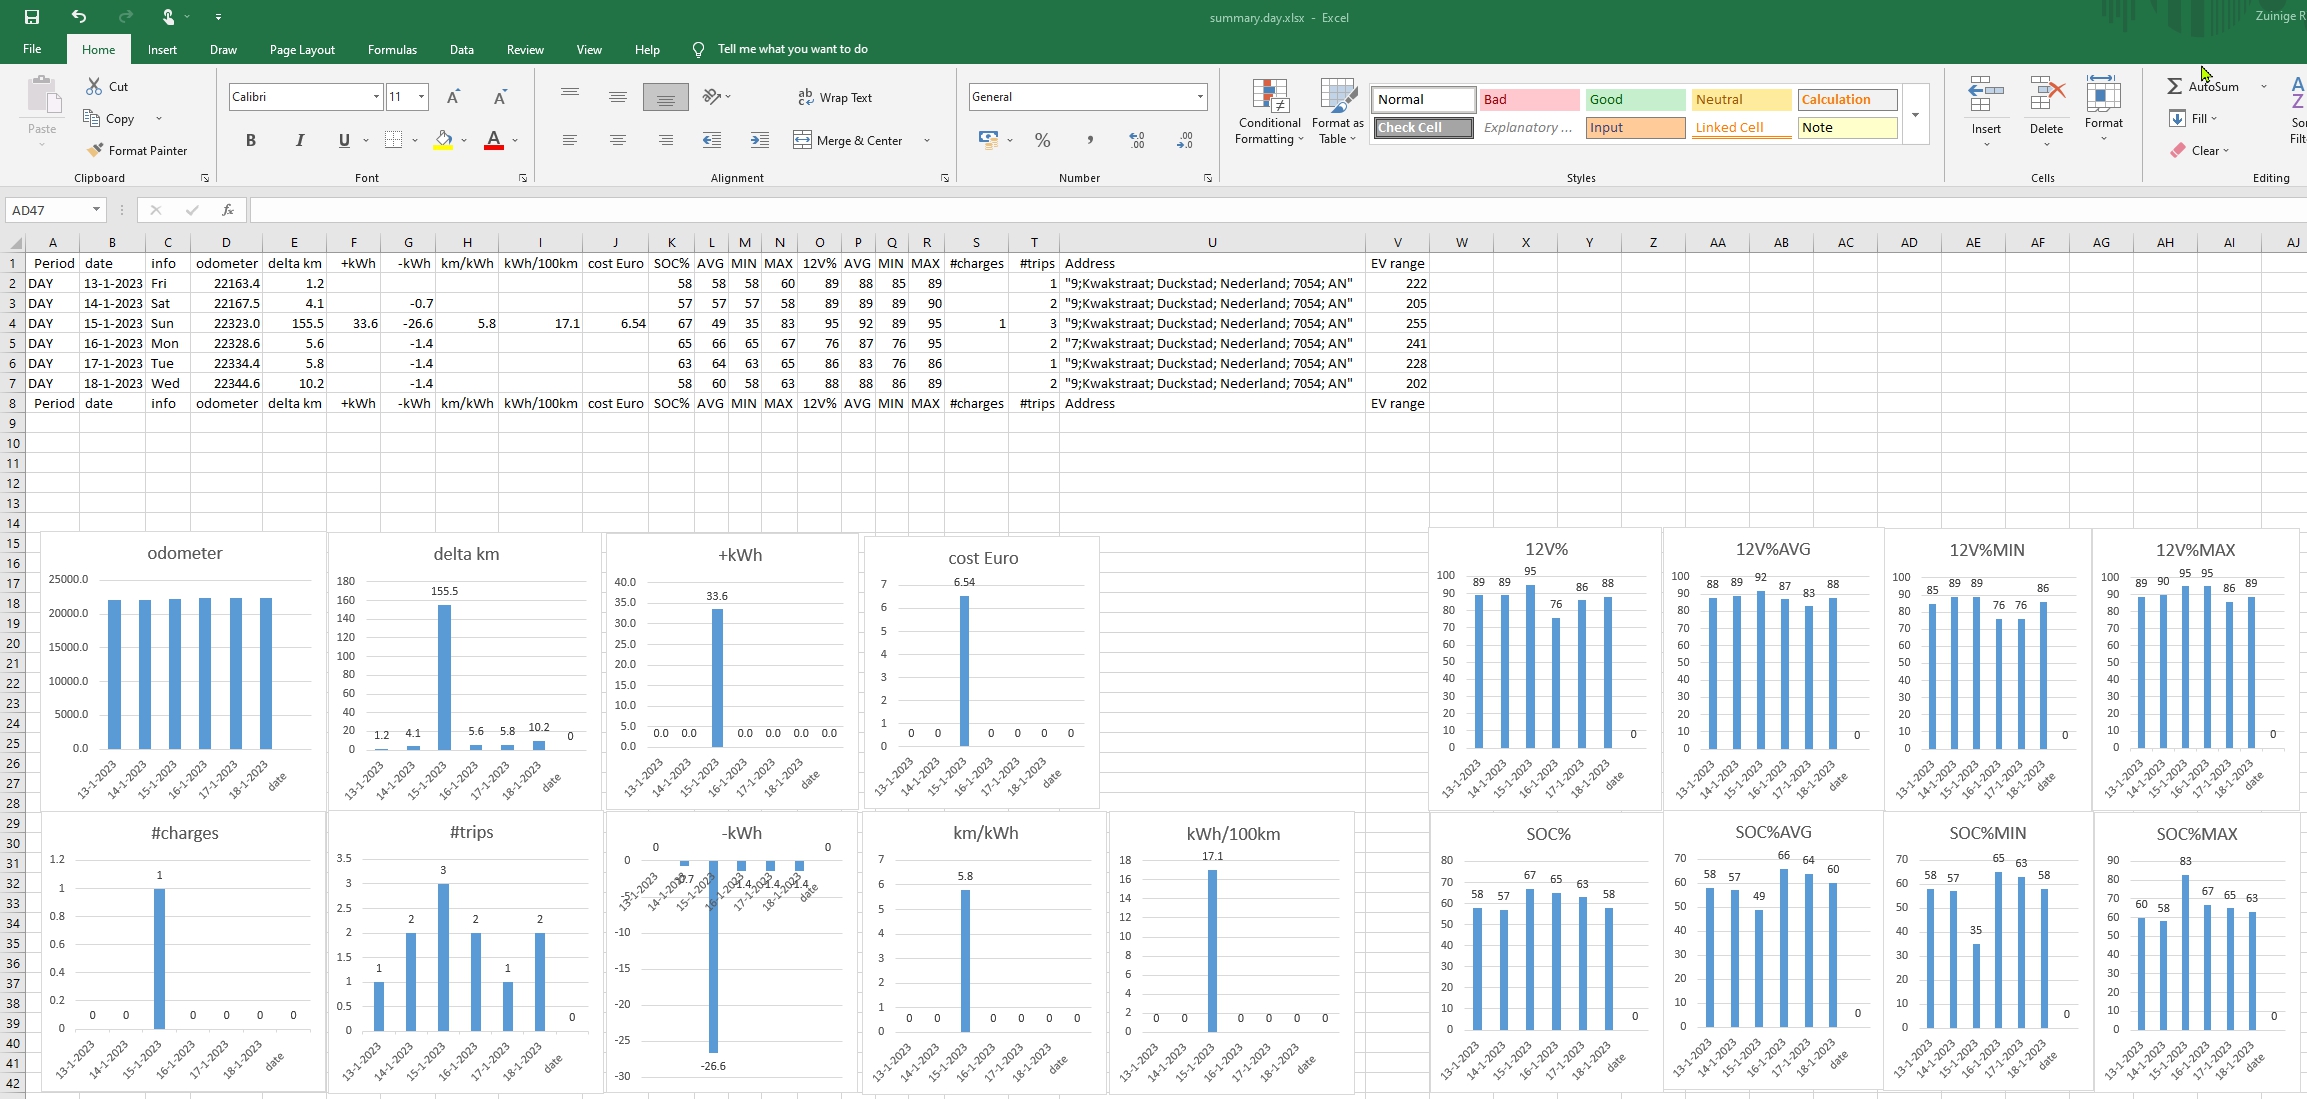
20230118,120700,8,1,5,43,63Excel example using monitor.csv
Screenshot of excel example with some graphs:
python summary.py
The summary.py standard output of the monitor.csv file
output:
C:\Users\Rick\git\monitor>python summary.py sheetupdate
Period, date , info , odometer, delta km, +kWh, -kWh, km/kWh, kWh/100km, cost Euro, SOC%,AVG,MIN,MAX, 12V%,AVG,MIN,MAX, #charges, #trips, Address, EV range
TRIP , 2023-01-13, 10:12, 22163.4, 1.2, , -1.4, 0.9, 116.7, 0.34, 58, 60, 58, 60, 85, 86, 85, 85, , 1 , "9;Kwakstraat; Duckstad; Nederland; 7054; AN",221
DAY , 2023-01-13, Fri , 22163.4, 1.2, , , , , , 58, 58, 58, 60, 89, 88, 85, 89, , 1 , "9;Kwakstraat; Duckstad; Nederland; 7054; AN",222
TRIP , 2023-01-14, 13:58, 22165.5, 2.1, , -0.7, 3.0, 33.3, 0.17, 57, 58, 57, 58, 90, 90, 89, 90, , 1 , "33; Achterstraat; Drunen; Heusden; Noord-Brabant; Nederland; 5151 BT; Nederland",217
TRIP , 2023-01-14, 14:27, 22167.5, 2.0, , , , , , 57, 59, 57, 57, 89, 93, 89, 90, , 1 , "9;Kwakstraat; Duckstad; Nederland; 7054; AN",205
DAY , 2023-01-14, Sat , 22167.5, 4.1, , -0.7, 5.9, 17.1, 0.17, 57, 57, 57, 58, 89, 89, 89, 90, , 2 , "9;Kwakstraat; Duckstad; Nederland; 7054; AN",205
TRIP , 2023-01-15, 13:41, 22244.9, 77.4, , -15.4, 5.0, 19.9, 3.79, 35, 46, 35, 57, 93, 91, 89, 93, , 1 , "1; Het Dal; Parkhof; Weert; Limburg; Nederland; 6006 KV; Nederland",125
TRIP , 2023-01-15, 17:30, 22245.5, 0.6, 3.5, , , , , 40, 38, 35, 40, 91, 92, 91, 93, 1 , 1 , "Keulerstraat; Parkhof; Weert; Limburg; Nederland; 6006 LA; Nederland",147
TRIP , 2023-01-15, 19:13, 22323.0, 77.5, 30.1, -11.2, 6.9, 14.5, 2.76, 67, 70, 40, 83, 91, 92, 91, 91, , 1 , "9;Kwakstraat; Duckstad; Nederland; 7054; AN",331
DAY , 2023-01-15, Sun , 22323.0, 155.5, 33.6, -26.6, 5.8, 17.1, 6.54, 67, 49, 35, 83, 95, 92, 89, 95, 1 , 3 , "9;Kwakstraat; Duckstad; Nederland; 7054; AN",255
WEEK , 2023-01-15, WK 02, 22323.0, 160.8, 32.2, -27.3, 5.9, 17.0, 6.72, 67, 54, 35, 83, 95, 90, 85, 95, 1 , 6 , "9;Kwakstraat; Duckstad; Nederland; 7054; AN",255
TRIP , 2023-01-16, 10:49, 22327.1, 4.1, , -1.4, 2.9, 34.1, 0.34, 65, 66, 65, 67, 91, 93, 91, 95, , 1 , "Drunen; Heusden; Noord-Brabant; Nederland; 5151 SM; Nederland",243
TRIP , 2023-01-16, 17:50, 22328.6, 1.5, , , , , , 65, 65, 65, 65, 76, 84, 76, 91, , 1 , "7;Kwakstraat; Duckstad; Nederland; 7054; AN",241
DAY , 2023-01-16, Mon , 22328.6, 5.6, , -1.4, 4.0, 25.0, 0.34, 65, 66, 65, 67, 76, 87, 76, 95, , 2 , "7;Kwakstraat; Duckstad; Nederland; 7054; AN",241
TRIP , 2023-01-17, 14:54, 22334.4, 5.8, , -1.4, 4.1, 24.1, 0.34, 63, 64, 63, 65, 86, 81, 76, 86, , 1 , "9;Kwakstraat; Duckstad; Nederland; 7054; AN",228
DAY , 2023-01-17, Tue , 22334.4, 5.8, , -1.4, 4.1, 24.1, 0.34, 63, 64, 63, 65, 86, 83, 76, 86, , 1 , "9;Kwakstraat; Duckstad; Nederland; 7054; AN",228
TRIP , 2023-01-18, 09:50, 22339.5, 5.1, , -1.4, 3.6, 27.5, 0.34, 59, 62, 59, 63, 89, 88, 86, 89, , 1 , "Giersbergen; Drunen; Heusden; Noord-Brabant; Nederland; 5151 RG; Nederland",223
TRIP , 2023-01-18, 12:15, 22344.6, 5.1, , -0.7, 7.3, 13.7, 0.17, 58, 59, 58, 59, 89, 90, 89, 89, , 1 , "9;Kwakstraat; Duckstad; Nederland; 7054; AN",223
DAY , 2023-01-18, Wed , 22344.6, 10.2, , -1.4, 7.3, 13.7, 0.34, 58, 60, 58, 63, 88, 88, 86, 89, , 2 , "9;Kwakstraat; Duckstad; Nederland; 7054; AN",202
WEEK , 2023-01-18, WK 03, 22344.6, 21.6, , -4.2, 5.1, 19.4, 1.03, 58, 63, 58, 67, 88, 86, 76, 95, , 5 , "9;Kwakstraat; Duckstad; Nederland; 7054; AN",202
MONTH , 2023-01-18, Jan , 22344.6, 182.4, 30.1, -31.5, 5.8, 17.3, 7.75, 58, 59, 35, 83, 88, 88, 76, 95, 1 , 11 , "9;Kwakstraat; Duckstad; Nederland; 7054; AN",202
YEAR , 2023-01-18, 2023 , 22344.6, 182.4, 30.1, -31.5, 5.8, 17.3, 7.75, 58, 59, 35, 83, 88, 88, 76, 95, 1 , 11 , "9;Kwakstraat; Duckstad; Nederland; 7054; AN",202
TRIPAVG , 2023-01-18, 11t , 22344.6, 16.6, 2.7, -2.9, 5.8, 17.3, 0.70, 58, 59, 35, 83, 88, 88, 76, 95, 0.1, 1 , "9;Kwakstraat; Duckstad; Nederland; 7054; AN",202
DAYAVG , 2023-01-18, 6d , 22344.6, 30.4, 5.0, -5.2, 5.8, 17.3, 1.29, 58, 59, 35, 83, 88, 88, 76, 95, 0.2, 1.8, "9;Kwakstraat; Duckstad; Nederland; 7054; AN",202
WEEKAVG , 2023-01-18, 6d , 22344.6, 212.8, 35.1, -36.8, 5.8, 17.3, 9.04, 58, 59, 35, 83, 88, 88, 76, 95, 1.2, 12.8, "9;Kwakstraat; Duckstad; Nederland; 7054; AN",202
MONTHAVG, 2023-01-18, 6d , 22344.6, 924.7, 152.6, -159.7, 5.8, 17.3, 39.28, 58, 59, 35, 83, 88, 88, 76, 95, 5.1, 55.8, "9;Kwakstraat; Duckstad; Nederland; 7054; AN",202
YEARLY , 2023-01-18, 6d , 22344.6, 11096.0, 1831.1, -1916.2, 5.8, 17.3, 471.40, 58, 59, 35, 83, 88, 88, 76, 95, 60.8, 669.2, "9;Kwakstraat; Duckstad; Nederland; 7054; AN",202
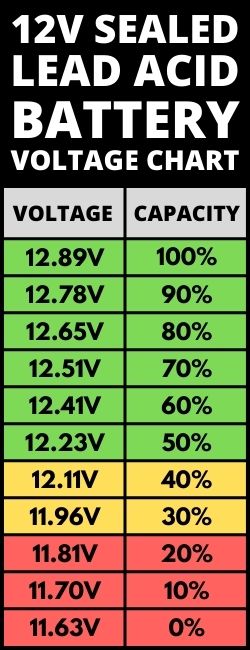
Period, date , info , odometer, delta km, +kWh, -kWh, km/kWh, kWh/100km, cost Euro, SOC%,AVG,MIN,MAX, 12V%,AVG,MIN,MAX, #charges, #trips, Address, EV rangeAlso the 12 Volt battery is shown. Here the mapping of percentage to volt for a typical Lead Acid Battery:
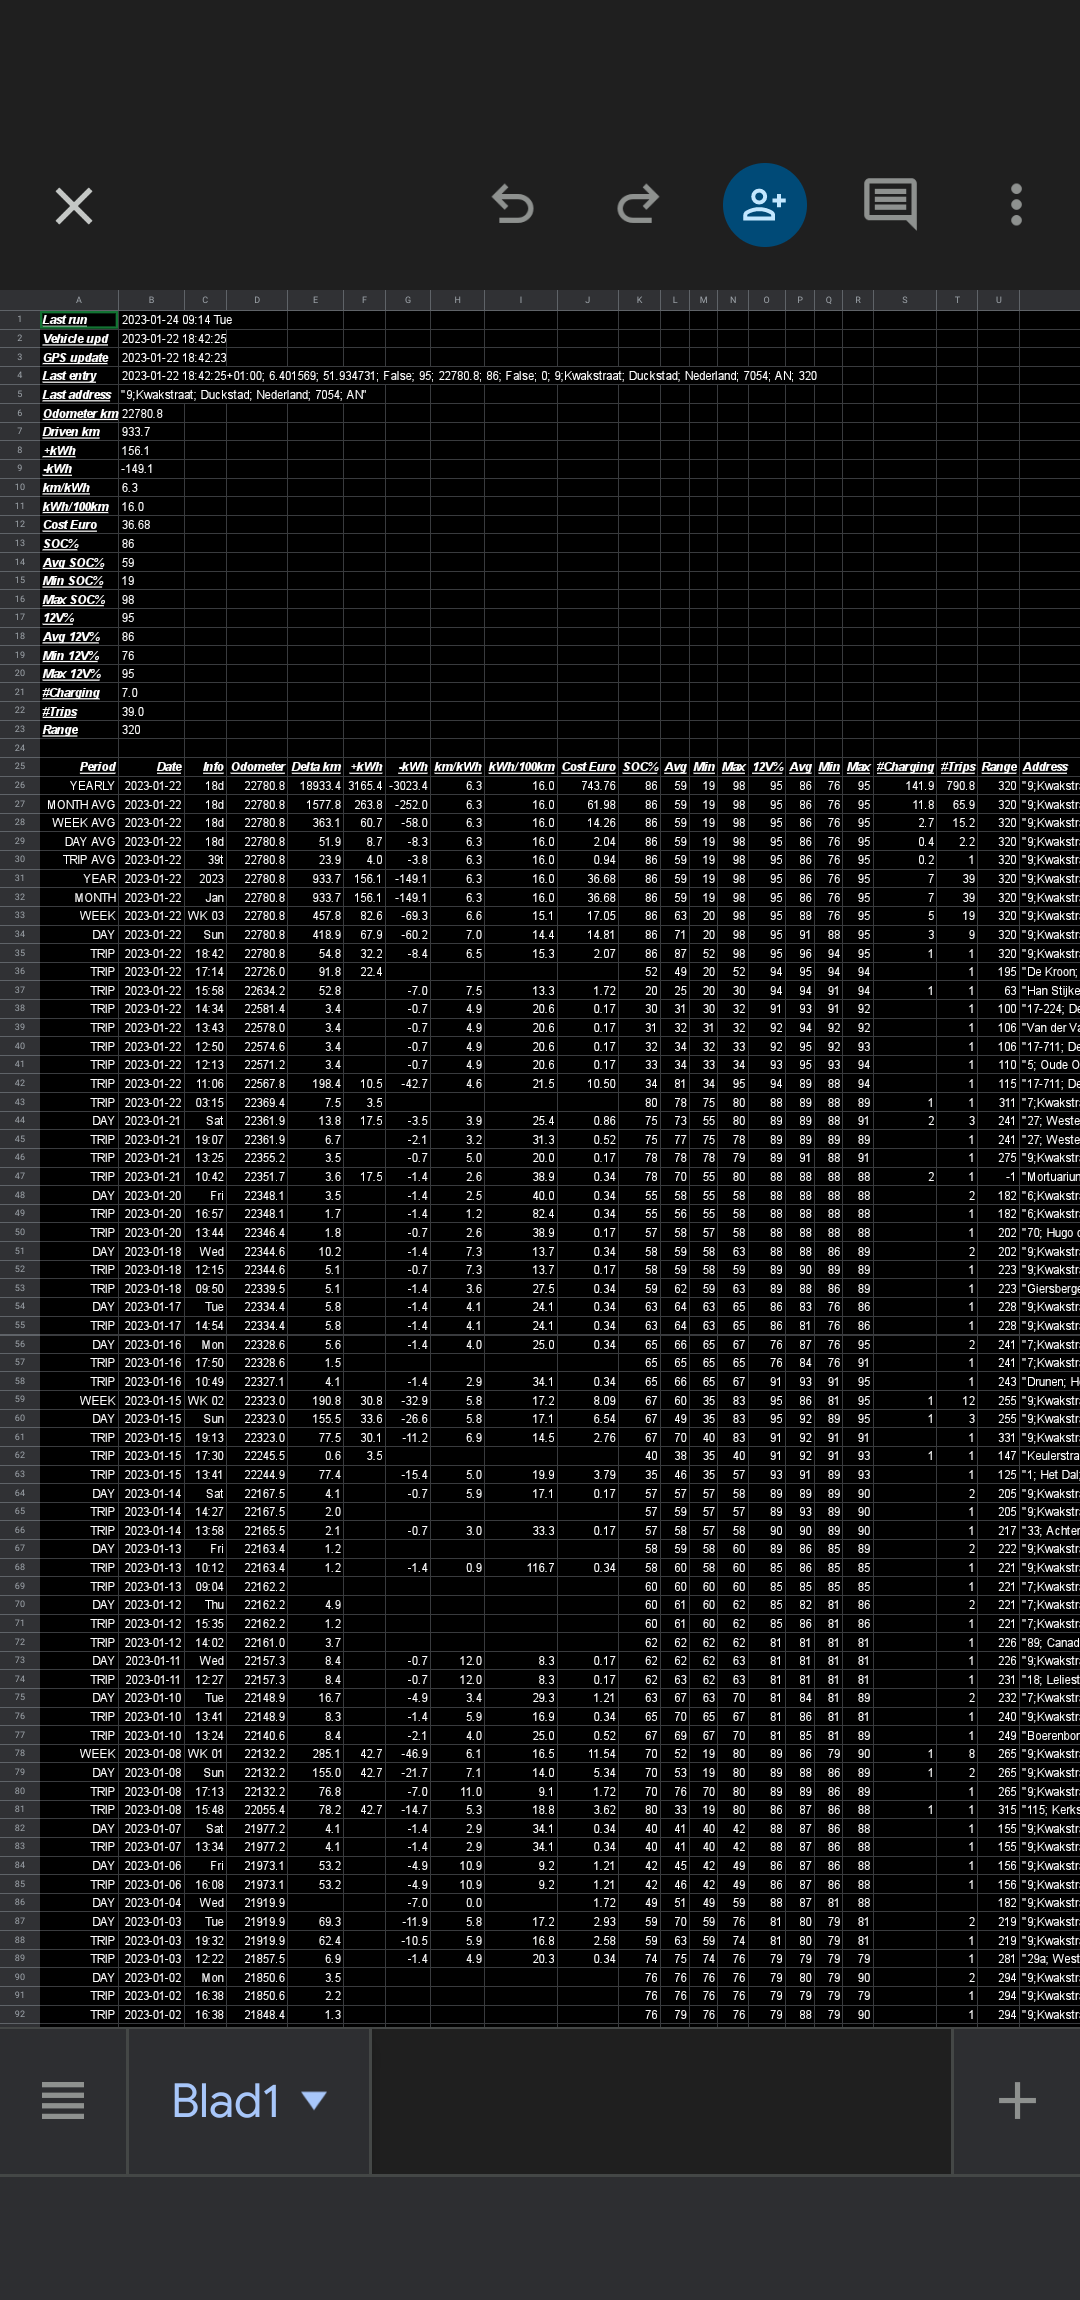
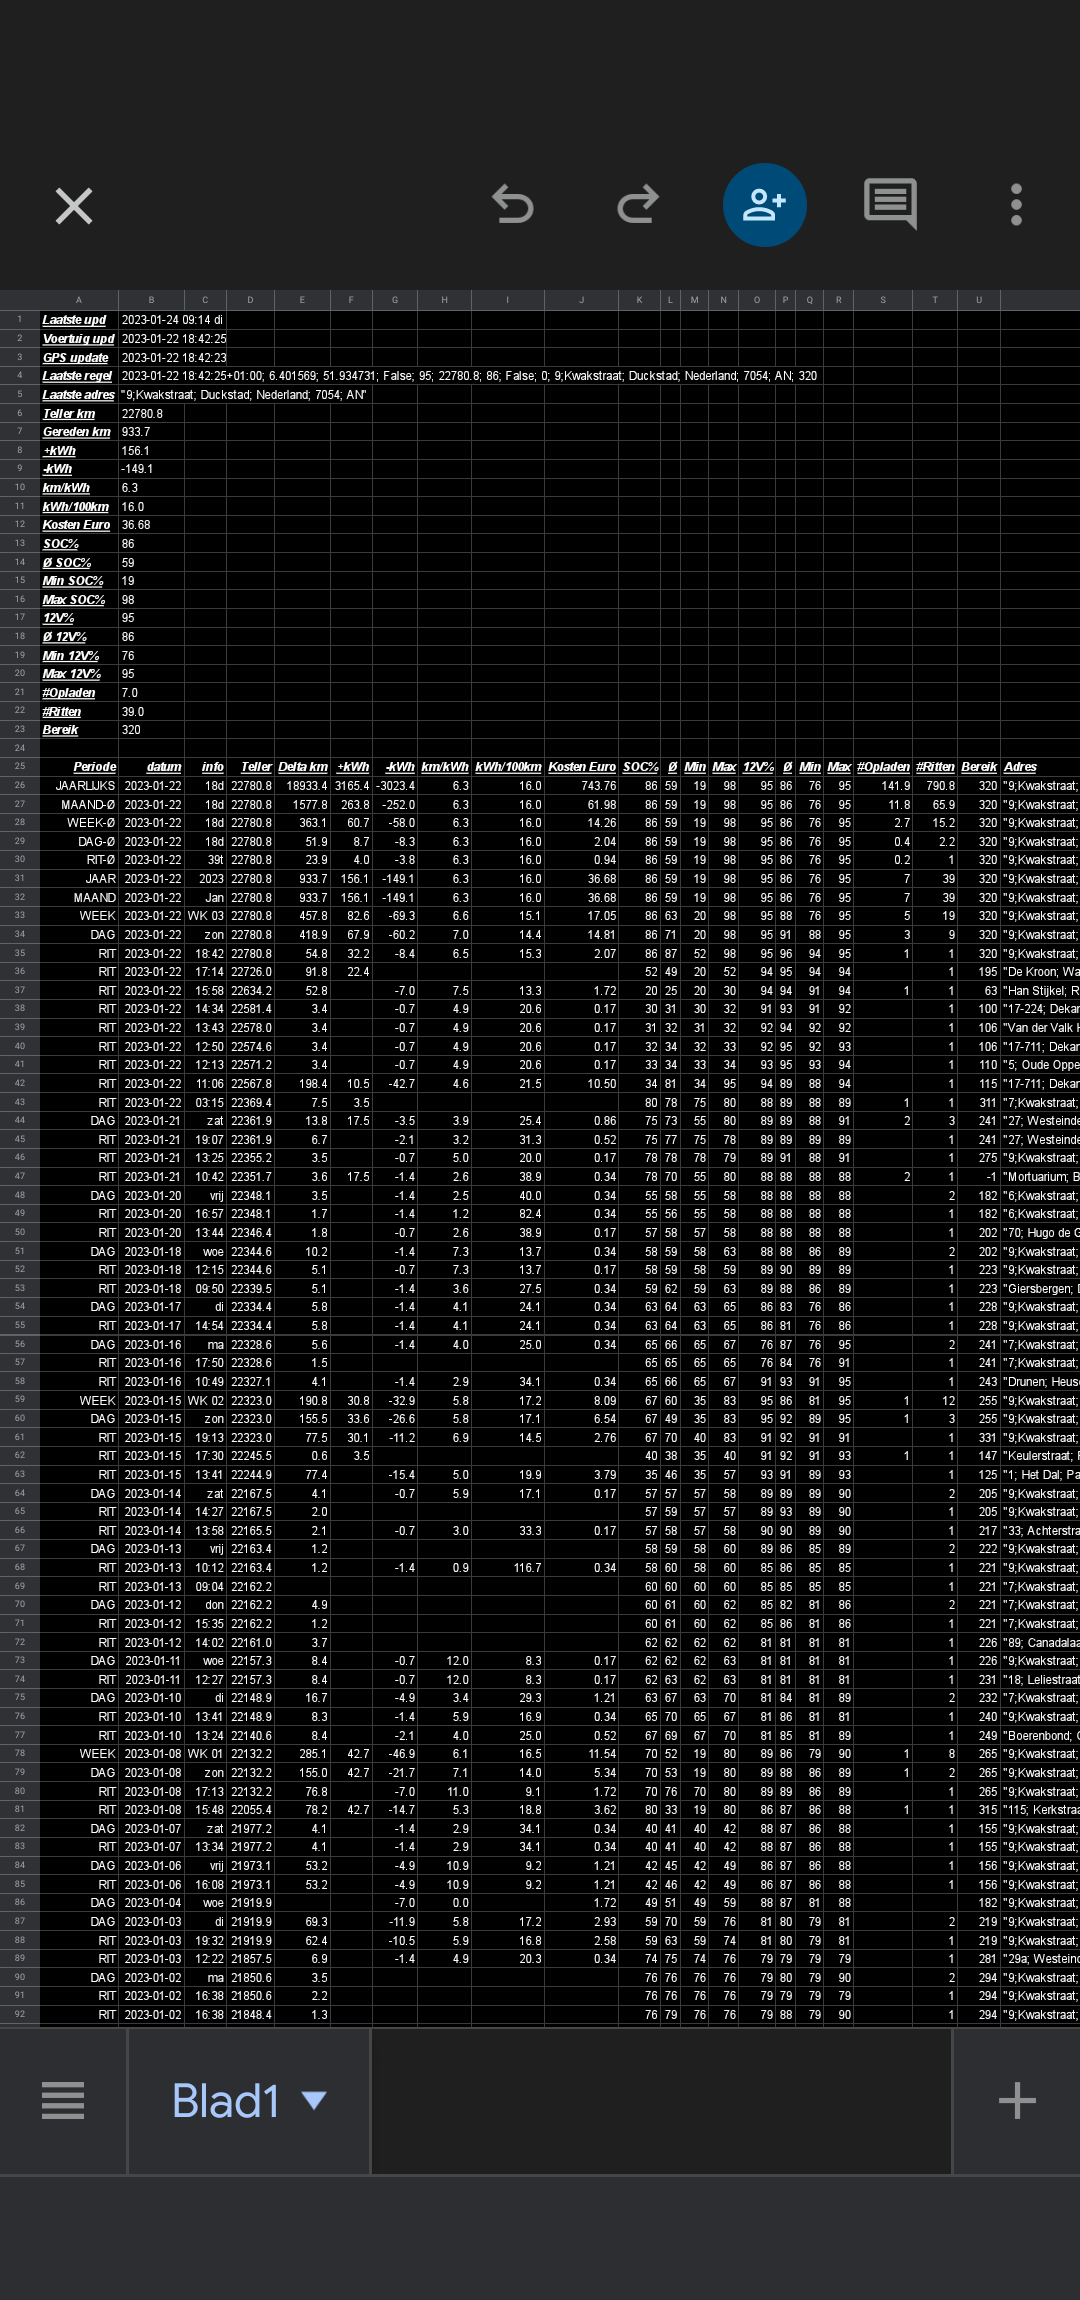
Screenshot of spreadsheet:
Dutch screenshot of spreadsheet:
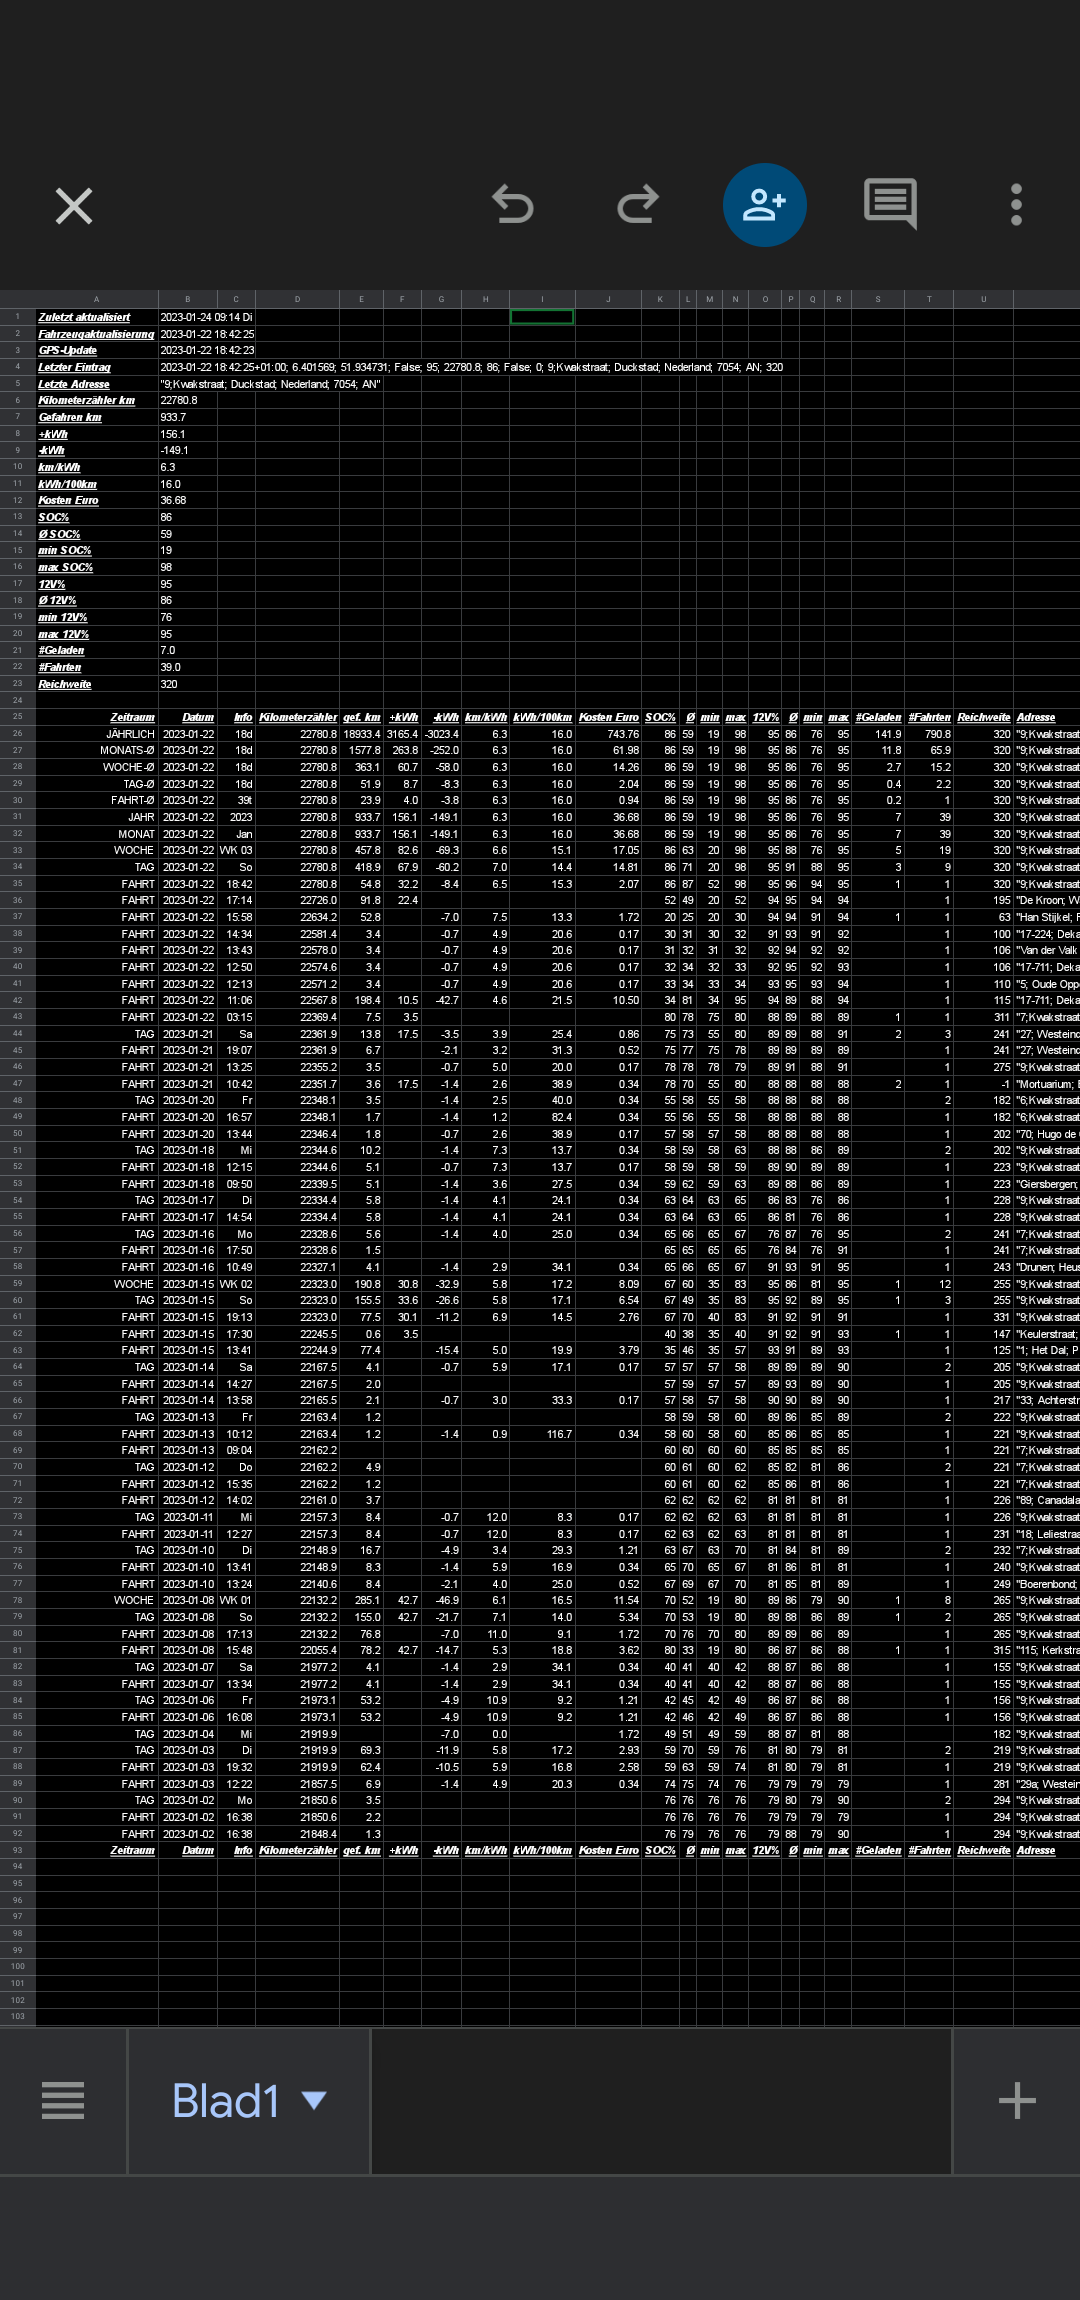
German screenshot of spreadsheet:
Example output of summary.charged.csv (larger example)
date, odometer, +kWh, end charged SOC%
2022-09-21, 17383.5, 15.4, 68
2022-09-23, 17387.1, 6.3, 80
2022-09-24, 17794.9, 15.4, 7
2022-09-25, 17810.9, 37.1, 60
2022-09-30, 17867.2, 12.6, 60
2022-10-03, 18026.2, 23.8, 60
2022-10-09, 18115.4, 14.0, 58
2022-10-13, 18221.0, 13.3, 54
2022-10-14, 18248.3, 4.2, 60
2022-10-15, 18252.1, 4.2, 60
2022-10-17, 18406.7, 21.7, 59
2022-10-21, 18530.4, 17.5, 58
2022-10-22, 18564.9, 15.4, 80
2022-10-23, 18973.0, 51.1, 51
2022-10-24, 19026.6, 4.2, 57
2022-10-27, 19083.1, 27.3, 72
2022-10-31, 19262.4, 28.7, 72
2022-11-09, 19454.7, 15.4, 62
2022-11-16, 19555.6, 22.4, 70
2022-11-26, 20005.7, 13.3, 60
2022-11-27, 20428.2, 56.0, 30
2022-11-28, 20443.8, 48.3, 100
2022-12-04, 20779.8, 42.0, 90
2022-12-12, 20879.4, 23.1, 74
2022-12-21, 20994.2, 31.5, 80
2022-12-23, 21168.1, 42.0, 100
2022-12-24, 21579.5, 51.1, 70
2022-12-25, 21706.6, 5.6, 77
2022-12-31, 21746.9, 15.4, 76
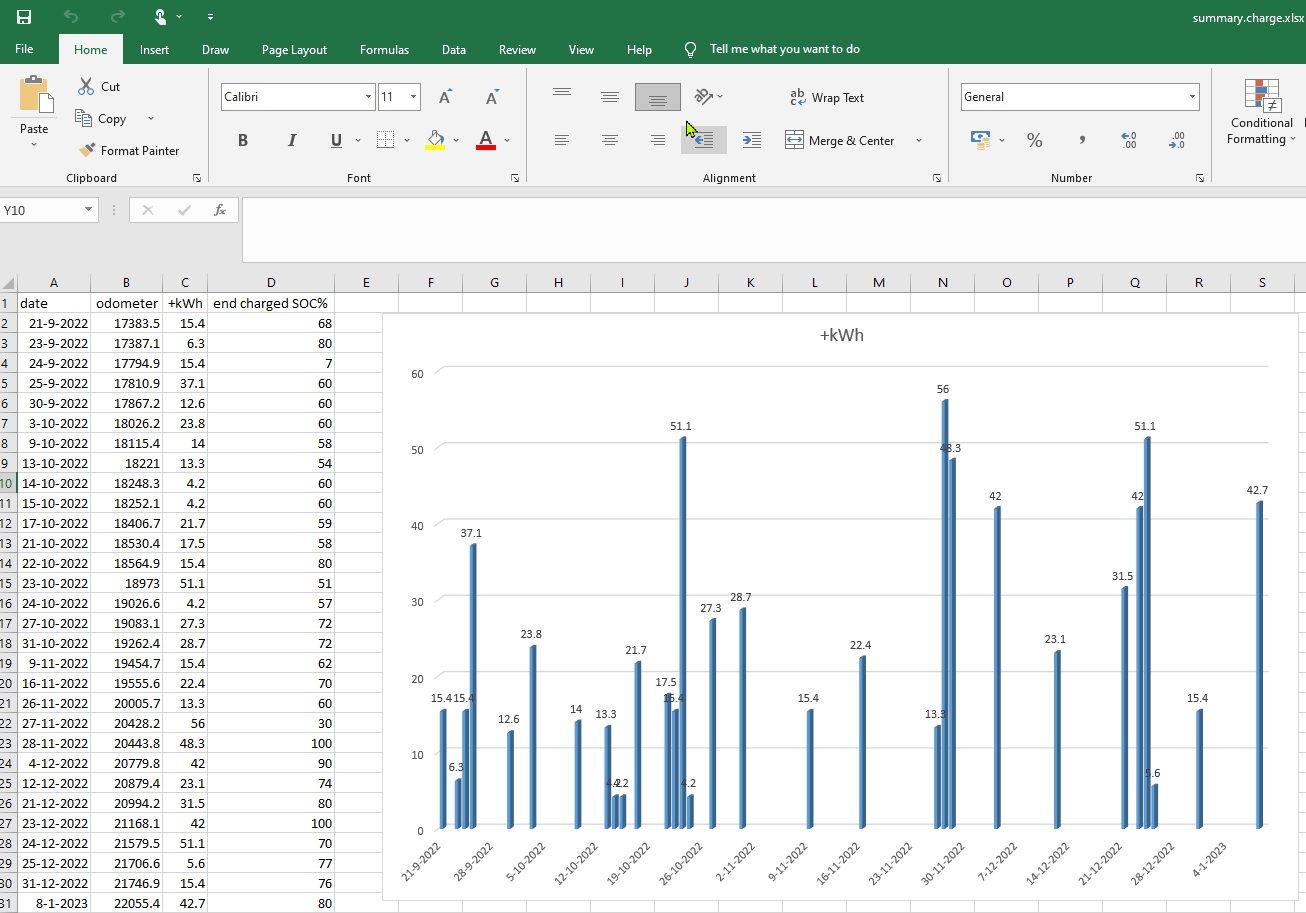
2023-01-08, 22055.4, 42.7, 80You can use summary.charged.csv also in other tools, e.g. Excel:
Screenshot of Excel example using a larger summary.charged.csv:
Example output of summary.trip.csv
date, odometer, distance, -kWh, +kWh
2023-01-13 10:15, 22163.4, 1.2, -1.4, 0.0
2023-01-14 13:58, 22165.5, 2.1, -0.7, 0.0
2023-01-14 14:27, 22167.5, 2.0, 0.0, 0.0
2023-01-15 13:41, 22244.9, 77.4, -15.4, 0.0
2023-01-15 17:30, 22245.5, 0.6, 0.0, 3.5
2023-01-15 19:17, 22323.0, 77.5, -11.2, 30.1
2023-01-16 10:49, 22327.1, 4.1, -1.4, 0.0
2023-01-16 17:50, 22328.6, 1.5, 0.0, 0.0
2023-01-17 14:54, 22334.4, 5.8, -1.4, 0.0
2023-01-18 09:50, 22339.5, 5.1, -1.4, 0.0
2023-01-18 12:19, 22344.6, 5.1, -0.7, 0.0
Example output of summary.day.csv
date, odometer, distance, -kWh, +kWh
2023-01-13, 22163.4, 1.2, -1.4, 0.0
2023-01-14, 22167.5, 4.1, -0.7, 0.0
2023-01-15, 22323.0, 155.5, -26.6, 33.6
2023-01-16, 22328.6, 5.6, -1.4, 0.0
2023-01-17, 22334.4, 5.8, -1.4, 0.0
2023-01-18, 22344.6, 10.2, -2.1, 0.0
You can redirect the standard output to a file, e.g. summary.day.output.csv
  Period, date      , info , odometer, delta km,    +kWh,     -kWh, km/kWh, kWh/100km, cost Euro, SOC%,AVG,MIN,MAX, 12V%,AVG,MIN,MAX, #charges,   #trips, Address, EV range
DAY     , 2023-01-13, Fri  ,  22163.4,      1.2,        ,         ,       ,          ,          ,      58, 58, 58, 60,      89, 88, 85, 89,         ,      1  , "9;Kwakstraat; Duckstad; Nederland; 7054; AN",222
DAY     , 2023-01-14, Sat  ,  22167.5,      4.1,        ,     -0.7,       ,          ,          ,      57, 57, 57, 58,      89, 89, 89, 90,         ,      2  , "9;Kwakstraat; Duckstad; Nederland; 7054; AN",205
DAY     , 2023-01-15, Sun  ,  22323.0,    155.5,    33.6,    -26.6,    5.8,      17.1,      6.54,      67, 49, 35, 83,      95, 92, 89, 95,      1  ,      3  , "9;Kwakstraat; Duckstad; Nederland; 7054; AN",255
DAY     , 2023-01-16, Mon  ,  22328.6,      5.6,        ,     -1.4,       ,          ,          ,      65, 66, 65, 67,      76, 87, 76, 95,         ,      2  , "7;Kwakstraat; Duckstad; Nederland; 7054; AN",241
DAY     , 2023-01-17, Tue  ,  22334.4,      5.8,        ,     -1.4,       ,          ,          ,      63, 64, 63, 65,      86, 83, 76, 86,         ,      1  , "9;Kwakstraat; Duckstad; Nederland; 7054; AN",228
DAY     , 2023-01-18, Wed  ,  22344.6,     10.2,        ,     -1.4,       ,          ,          ,      58, 60, 58, 63,      88, 88, 86, 89,         ,      2  , "9;Kwakstraat; Duckstad; Nederland; 7054; AN",202
  Period, date      , info , odometer, delta km,    +kWh,     -kWh, km/kWh, kWh/100km, cost Euro, SOC%,AVG,MIN,MAX, 12V%,AVG,MIN,MAX, #charges,   #trips, Address, EV range
Excel example using python summary.py day > summary.day.output.csv
Screenshot of excel example with some graphs:
python dailystats.py
The dailystats.py standard output of the monitor.dailystats.csv file
output:
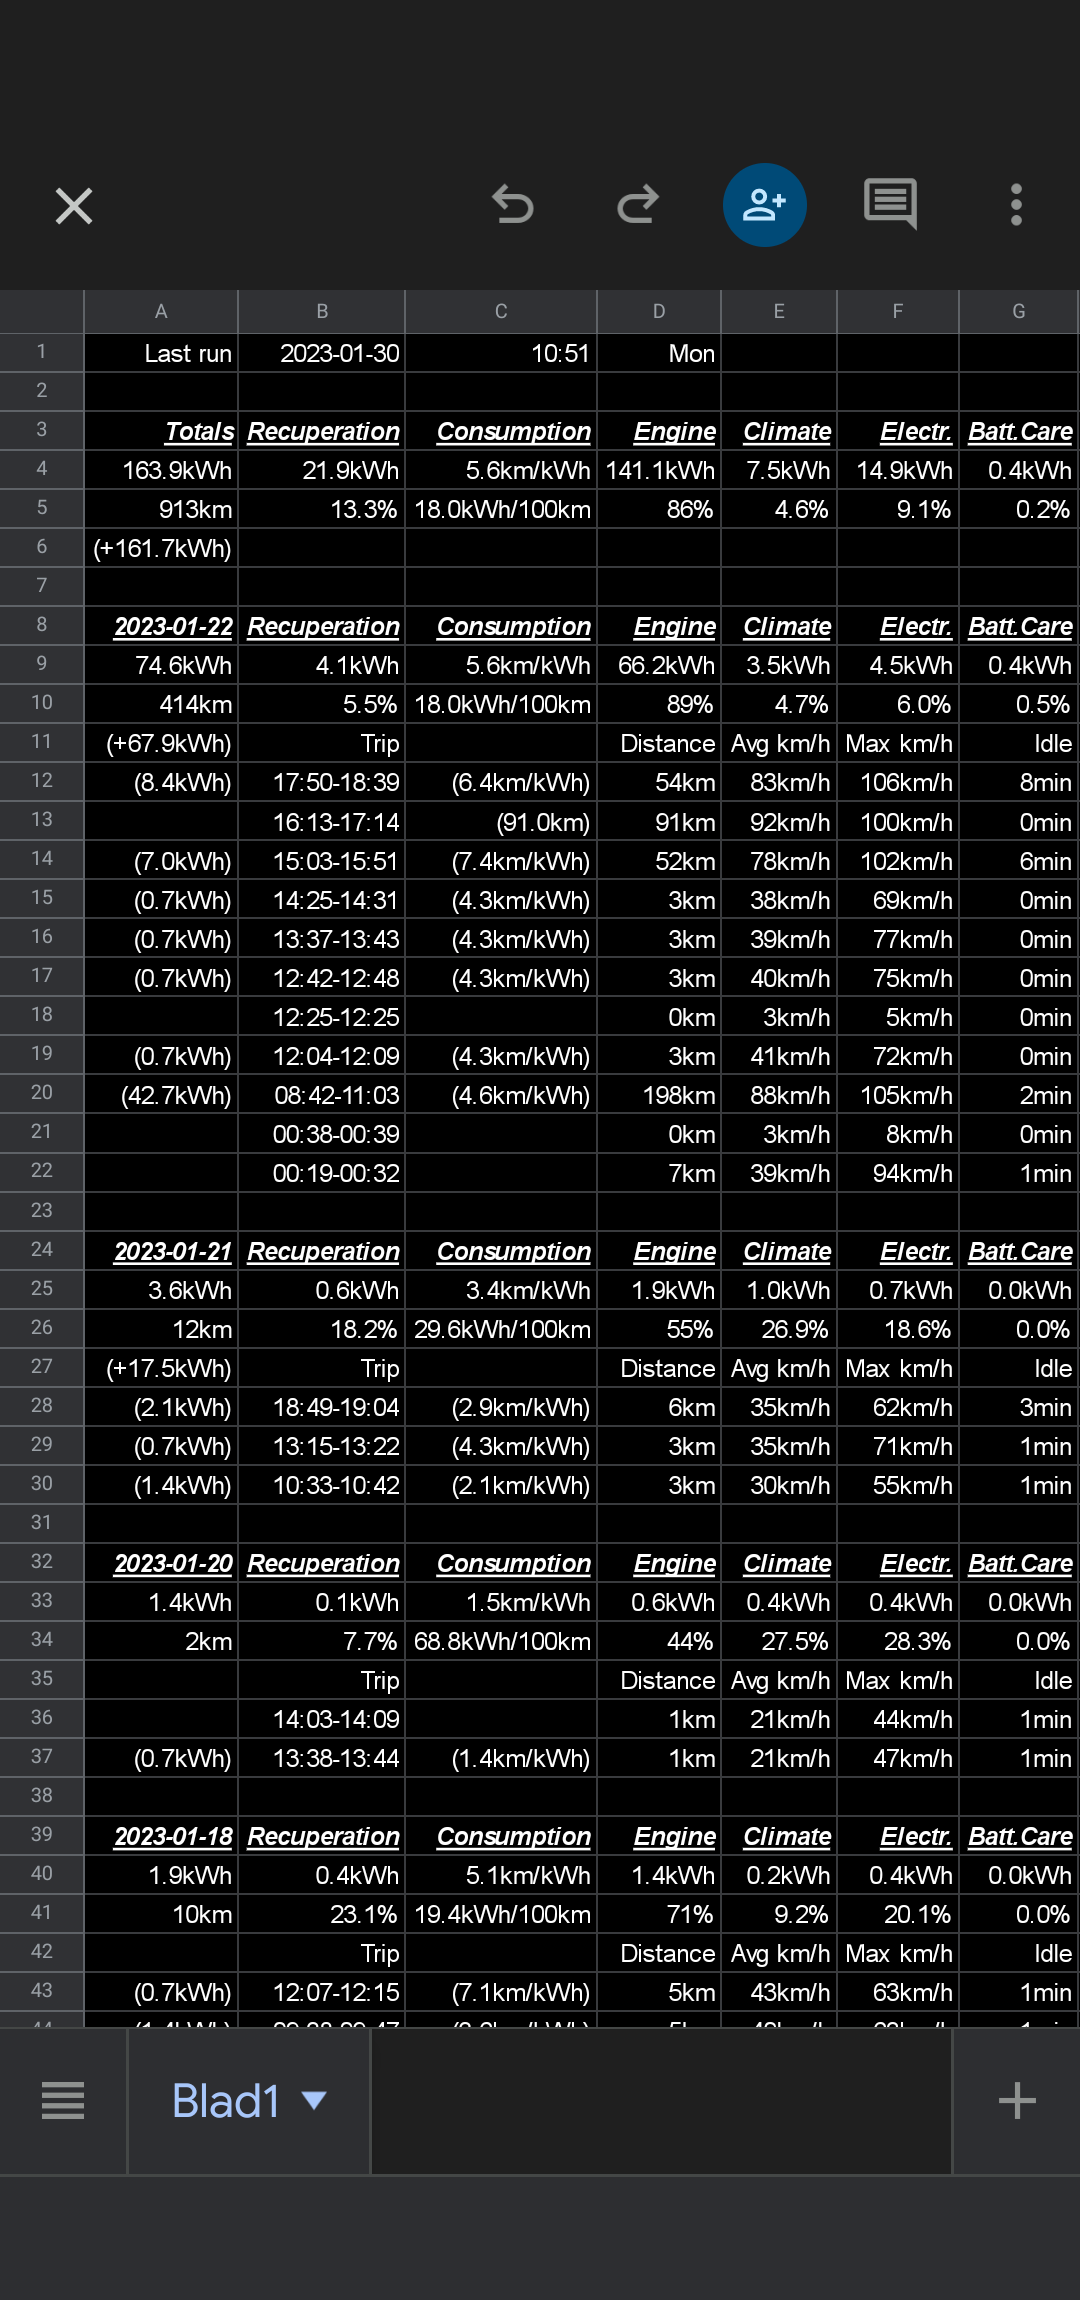
C:\Users\Rick\git\monitor>python dailystats.py sheetupdate
   Last run   2023-02-22         12:49       Wed

     Totals Recuperation   Consumption    Engine  Climate  Electr. Batt.Care
    31.8kWh       4.8kWh     5.6km/kWh   27.8kWh   1.2kWh   2.8kWh    0.0kWh
      178km        14.9% 17.9kWh/100km       87%     3.7%     8.9%      0.0%
 (+33.6kWh)         Trip   (5.4km/kWh)  Distance Avg km/h Max km/h      Idle
                  201min                   178km   60km/h  103km/h     28min

 2023-01-18 Recuperation   Consumption    Engine  Climate  Electr. Batt.Care
     1.9kWh       0.4kWh     5.1km/kWh    1.4kWh   0.2kWh   0.4kWh    0.0kWh
       10km        23.1% 19.4kWh/100km       71%     9.2%    20.1%      0.0%
                    Trip   (4.9km/kWh)  Distance Avg km/h Max km/h      Idle
   (0.7kWh)  12:07-12:15   (7.3km/kWh)       5km   43km/h   63km/h      1min
   (1.4kWh)  09:38-09:47   (3.6km/kWh)       5km   40km/h   63km/h      1min

 2023-01-17 Recuperation   Consumption    Engine  Climate  Electr. Batt.Care
     1.3kWh       0.4kWh     3.8km/kWh    0.7kWh   0.3kWh   0.4kWh    0.0kWh
        5km        33.6% 26.5kWh/100km       51%    20.6%    27.9%      0.0%
                    Trip   (4.1km/kWh)  Distance Avg km/h Max km/h      Idle
   (1.4kWh)  14:18-14:50   (4.1km/kWh)       5km   28km/h   60km/h     19min

 2023-01-16 Recuperation   Consumption    Engine  Climate  Electr. Batt.Care
     1.2kWh       0.4kWh     4.2km/kWh    0.7kWh   0.1kWh   0.3kWh    0.0kWh
        5km        35.5% 24.1kWh/100km       59%    12.2%    29.1%      0.0%
                    Trip   (4.0km/kWh)  Distance Avg km/h Max km/h      Idle
             17:42-17:46       (1.5km)       1km   30km/h   56km/h      1min
   (1.4kWh)  10:35-10:45   (2.9km/kWh)       4km   31km/h   51km/h      2min

 2023-01-15 Recuperation   Consumption    Engine  Climate  Electr. Batt.Care
    26.5kWh       3.2kWh     5.8km/kWh   24.6kWh   0.5kWh   1.4kWh    0.0kWh
      154km        11.9% 17.2kWh/100km       93%     2.0%     5.3%      0.0%
 (+33.6kWh)         Trip   (5.8km/kWh)  Distance Avg km/h Max km/h      Idle
  (11.2kWh)  18:14-19:13   (6.9km/kWh)      77km   81km/h  103km/h      0min
             17:20-17:22       (0.6km)       0km   18km/h   38km/h      0min
  (15.4kWh)  12:34-13:38   (5.0km/kWh)      77km   77km/h   95km/h      2min

 2023-01-14 Recuperation   Consumption    Engine  Climate  Electr. Batt.Care
     0.8kWh       0.3kWh     4.8km/kWh    0.5kWh   0.1kWh   0.3kWh    0.0kWh
        4km        33.3% 20.6kWh/100km       57%     6.5%    36.4%      0.0%
                    Trip   (5.9km/kWh)  Distance Avg km/h Max km/h      Idle
             14:18-14:24       (2.0km)       2km   27km/h   51km/h      1min
   (0.7kWh)  13:24-13:31   (3.0km/kWh)       2km   23km/h   48km/h      1min
Video of spreadsheet:
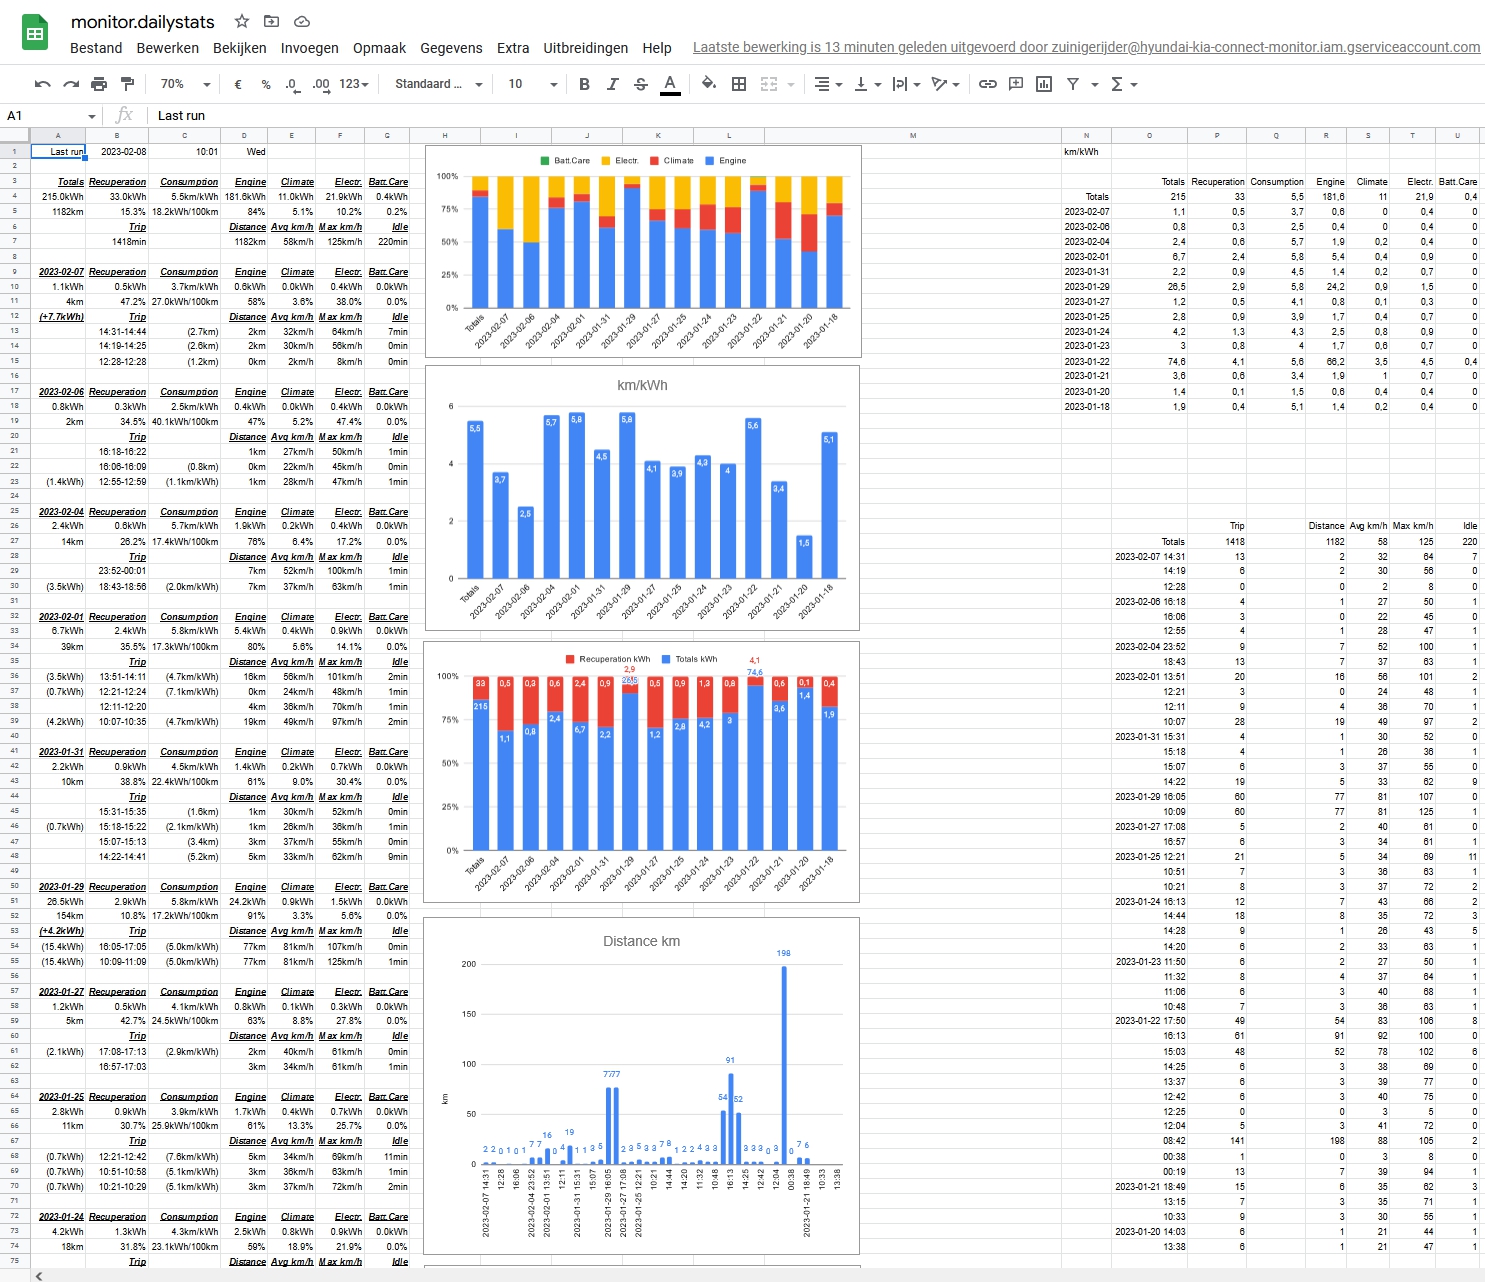
Screenshot in browser with nice diagrams:
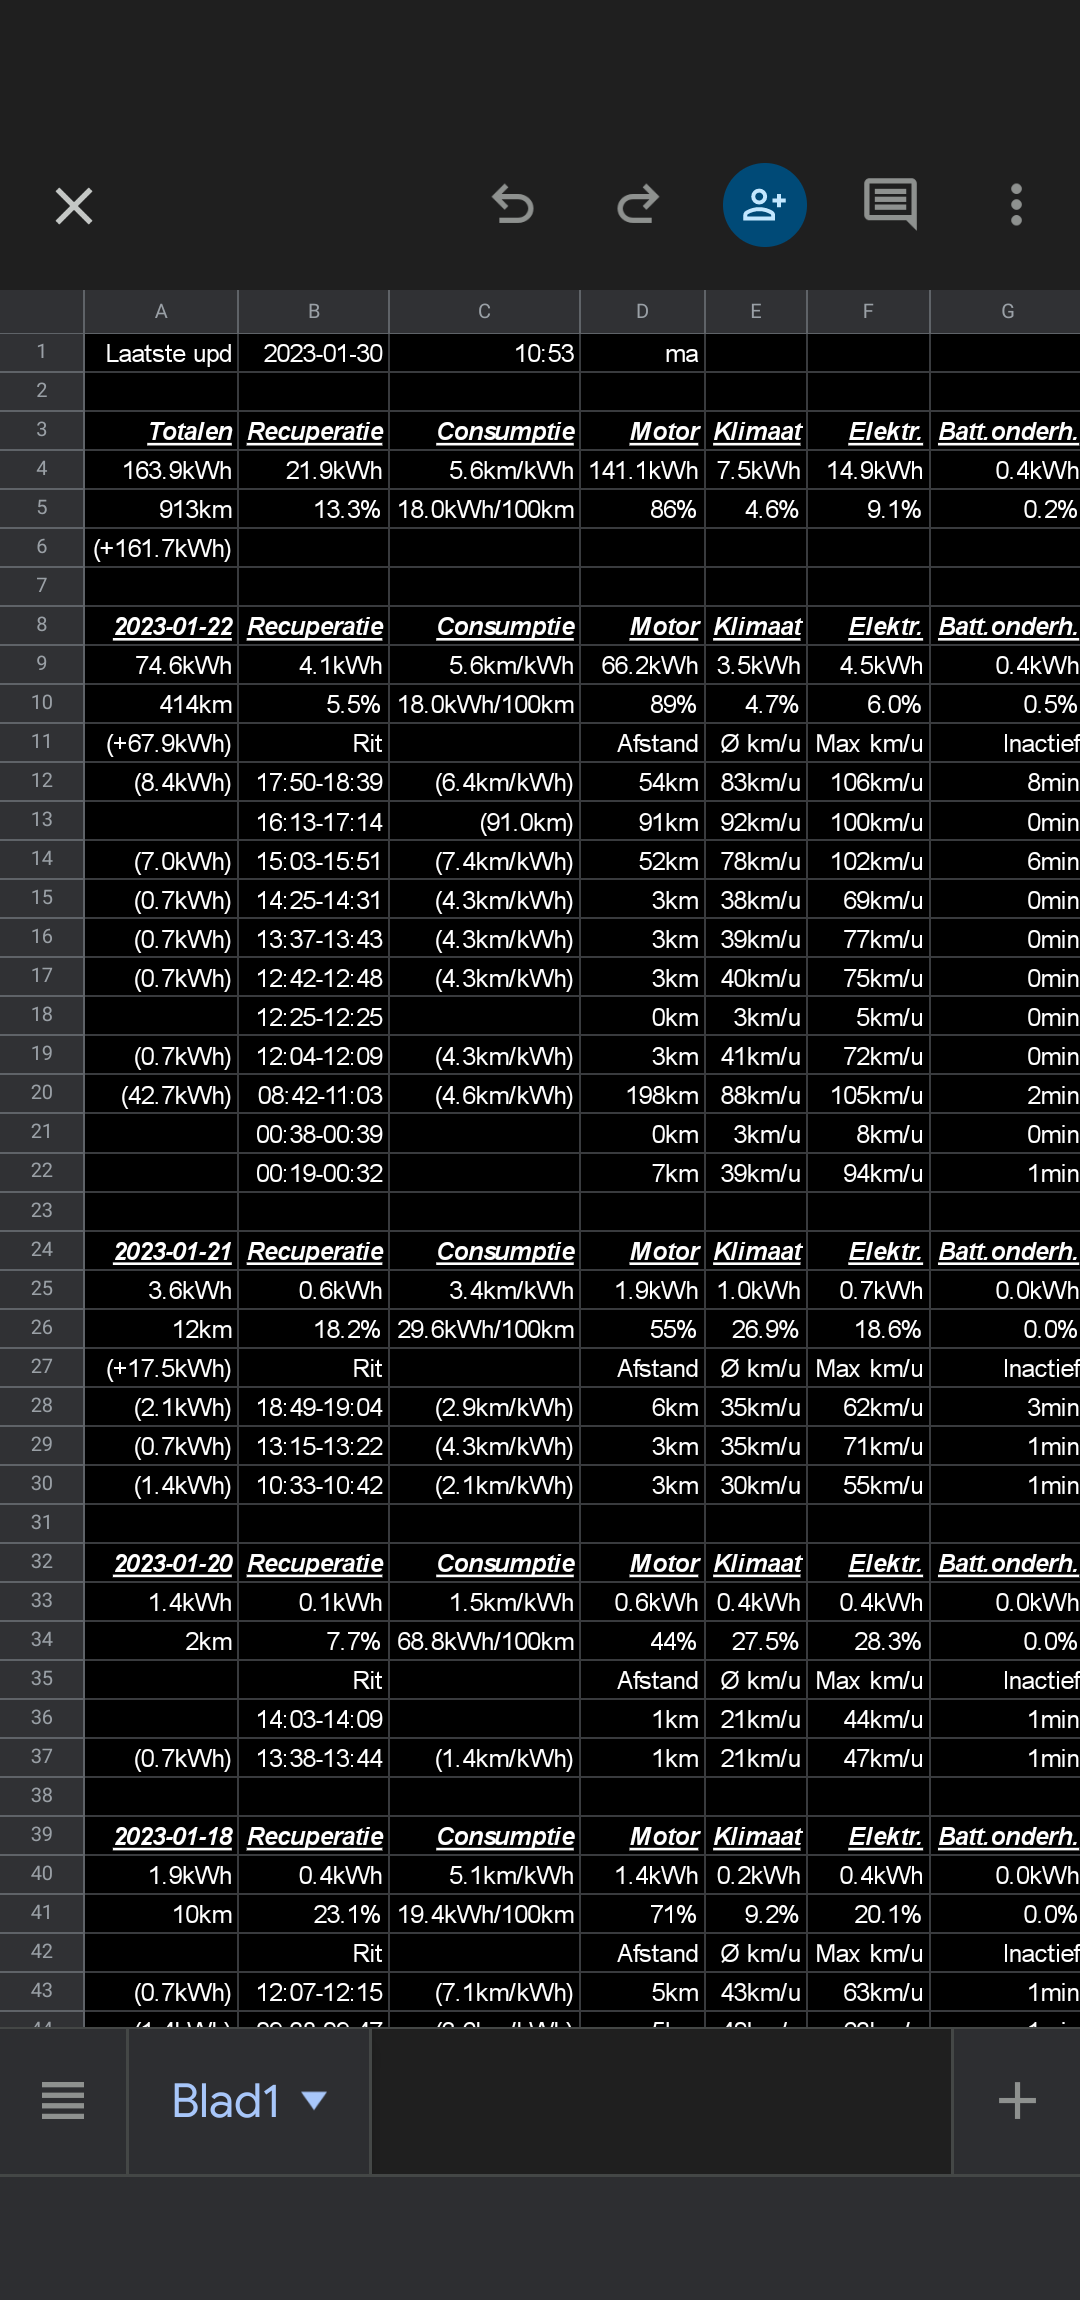
Screenshot of spreadsheet:
Dutch screenshot of spreadsheet:
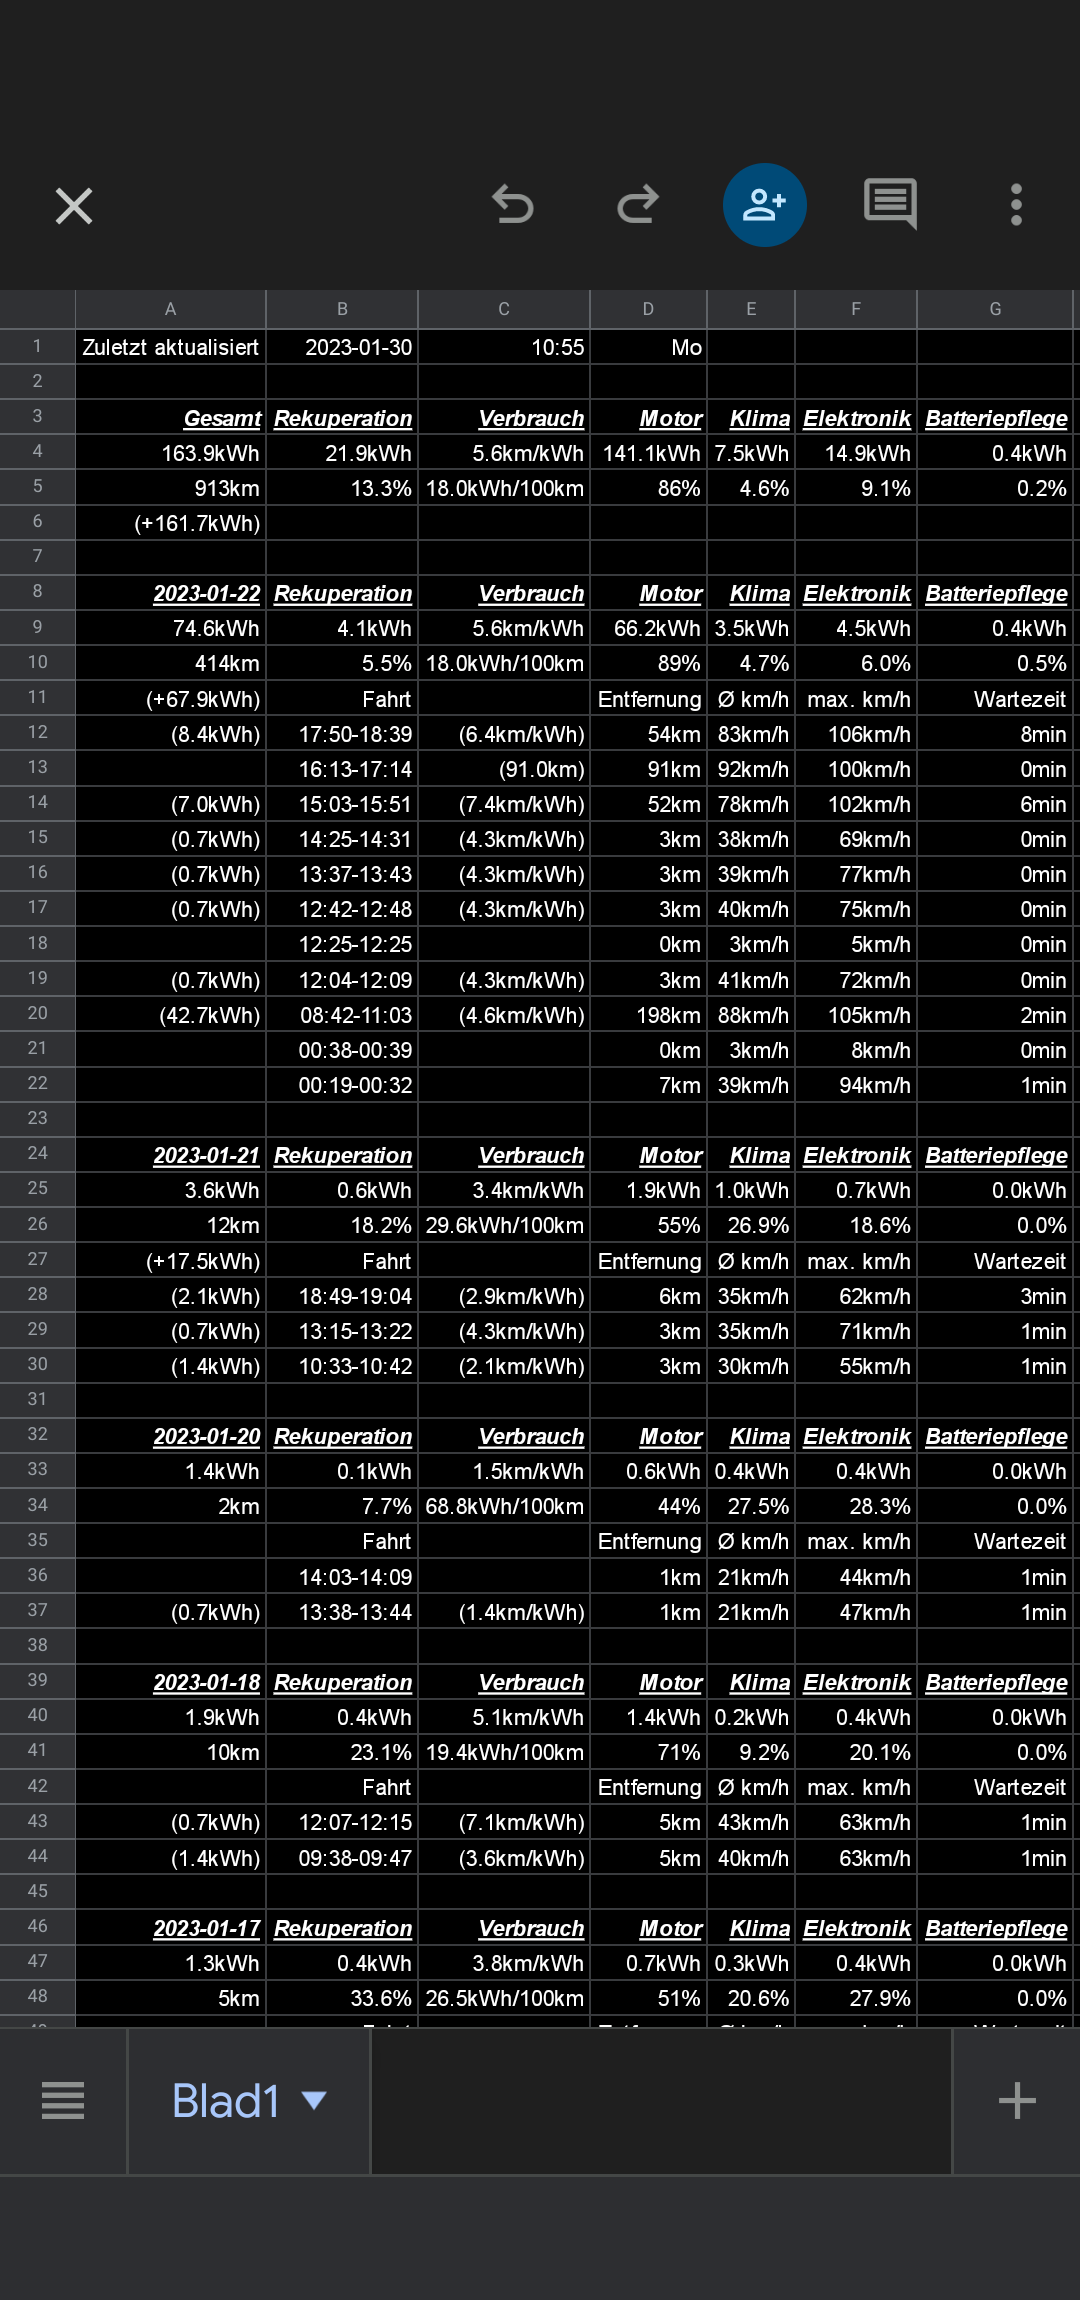
German screenshot of spreadsheet:
Example translations of standard output (only first line is not the finally translated one, your browser might not display the unicode characters correct):
- "en" English
- "de" German
- "fr" French
- "it" Italian
- "es" Spanish
- "sv" Swedish
- "nl" Dutch
- "no" Norwegian
- "cs" Czech (no translation yet)
- "sk" Slovak (no translation yet)
- "hu" Hungarian (no translation yet)
- "da" Danish
- "pl" Polish (no translation yet)
- "fi" Finnish
- "pt" Portuguese
python kml.py
Input is previous monitor.csv file.
C:\Users\Rick\git\monitor>python kml.py
  1: 20230113 09:04    (6.401608,51.934742) SOC: 60% 12V: 85% ODO: 22162.2 Address: 7;Kwakstraat; Duckstad; Nederland; 7054; AN
  2: 20230113 10:12    (6.401561,51.934731) SOC: 60% 12V: 85% ODO: 22163.4 Address: 9;Kwakstraat; Duckstad; Nederland; 7054; AN (+1.2 since 20230113 09:04)
  3: 20230113 13:01  D (6.401561,51.934731) SOC: 58% 12V: 86% ODO: 22163.4 Address: 9;Kwakstraat; Duckstad; Nederland; 7054; AN drive
  4: 20230113 13:50    (6.401561,51.934731) SOC: 58% 12V: 89% ODO: 22163.4 Address: 9;Kwakstraat; Duckstad; Nederland; 7054; AN
  5: 20230114 13:34    (5.135314,51.687433) SOC: 57% 12V: 90% ODO: 22165.5 Address: 33; Achterstraat; Drunen; Heusden; Noord-Brabant; Nederland; 5151 BT; Nederland (+2.1 since 20230113 13:50)
  6: 20230114 14:27    (6.401553,51.934731) SOC: 57% 12V: 89% ODO: 22167.5 Address: 9;Kwakstraat; Duckstad; Nederland; 7054; AN (+2.0 since 20230114 13:58)
  7: 20230115 13:41    (5.698608,51.244322) SOC: 35% 12V: 93% ODO: 22244.9 Address: 1; Het Dal; Parkhof; Weert; Limburg; Nederland; 6006 KV; Nederland (+77.4 since 20230114 14:27)
  8: 20230115 17:30 C  (5.696136,51.244042) SOC: 40% 12V: 91% ODO: 22245.5 Address: Keulerstraat; Parkhof; Weert; Limburg; Nederland; 6006 LA; Nederland (+0.6 since 20230115 13:41) charging plugged:1
  9: 20230115 18:15    (5.696136,51.244042) SOC: 83% 12V: 91% ODO: 22245.5 Address: Keulerstraat; Parkhof; Weert; Limburg; Nederland; 6006 LA; Nederland plugged:1
 10: 20230115 19:13    (6.401575,51.934731) SOC: 83% 12V: 91% ODO: 22323.0 Address: 9;Kwakstraat; Duckstad; Nederland; 7054; AN (+77.5 since 20230115 18:15) plugged:1
 11: 20230116 10:49    (5.131272,51.678608) SOC: 65% 12V: 91% ODO: 22327.1 Address: Drunen; Heusden; Noord-Brabant; Nederland; 5151 SM; Nederland (+4.1 since 20230115 19:17)
 12: 20230116 17:50    (6.401606,51.934739) SOC: 65% 12V: 76% ODO: 22328.6 Address: 7;Kwakstraat; Duckstad; Nederland; 7054; AN (+1.5 since 20230116 10:49)
 13: 20230117 14:54    (6.401578,51.934733) SOC: 63% 12V: 86% ODO: 22334.4 Address: 9;Kwakstraat; Duckstad; Nederland; 7054; AN (+5.8 since 20230116 17:50)
 14: 20230118 09:39  D (6.401578,51.934733) SOC: 61% 12V: 89% ODO: 22334.4 Address: 9;Kwakstraat; Duckstad; Nederland; 7054; AN drive
 15: 20230118 09:50    (5.152414,51.656597) SOC: 59% 12V: 89% ODO: 22339.5 Address: Giersbergen; Drunen; Heusden; Noord-Brabant; Nederland; 5151 RG; Nederland (+5.1 since 20230118 09:39)
 16: 20230118 12:15    (6.401569,51.934731) SOC: 59% 12V: 89% ODO: 22344.6 Address: 9;Kwakstraat; Duckstad; Nederland; 7054; AN (+5.1 since 20230118 09:50)
The kml output file monitor.kml
<?xml version="1.0" encoding="UTF-8"?>
<kml xmlns="http://www.opengis.net/kml/2.2">
<Document>
<name>monitor 20230119 08:31</name>
<Placemark><name>20230113 09:04</name><description>SOC: 60% 12V: 85% ODO: 22162.2 Address: 7;Kwakstraat; Duckstad; Nederland; 7054; AN</description><Point><coordinates>6.401608, 51.934742</coordinates></Point></Placemark>
<Placemark><name>20230113 10:12</name><description>SOC: 60% 12V: 85% ODO: 22163.4 Address: 9;Kwakstraat; Duckstad; Nederland; 7054; AN (+1.2 since 20230113 09:04)</description><Point><coordinates>6.401561, 51.934731</coordinates></Point></Placemark>
<Placemark><name>20230113 13:01  D</name><description>SOC: 58% 12V: 86% ODO: 22163.4 Address: 9;Kwakstraat; Duckstad; Nederland; 7054; AN drive</description><Point><coordinates>6.401561, 51.934731</coordinates></Point></Placemark>
<Placemark><name>20230113 13:50</name><description>SOC: 58% 12V: 89% ODO: 22163.4 Address: 9;Kwakstraat; Duckstad; Nederland; 7054; AN</description><Point><coordinates>6.401561, 51.934731</coordinates></Point></Placemark>
<Placemark><name>20230114 13:34</name><description>SOC: 57% 12V: 90% ODO: 22165.5 Address: 33; Achterstraat; Drunen; Heusden; Noord-Brabant; Nederland; 5151 BT; Nederland (+2.1 since 20230113 13:50)</description><Point><coordinates>5.135314, 51.687433</coordinates></Point></Placemark>
<Placemark><name>20230114 14:27</name><description>SOC: 57% 12V: 89% ODO: 22167.5 Address: 9;Kwakstraat; Duckstad; Nederland; 7054; AN (+2.0 since 20230114 13:58)</description><Point><coordinates>6.401553, 51.934731</coordinates></Point></Placemark>
<Placemark><name>20230115 13:41</name><description>SOC: 35% 12V: 93% ODO: 22244.9 Address: 1; Het Dal; Parkhof; Weert; Limburg; Nederland; 6006 KV; Nederland (+77.4 since 20230114 14:27)</description><Point><coordinates>5.698608, 51.244322</coordinates></Point></Placemark>
<Placemark><name>20230115 17:30 C</name><description>SOC: 40% 12V: 91% ODO: 22245.5 Address: Keulerstraat; Parkhof; Weert; Limburg; Nederland; 6006 LA; Nederland (+0.6 since 20230115 13:41) charging plugged:1</description><Point><coordinates>5.696136, 51.244042</coordinates></Point></Placemark>
<Placemark><name>20230115 18:15</name><description>SOC: 83% 12V: 91% ODO: 22245.5 Address: Keulerstraat; Parkhof; Weert; Limburg; Nederland; 6006 LA; Nederland plugged:1</description><Point><coordinates>5.696136, 51.244042</coordinates></Point></Placemark>
<Placemark><name>20230115 19:13</name><description>SOC: 83% 12V: 91% ODO: 22323.0 Address: 9;Kwakstraat; Duckstad; Nederland; 7054; AN (+77.5 since 20230115 18:15) plugged:1</description><Point><coordinates>6.401575, 51.934731</coordinates></Point></Placemark>
<Placemark><name>20230116 10:49</name><description>SOC: 65% 12V: 91% ODO: 22327.1 Address: Drunen; Heusden; Noord-Brabant; Nederland; 5151 SM; Nederland (+4.1 since 20230115 19:17)</description><Point><coordinates>5.131272, 51.678608</coordinates></Point></Placemark>
<Placemark><name>20230116 17:50</name><description>SOC: 65% 12V: 76% ODO: 22328.6 Address: 7;Kwakstraat; Duckstad; Nederland; 7054; AN (+1.5 since 20230116 10:49)</description><Point><coordinates>6.401606, 51.934739</coordinates></Point></Placemark>
<Placemark><name>20230117 14:54</name><description>SOC: 63% 12V: 86% ODO: 22334.4 Address: 9;Kwakstraat; Duckstad; Nederland; 7054; AN (+5.8 since 20230116 17:50)</description><Point><coordinates>6.401578, 51.934733</coordinates></Point></Placemark>
<Placemark><name>20230118 09:39  D</name><description>SOC: 61% 12V: 89% ODO: 22334.4 Address: 9;Kwakstraat; Duckstad; Nederland; 7054; AN drive</description><Point><coordinates>6.401578, 51.934733</coordinates></Point></Placemark>
<Placemark><name>20230118 09:50</name><description>SOC: 59% 12V: 89% ODO: 22339.5 Address: Giersbergen; Drunen; Heusden; Noord-Brabant; Nederland; 5151 RG; Nederland (+5.1 since 20230118 09:39)</description><Point><coordinates>5.152414, 51.656597</coordinates></Point></Placemark>
<Placemark><name>20230118 12:15</name><description>SOC: 59% 12V: 89% ODO: 22344.6 Address: 9;Kwakstraat; Duckstad; Nederland; 7054; AN (+5.1 since 20230118 09:50)</description><Point><coordinates>6.401569, 51.934731</coordinates></Point></Placemark>
</Document>
</kml>
Screenshot after imported into Google My Maps (yes, I have adjusted the locations for privacy):
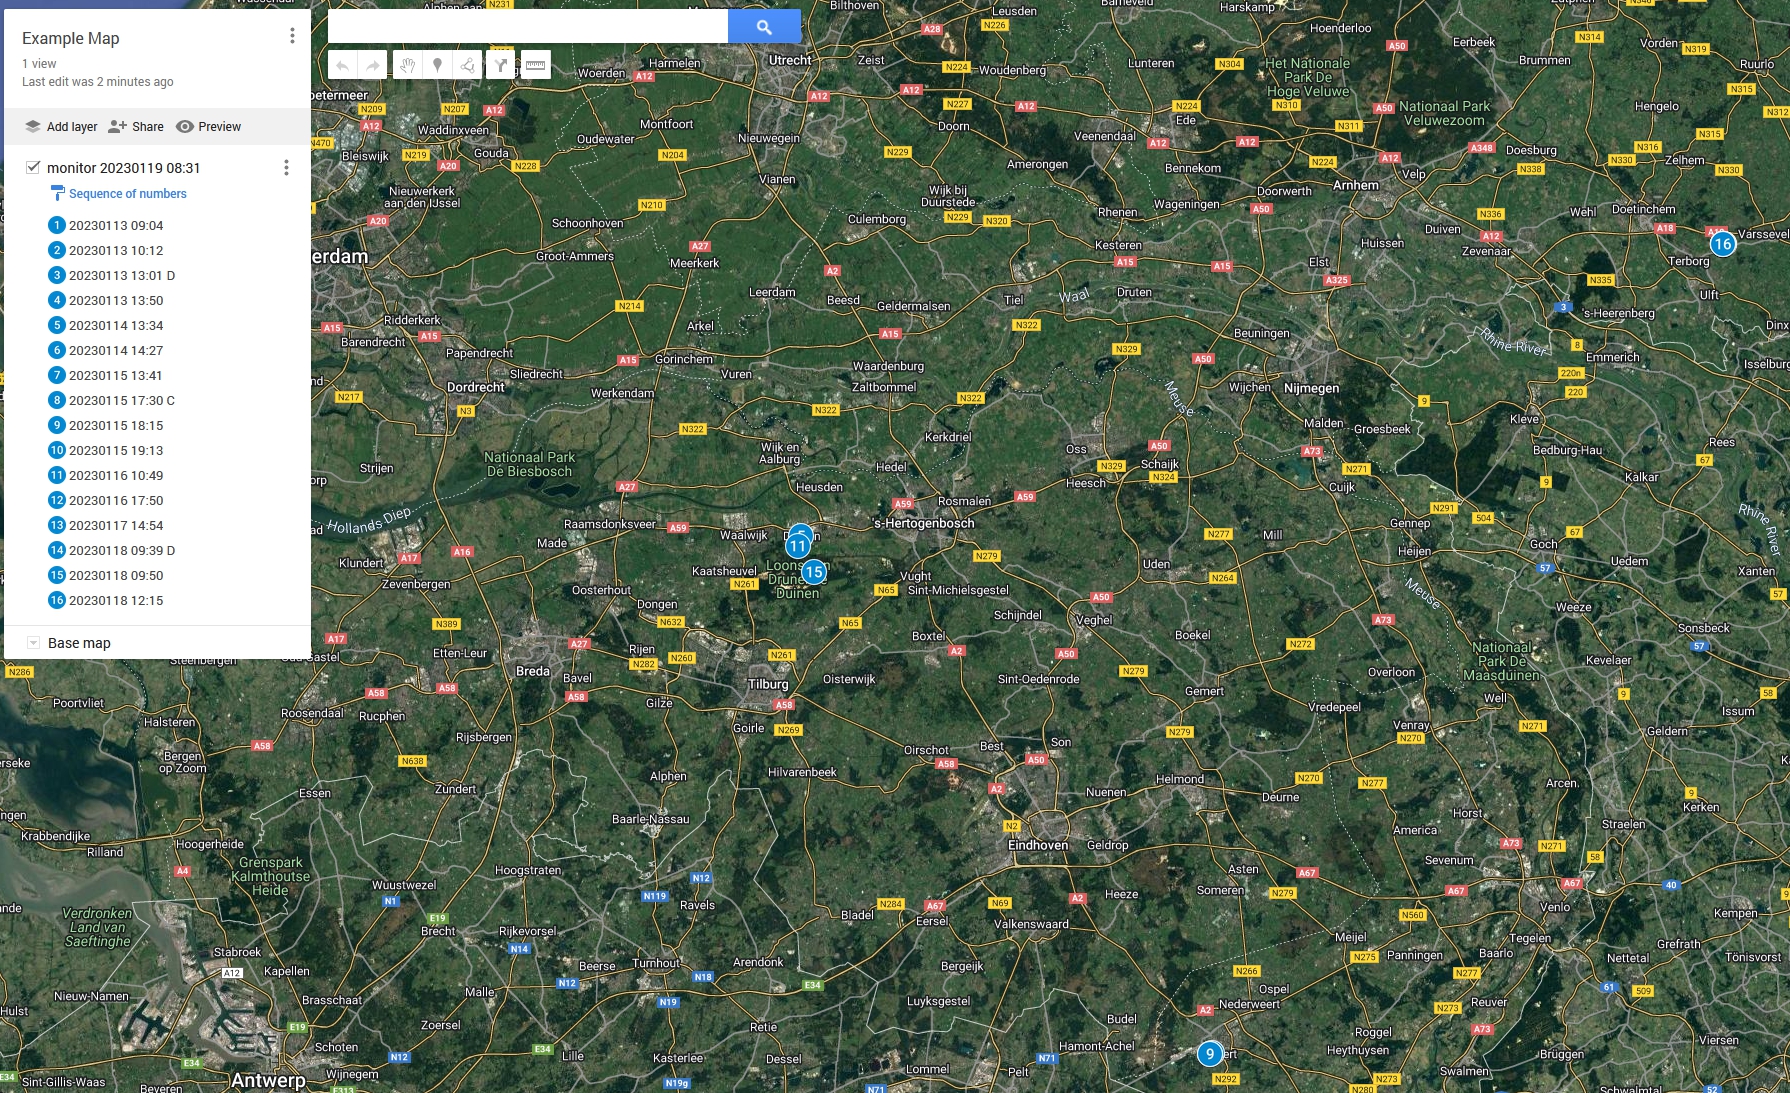
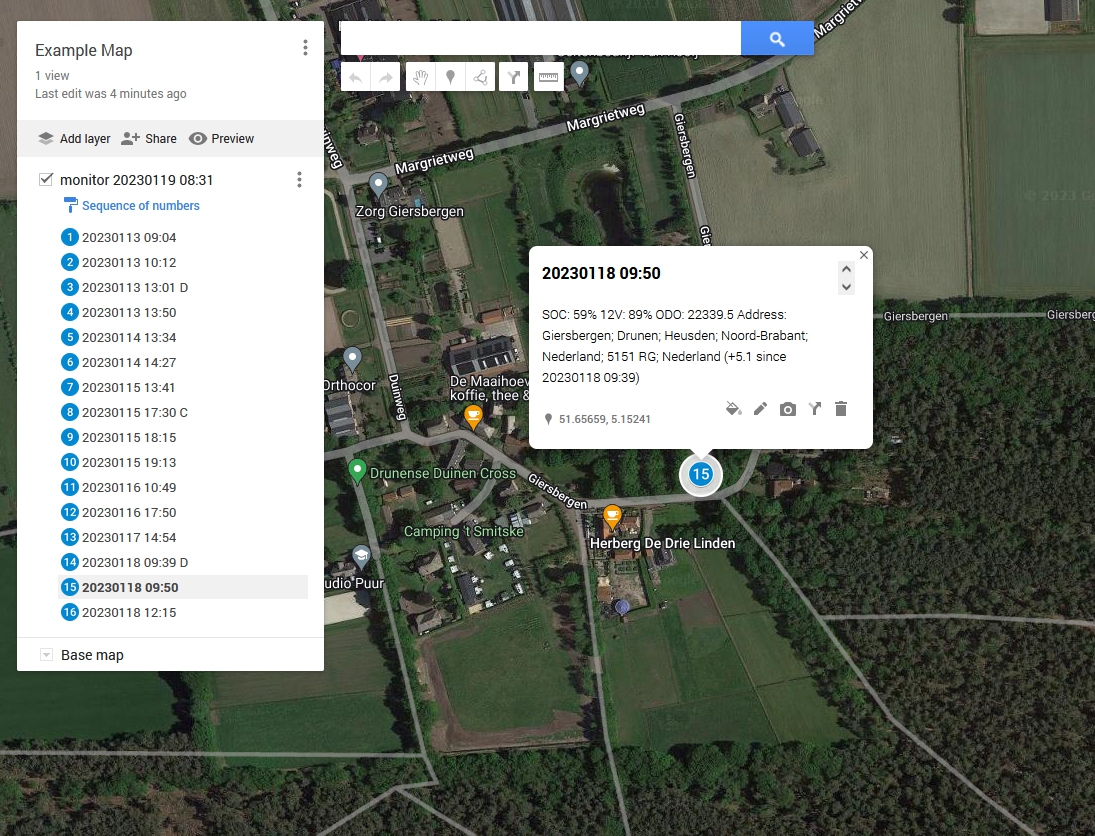
I changed the style to "sequence numbering" so you see the order of locations in the map. You can also adjust the base map, so less information is shown, but your locations are better visible. You can also view the Google My Map in Google Earth (via the Google My Maps menu) and zoom in interactively to the different locations.
python shrink.py
Example (based on earlier monitor.csv) outputfile shrinked_monitor.csv
datetime, longitude, latitude, engineOn, 12V%, odometer, SOC%, charging, plugged, address, EV range
2023-01-13 09:04:04+01:00, 6.401608, 51.934742, False, 85, 22162.2, 60, False, 0, 7;Kwakstraat; Duckstad; Nederland; 7054; AN, 221
2023-01-13 10:12:13+01:00, 6.401561, 51.934731, False, 85, 22163.4, 60, False, 0, 9;Kwakstraat; Duckstad; Nederland; 7054; AN, 221
2023-01-13 10:15:25+01:00, 6.401561, 51.934731, False, 85, 22163.4, 58, False, 0, 9;Kwakstraat; Duckstad; Nederland; 7054; AN, 223
2023-01-13 13:01:22+01:00, 6.401561, 51.934731, True, 86, 22163.4, 58, False, 0, 9;Kwakstraat; Duckstad; Nederland; 7054; AN, 223
2023-01-13 13:16:22+01:00, 6.401561, 51.934731, True, 87, 22163.4, 58, False, 0, 9;Kwakstraat; Duckstad; Nederland; 7054; AN, 222
2023-01-13 13:31:23+01:00, 6.401561, 51.934731, True, 88, 22163.4, 58, False, 0, 9;Kwakstraat; Duckstad; Nederland; 7054; AN, 222
2023-01-13 13:50:26+01:00, 6.401561, 51.934731, False, 89, 22163.4, 58, False, 0, 9;Kwakstraat; Duckstad; Nederland; 7054; AN, 222
2023-01-14 13:34:53+01:00, 5.135314, 51.687433, False, 90, 22165.5, 57, False, 0, 33; Achterstraat; Drunen; Heusden; Noord-Brabant; Nederland; 5151 BT; Nederland, 217
2023-01-14 14:27:22+01:00, 6.401553, 51.934731, False, 89, 22167.5, 57, False, 0, 9;Kwakstraat; Duckstad; Nederland; 7054; AN, 205
2023-01-15 13:41:01+01:00, 5.698608, 51.244322, False, 93, 22244.9, 35, False, 0, 1; Het Dal; Parkhof; Weert; Limburg; Nederland; 6006 KV; Nederland, 125
2023-01-15 17:30:04+01:00, 5.696136, 51.244042, False, 91, 22245.5, 40, True, 1, Keulerstraat; Parkhof; Weert; Limburg; Nederland; 6006 LA; Nederland, 147
2023-01-15 17:41:04+01:00, 5.696136, 51.244042, False, 91, 22245.5, 50, True, 1, Keulerstraat; Parkhof; Weert; Limburg; Nederland; 6006 LA; Nederland, 189
2023-01-15 18:01:29+01:00, 5.696136, 51.244042, False, 91, 22245.5, 70, True, 1, Keulerstraat; Parkhof; Weert; Limburg; Nederland; 6006 LA; Nederland, 273
2023-01-15 18:15:07+01:00, 5.696136, 51.244042, False, 91, 22245.5, 83, False, 1, Keulerstraat; Parkhof; Weert; Limburg; Nederland; 6006 LA; Nederland, 331
2023-01-15 19:13:56+01:00, 6.401575, 51.934731, False, 91, 22323, 83, False, 1, 9;Kwakstraat; Duckstad; Nederland; 7054; AN, 331
2023-01-15 19:17:20+01:00, 6.401575, 51.934731, False, 95, 22323, 67, False, 0, 9;Kwakstraat; Duckstad; Nederland; 7054; AN, 255
2023-01-16 10:49:02+01:00, 5.131272, 51.678608, False, 91, 22327.1, 65, False, 0, Drunen; Heusden; Noord-Brabant; Nederland; 5151 SM; Nederland, 243
2023-01-16 17:50:02+01:00, 6.401606, 51.934739, False, 76, 22328.6, 65, False, 0, 7;Kwakstraat; Duckstad; Nederland; 7054; AN, 241
2023-01-17 14:54:06+01:00, 6.401578, 51.934733, False, 86, 22334.4, 63, False, 0, 9;Kwakstraat; Duckstad; Nederland; 7054; AN, 228
2023-01-18 09:39:03+01:00, 6.401578, 51.934733, True, 89, 22334.4, 61, False, 0, 9;Kwakstraat; Duckstad; Nederland; 7054; AN, 209
2023-01-18 09:50:49+01:00, 5.152414, 51.656597, False, 89, 22339.5, 59, False, 0, Giersbergen; Drunen; Heusden; Noord-Brabant; Nederland; 5151 RG; Nederland, 223
2023-01-18 12:15:04+01:00, 6.401569, 51.934731, False, 89, 22344.6, 59, False, 0, 9;Kwakstraat; Duckstad; Nederland; 7054; AN, 223
2023-01-18 12:19:00+01:00, 6.401569, 51.934731, False, 88, 22344.6, 58, False, 0, 9;Kwakstraat; Duckstad; Nederland; 7054; AN, 202
Because monitor.py is now only adding lines when they are different, the difference is in this example only one line.
Development Environment
- I develop on Windows 10 and the tools are run on my Raspberry Pi, with python 3.9.*
- on Windows 10 I use the free Visual Studio Code version with python plugins.
- configured pylint and flake8 for static checking
- files are saved with Black with the default linelength of 88
- flake8 linelength is set to value of 88, same as Black
- pylint linelength has been set to 999, because flake8 already complains about that
- source code sometimes suppresses warnings
- source code has type hints, which are manually checked with mypy
- tests are checking results on larger input data with expected output
- I did not use classes (for now), but created smaller tools, which can be combined together
- to optimize running the tools, I use the following lazy evaluation pattern when no debug (D is False) is executed:
_ = D and dbg(f"some formatting") - because D evaluates to False the formatting evaluation and calling dbg() method is not executed
FAQ
How often should I run the tools:
- this depends on your usage pattern
- if you are only interested in daily statistics and trip info from the car, you only need to run monitor.py once a day, because it will retrieve the daily stats and trip stats from the server
- if you want to capture charging sessions, then you need to run monitor.py before the charging session and after the charging session. If you only charge in the night, then twice is sufficient (in the evening once before charging and in the morning once before leaving with the car)
- If you want the latest information of the car (e.g. battery percentage) to be send to the bluelink server, do a refresh status in the bluelink App and thereafter run monitor.py
- if you also want to catch trip consumption figures and charging sessions during the day with summary.py, you need to run monitor.py as often as is allowed with the API call limit, e.g. I run monitor.py once per 15 minutes between 6:00 and 22:00
Why are regularly exceptions thrown when running monitor.py?
- The hyundai_kia_connect_api gives regularly exceptions, see this issue 62
- The retry mechanism (wait one minute and retry twice) seems a good workaround
- When generic exceptions occur, a stacktrace will be printed too, to better pinpoint the problem
What happens if the number of calls allowed per day have been exceeded?
- an exception will be thrown and no entry will appear in monitor.csv
- you will also not able to use Hyundai Bluelink App or Kia Connect App anymore
- so be careful in the configuration of number of calls per day
Why is in summary.py ignore_small_positive_delta_soc and ignore_small_negative_delta_soc introduced?
- I have seen small drops and increases of SOC% (on my IONIQ 5 around 1% to 2%), because of temperature changes between e.g. evening and morning, I made this configurable via summary.cfg
Why is my trip not detected in summary.py?
- monitor.py makes a snapshot of the latest server values at the time run, if two trips are made between 2 snapshots this will not be detected
Why is the charge not or incorrectly detected in summary.py?
- monitor.py makes a snapshot of the latest server values at the time run, if a charging session is ended and a trip is started immediately before a snapshot is made, the SOC will already be decreased by driving.
Why are summary.py consumption values not always accurate?
- Small trips will give inaccurate consumption figures, on the IONIQ 5 1% SOC difference is 0.7 kWh difference, so I made the minimum kWh consumption configurable via summary.cfg. A Smaller battery will have better accuracy, because 1% of e.g. 27 kWh makes 0.27 kWh delta's instead of 0.7 kWh in my case
- I have seen once that SOC was reported wrongly in monitor.csv as zero, in summary.py I corrected this when the previous SOC% was not zero and delta is greater than 5
- Sometimes the SOC% is not yet updated by the server, while the odometer is, so the consumption figures might be incorrect for a detected trip
What is the difference between dailystats.py and summary.py?
- dailystats.py (Europe only) shows the car recorded trip info and daily stats, which are more accurate and also tries to match/show summary trip info
- summary.py is less accurate, because it tries to determine the information between snapshots, so information can be missed, especially when longer intervals are used