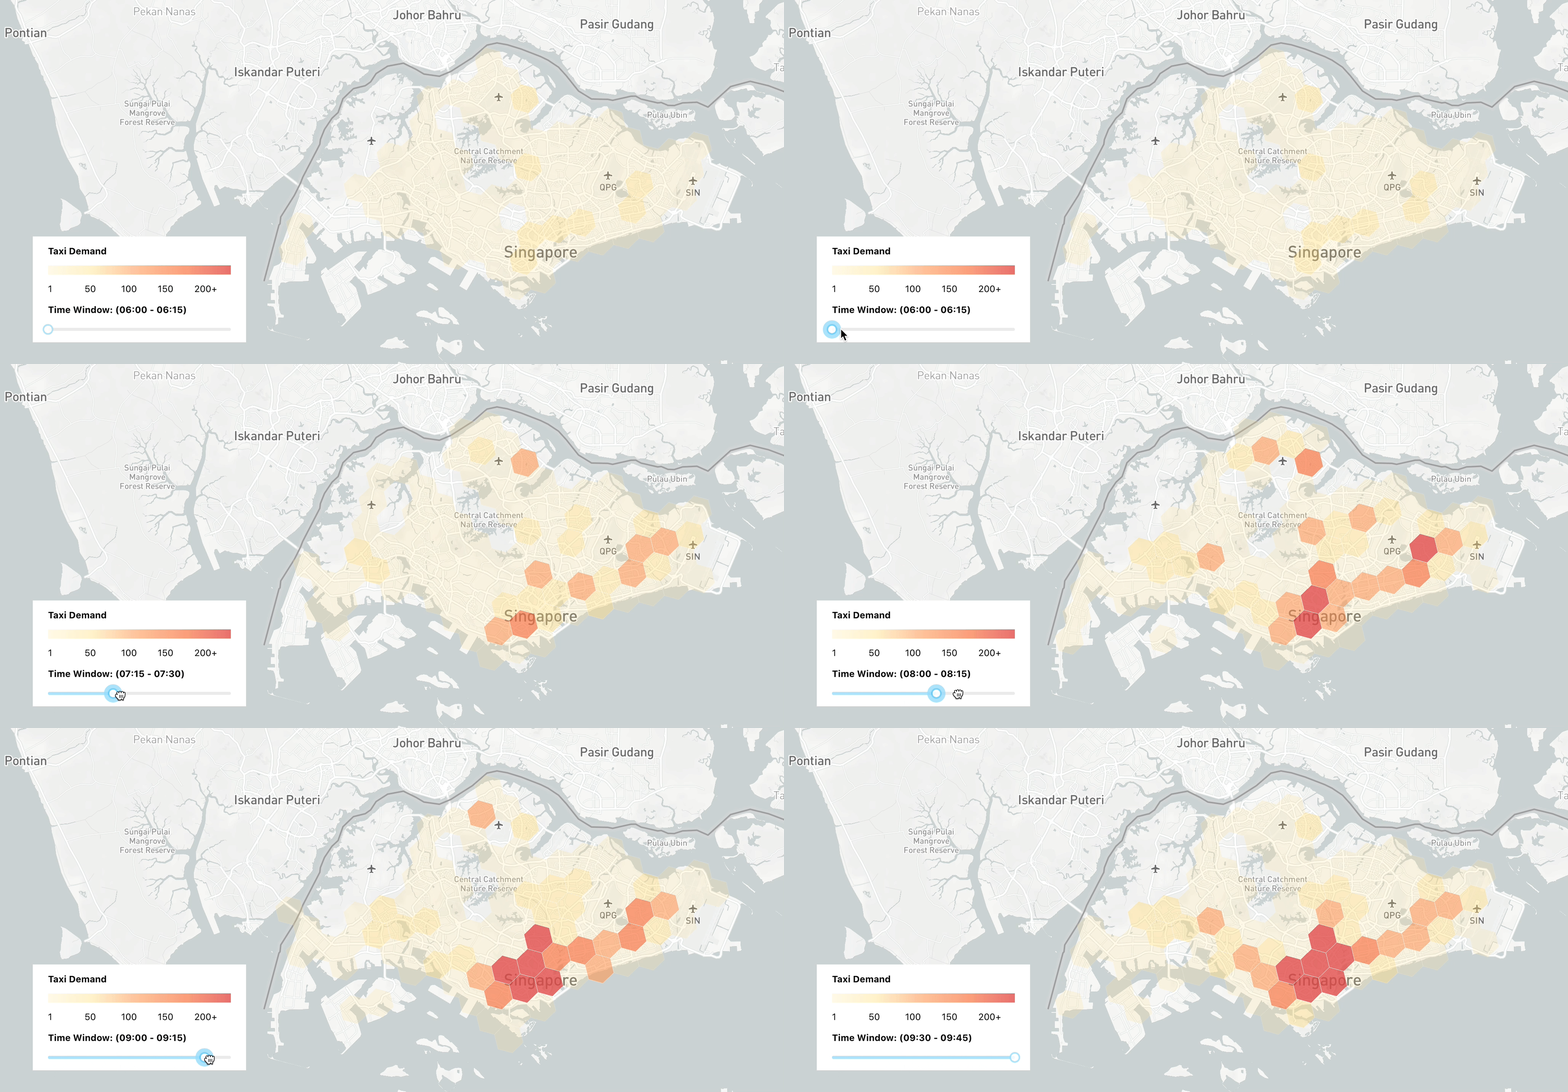
h3js_hexagons_taxi_demand_time_slider

Taken from:
- Uber h3 js tutorial: How to draw hexagons on a map (part 1 of 3)
- Mapping taxi demand with Uber h3 js and react map gl (part 2 of 3)
-
Visualizing taxi demand over time with Mapbox and React range slider rc slider (part 3 of 3)
How to run the app:
- cd into your project
- Open terminal and run 'npm install' (this will install the required dependencies)
- Run
npm start
Please contact afian@afi.io if you have any questions or suggestions. Pull requests are welcome.