Yellow Taxi Trips Data Analytics | Data Engineering Azure Project


Introduction
The "Yellow Taxi Trips Data Analytics" project uses modern technology and data analysis to extract valuable insights from New York City's yellow taxi trip records. I'm employing a range of advanced tools like Python, SQL, Azure services, and Power BI to process, analyze, and visualize the data.
Architecture

Technologies Used
- Python
- SQL
- Azure Data Factory
- Azure Data Bricks
- Azure Synapse Analytics
- Power BI
Dataset Used
- Source : https://www.nyc.gov/site/tlc/about/tlc-trip-record-data.page
- Data Dictionary : https://www.nyc.gov/assets/tlc/downloads/pdf/data_dictionary_trip_records_yellow.pdf
The data is separated by months for each year, so I created a simple Python script to download all the Parquet files and combine them by year. The dataset is stored in .parquet.gzip format to be cost-effective for storage. But since it were too large to be stored on GitHub (without Git LFS), reducing the file size and using CSV/Parquet format is the best solution by filtering the rows for this side project use. Here, first 20,000 rows randomly selected from each month will be used.
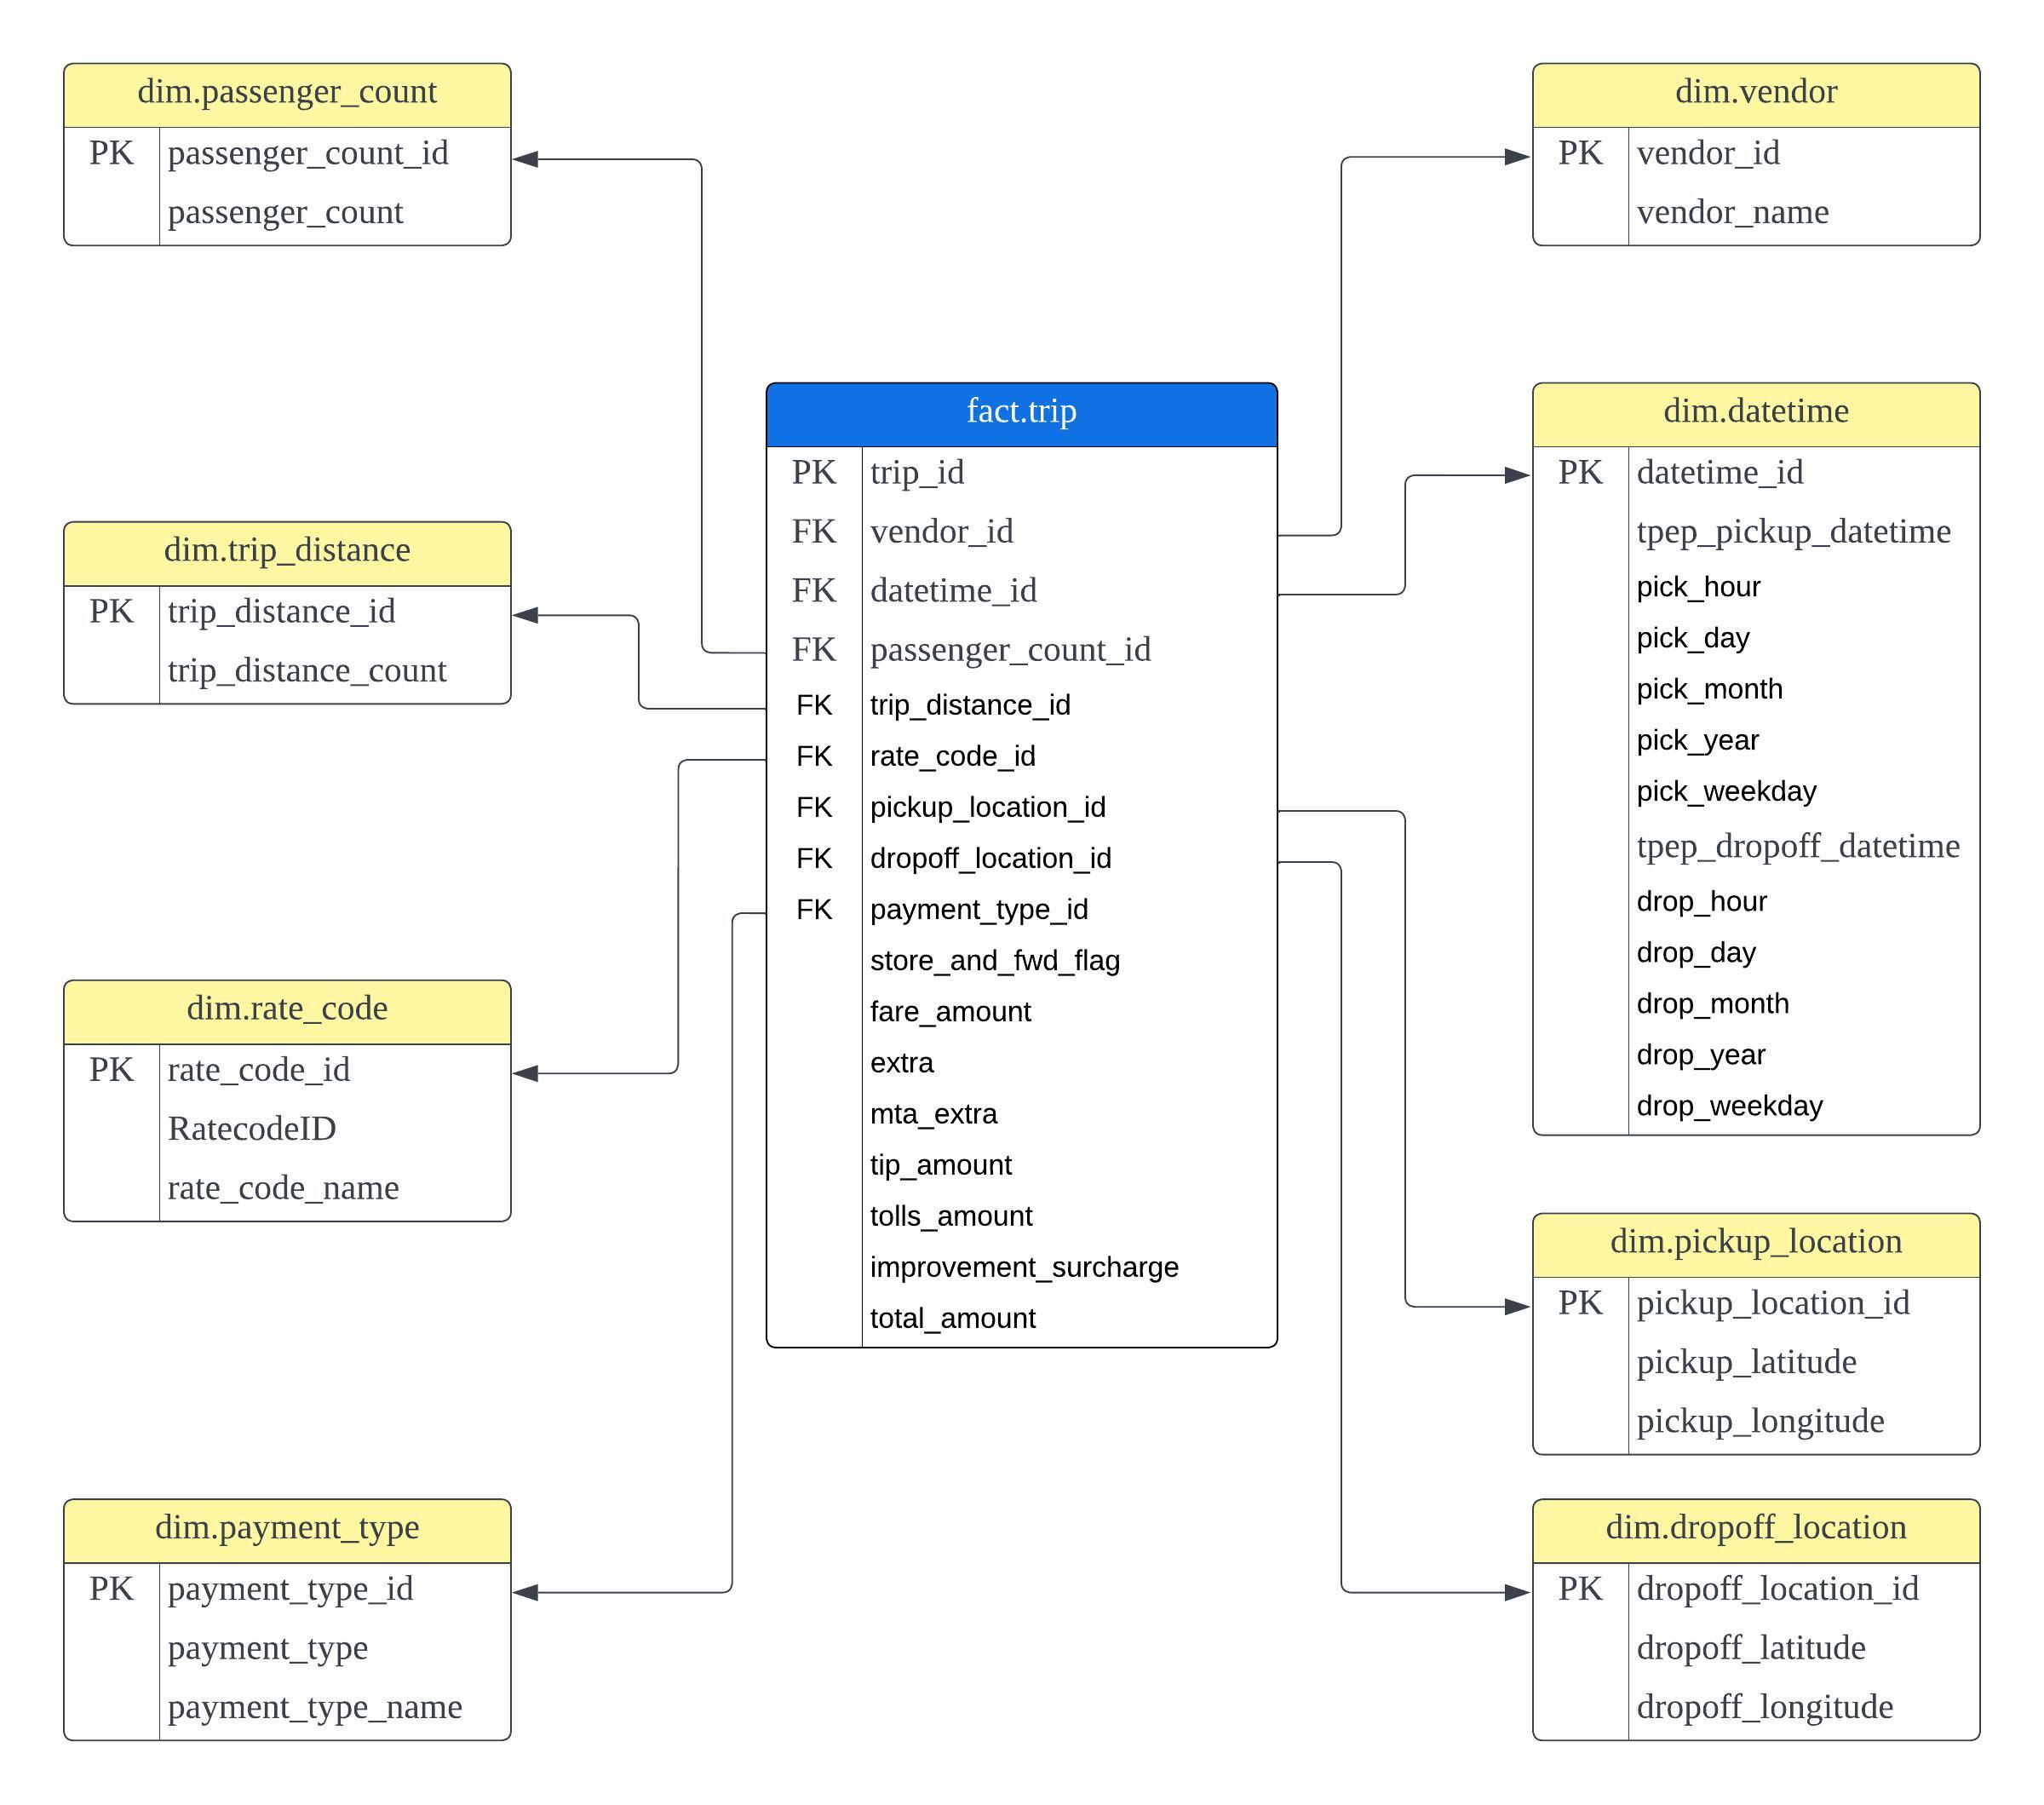
Data Model