altair-transform
Python evaluation of Altair/Vega-Lite transforms.
altair-transform requires Python 3.6 or later. Install with:
$ pip install altair_transformAltair-transform evaluates Altair and Vega-Lite transforms directly in Python. This can be useful in a number of contexts, illustrated in the examples below.
Example: Extracting Data
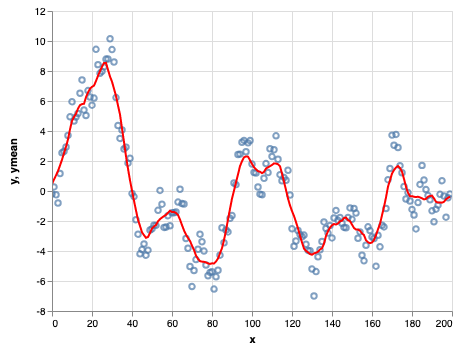
The Vega-Lite specification includes the ability to apply a wide range of transformations to input data within the chart specification. As an example, here is a sliding window average of a Gaussian random walk, implemented in Altair:
import altair as alt
import numpy as np
import pandas as pd

rand = np.random.RandomState(12345)

df = pd.DataFrame({
    'x': np.arange(200),
    'y': rand.randn(200).cumsum()
})

points = alt.Chart(df).mark_point().encode(
    x='x:Q',
    y='y:Q'
)

line = alt.Chart(df).transform_window(
    ymean='mean(y)',
    sort=[alt.SortField('x')],
    frame=[5, 5]
).mark_line(color='red').encode(
    x='x:Q',
    y='ymean:Q'
)

points + line
Because the transform is encoded within the renderer, however, the computed values are not directly accessible from the Python layer.
This is where altair_transform comes in. It includes a (nearly)
complete Python implementation of Vega-Lite's transform layer, so
that you can easily extract a pandas dataframe with the computed
values shown in the chart:
from altair_transform import extract_data
data = extract_data(line)
data.head()| x | y | ymean | |
|---|---|---|---|
| 0 | 0 | -0.204708 | 0.457749 |
| 1 | 1 | 0.274236 | 0.771093 |
| 2 | 2 | -0.245203 | 1.041320 |
| 3 | 3 | -0.800933 | 1.336943 |
| 4 | 4 | 1.164847 | 1.698085 |
From here, you can work with the transformed data directly in Python.
Example: Pre-Aggregating Large Datasets
Altair creates chart specifications containing the full dataset. The advantage of this is that the data used to make the chart is entirely transparent; the disadvantage is that it causes issues as datasets grow large. To prevent users from inadvertently crashing their browsers by trying to send too much data to the frontend, Altair limits the data size by default. For example, a histogram of 20000 points:
import altair as alt
import pandas as pd
import numpy as np

np.random.seed(12345)

df = pd.DataFrame({
    'x': np.random.randn(20000)
})
chart = alt.Chart(df).mark_bar().encode(
    alt.X('x', bin=True),
    y='count()'
)
chart
MaxRowsError: The number of rows in your dataset is greater than the maximum allowed (5000). For information on how to plot larger datasets in Altair, see the documentationThere are several possible ways around this, as mentioned in Altair's FAQ.
Altiar-transform provides another option via the transform_chart() function, which will pre-transform the data according to the chart specification, so that the final chart specification holds the aggregated data rather than the full dataset:
from altair_transform import transform_chart
new_chart = transform_chart(chart)
new_chart
Examining the new chart specification, we can see that it contains the pre-aggregated dataset:
new_chart.data| x_binned | x_binned2 | count | |
|---|---|---|---|
| 0 | -4.0 | -3.0 | 29 |
| 1 | -3.0 | -2.0 | 444 |
| 2 | -2.0 | -1.0 | 2703 |
| 3 | -1.0 | 0.0 | 6815 |
| 4 | 0.0 | 1.0 | 6858 |
| 5 | 1.0 | 2.0 | 2706 |
| 6 | 2.0 | 3.0 | 423 |
| 7 | 3.0 | 4.0 | 22 |
Limitations
altair_transform currently works only for non-compound charts; that is, it cannot transform or extract data from layered, faceted, repeated, or concatenated charts.
There are also a number of less-used transform options that are not yet fully supported. These should explicitly raise a NotImplementedError if you attempt to use them.

