Electron ProFile
Electron version of the popular ProFile web app. Currently Beta.

About
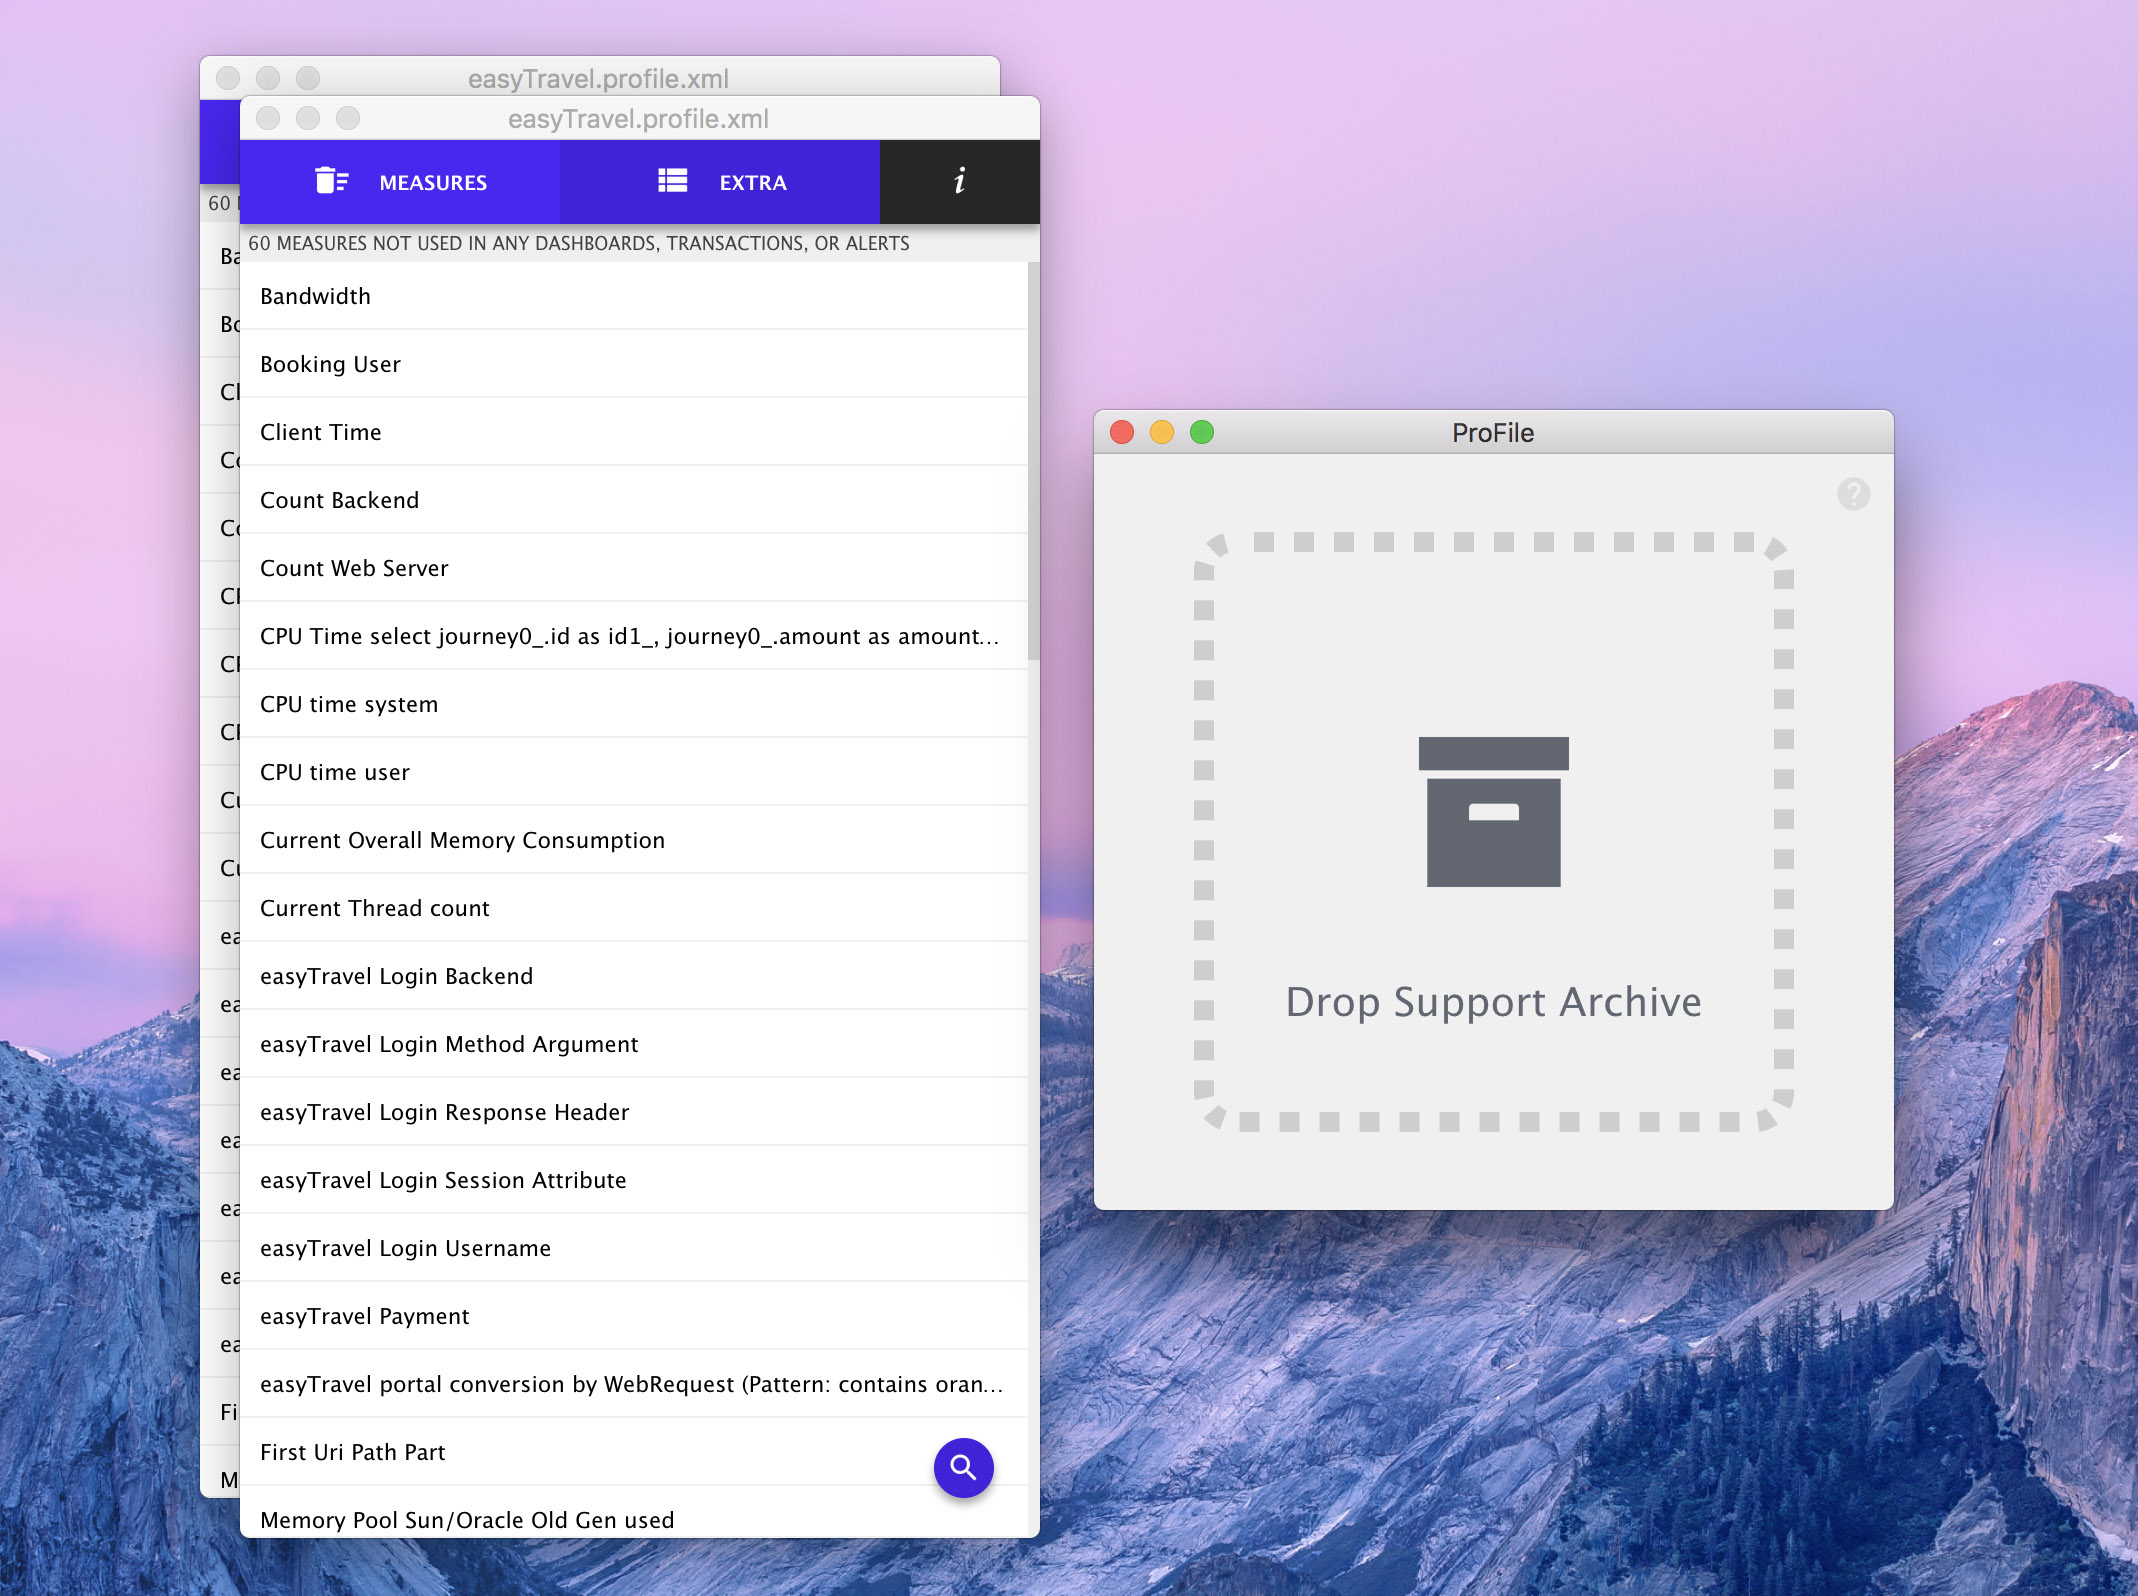
ProFile has been developed to help eliminate “measure explosion”, and to assist in the performance of the Dynatrace Server. The application will scan all the measures in each profile and find out if they are being used in any business transaction, incident, or dashboard. This information can then be used to clean up your system profile to reduce overhead and maintain a high performance server.
Features
- Drag and drop a Support Archive.
- Double click main window to browse for Support Archive.
- Click on a row to copy the text to your clipboard.
- Click on the search icon in the bottom right corner to open a filter for the main unused measures list.
- Click on the "EXTRAS" tab to see lists of Measures, Transactions, and Dashboards
- Click on the "i" tab to see stats about your server and system profile, and buttons to export the lists to text files.
Instructions
- Install/build the app with the build instructions, or download the binaries
- Drag a support archive into the main window, or double click the window to access the file dialog. An example support archive has been included in the
/exampledir. More information on Dynatrace AppMon support archives here: Getting Support. - Wait for the analysis to complete.
- Find the unused measures in the new modal window that appears. Each system profile detected by the application will get its own modal window.
- Clicking on a list item will add it to your clipboard.
NOTE: ProFile does not modify any system profiles. That is up to the Dynatrace Admin.
Build/Run locally
Dev
$ npm installRun
$ npm startBuild macOS
$ npm run build:osxBuild Windows
$ npm run build:winBuild Linux
$ npm run build:linuxBuilds the app for macOS, Linux, and Windows, using electron-packager. Linux is untested.