
📊 Nuxt 2 Analytics
Allows you to better understand what's going on with your application and how to optimize performance and other things in production
Features
- Default NodeJS metrics exported through the prometheus middleware
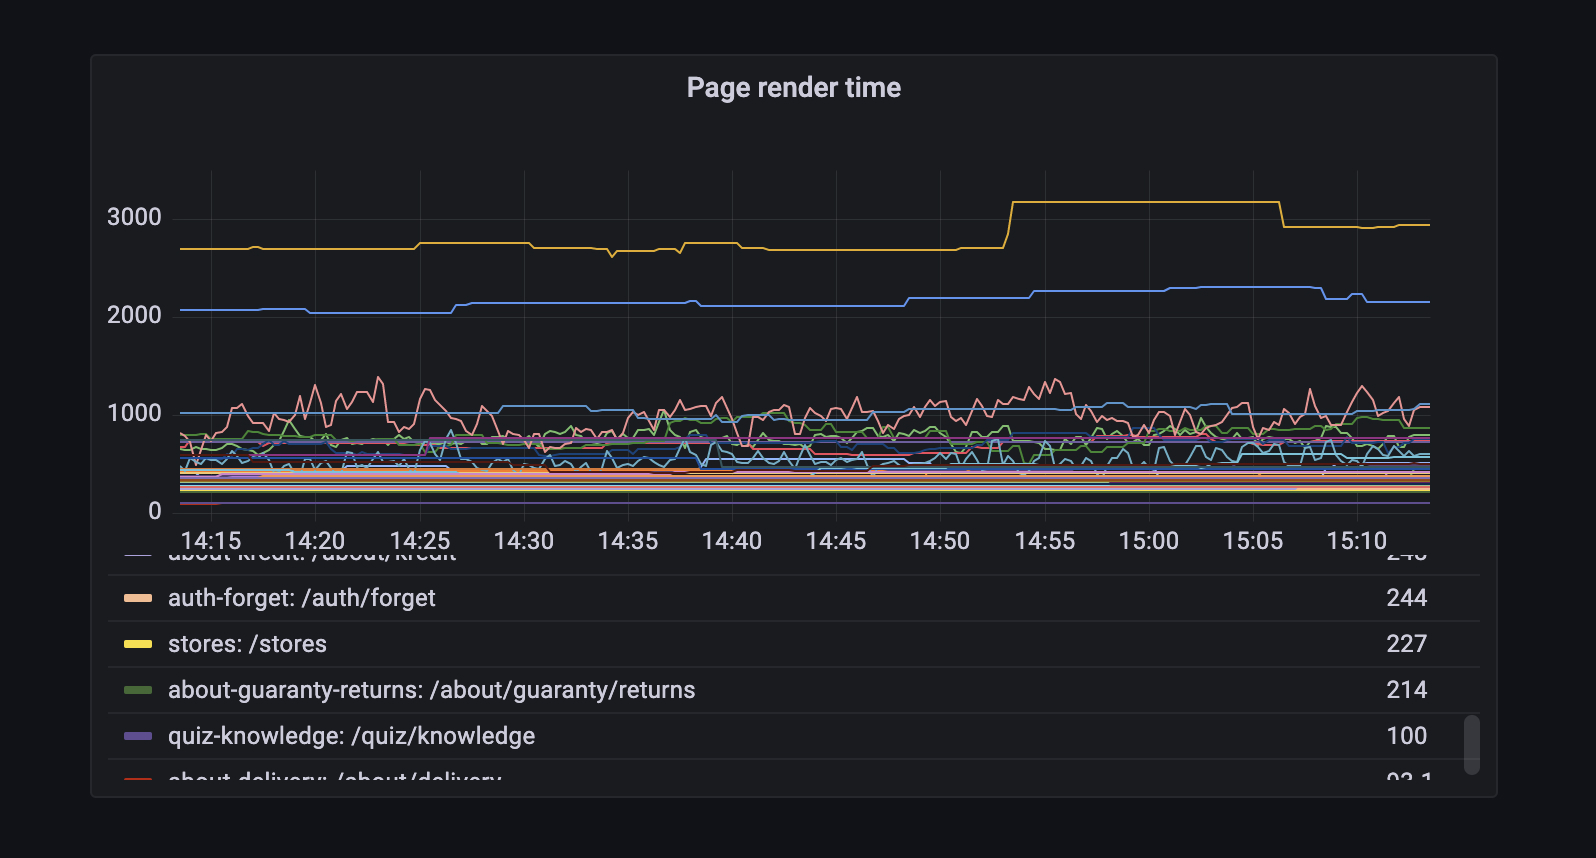
- Custom metrics about pages render time and external request consumption time
- Health check middleware
Default routes
/metrics- prometheus metrics/health- health check
Installation
Install package via a package manager:
# using npm
npm install --save-dev @artmizu/analytics-nuxt-2

# using yarm
yarn add -D @artmizu/analytics-nuxt-2

# using pnpm
pnpm add -D @artmizu/analytics-nuxt-2
Add it to a modules section of your nuxt config:
export default {
  modules: ['@artmizu/analytics-nuxt-2']
}
Grafana sample setup
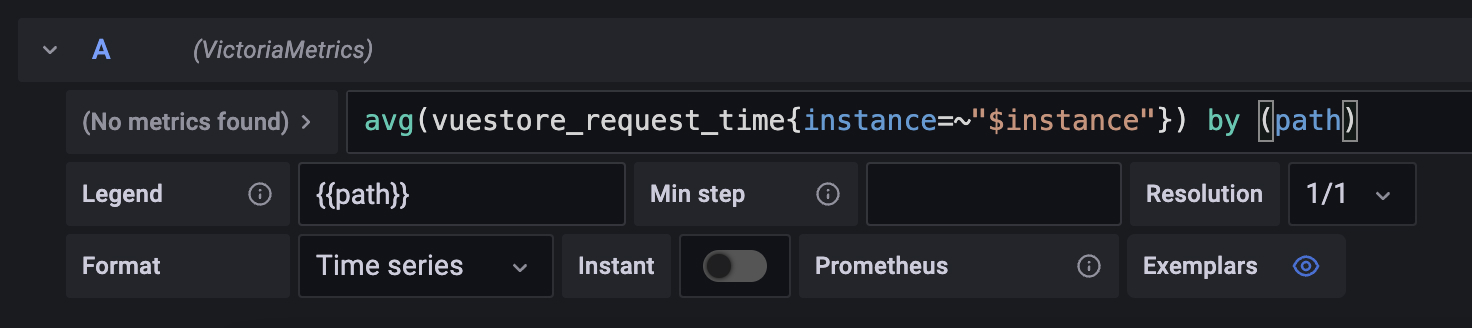
Once the metrics have been collected by Prometheus, you will want to review them. I use Grafana for this purpose, and my metrics setup looks something like this:
Options
You can pass it through module options and the nuxt config property analytics.
verbose
- Type:
boolean - Default:
true - Description: Additional logs in dev mode, about page rendering time and time of external API requests