PI Reporter
The Performance Insights Reporter tool captures snapshots of PI data and generates reports for single snapshots or compared across time periods.
The PI Reporter is a tool designed to significantly streamline the process of performance troubleshooting, right-sizing, and cost optimization exercises. It captures snapshots of performance insights (PI) data and generates reports for specific time frame and compare periods report for easy comparison between two time periods. The tool's functionalities include:
- Snapshot creation: Capturing a snapshot of a specified time range, with the data stored in a JSON file.
- HTML reports: Generating HTML reports for individual snapshots and for comparison of two snapshots.
New major version 2.0 released
The main feature of this version is integration with Amazon Bedrock to leverage the power of the Cloud 3 models for analyzing single snapshot and comparing snapshot reports, generating detailed report with summary (including root cause analyzes) and recommendations for all sections of the report. This will significantly help and save time during troubleshooting and report reading.
GenAI analyses can be optionally enabled during the report generation phase. The new attribute --ai-analyzes has been introduced for this purpose.
The pireporterPolicy.json file now includes a section that allows the InvokeModel action on the Cloud 3 Sonnet model. The account which will generate reports must enable access to the required Cloud 3 model. Use this guide to enable access: Model access
Be aware that using --ai-analyzes will incur additional charges. The tool will always print out the number of input and output tokens used to accomplish the analyses. It will help you estimate the cost.
Example:
$ ./pireporter --create-report --snapshot snapshot_apg-bm_20240424070000_20240424080000.json --ai-analyzes
LLM tokens used: { input_tokens: 35422, output_tokens: 6101 }
In the new conf.json file, some parameters related to GenAI, such as the AWS region and model ID, can be configured.
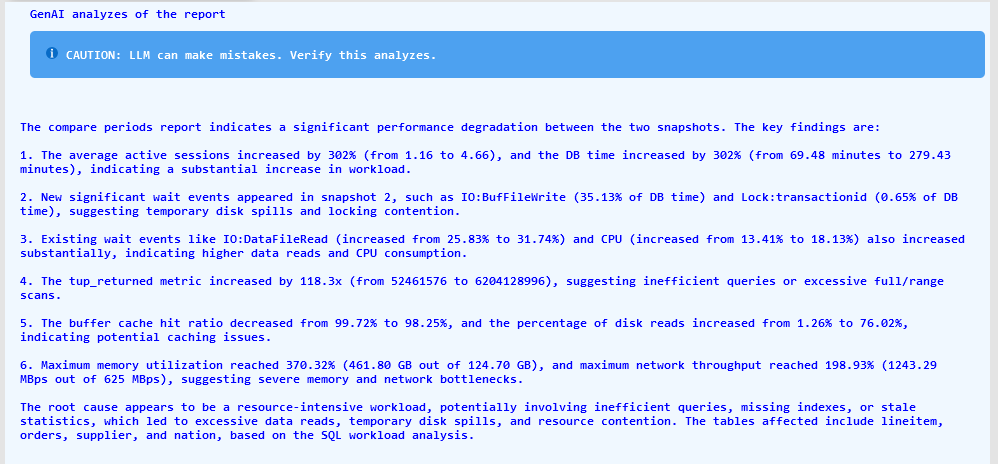
A new section named "GenAI Analyses of the Report" will appear at the top of the report. Check the screenshot below for an example.
Additionally, the comments associated with snapshots using the -m command-line argument will be considered by the LLM during analyzes. This provides a way to give the LLM a hint about a particular period or to include your observations, such as "Applications were hanging, and no DML transactions could be completed." You can always update the snapshot JSON file to change or add comments.
Some of the main benefits of the PI reporter are:
- In a few minutes get a report with all instance related information on one page. No need to go to different places and gather the data manually.
- Generate the compare period reports which are the most efficient and fast way to detect any changes in performance, workload, stats or configuration.
- Understand if the instance can handle the workload and if a right-sizing exercise is required for the instance.
- To provide instance, workload, and performance statistics to third parties like external support engineers or companies without giving them direct access to the system. This increases security while supplying the engineers with adequate information to make timely decisions.
- LLM analyzes of the report, including root cause of the problem if any and recommendations.
Functional capabilities:
The following data will be gathered into the snapshot files and represented in the reports::
- Snapshot metadata
- General details about the Aurora/RDS instance, such as instance name, DB instance class, parameter group, backup retention, cluster identifier, multi-AZ configuration, number of vCPUs, network performance, and more.
- Non-default parameters
- Instance activity statistics: Average Active Sessions, DBTime, wall clock time
- Top wait events during the snapshot period, indicating time spent and percentage of DBTime
- Operating system metrics, presented as either sum of values, average, minimum, or maximum values
- Database metrics, presented as sum, average, minimum, or maximum values
- Additional metrics derived from other statistics, such as tuples returned to tuples fetched ratio, actual network traffic as a percentage of instance limits, and comparisons to instance baseline network usage
- Instance recommendations: Based on workload analysis, the tool assesses the suitability of the current instance size and suggests up to three alternative instances that may better handle the workload. It presents the instance characteristics and percentage price difference compared to the current instance type for the recommendations. These recommendations serve as a starting point for further analysis, but do not constitute a final instance sizing decision.
- Metric correlations: Identifies metrics that exhibit similar highs and lows over time.
- SQL Insights: Presents top SQL queries ranked by load, read I/O, write I/O, and combined read-write I/O. Each SQL entry includes various statistics, additional information from pg_stat_statements, and wait events. It also displays the distribution of SQL load across different databases and users.
- Log File Analysis: The tool downloads and analyzes log files from the snapshot period, grouping and displaying error or fatal messages in the report if any are found.
- Compare Period Report: Enables comparison between two snapshots to quickly identify differences in metrics and SQL performance.
- GenAI analyzes of the report with summary of the possible root cause and recommendations.
Screenshots
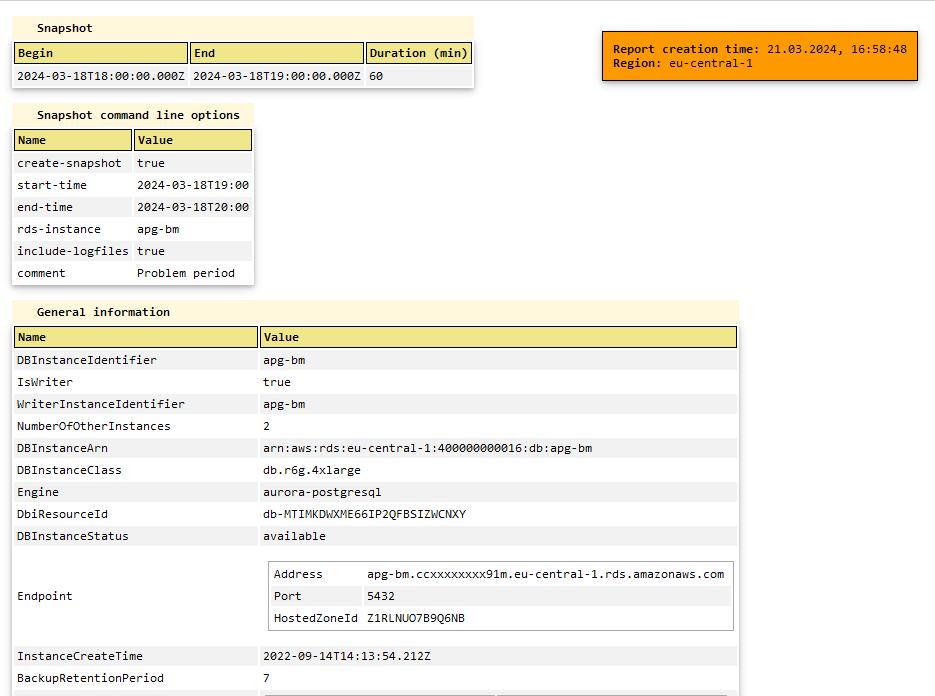
General information section:

Metrics calculated from other metrics and workload analysis section:

Next are parts of the compare periods report, where yellow represents snapshot 1 data, teal blue snapshot 2 data and green the difference.
Difference between two metrics represtend in three forms, for example +7.81 [1.1x|13%] provides three values:
-
7.81 represents the absolute difference or increase in the numerical value of the metric being compared.
-
1.1x represents the factor by which the metric has increased. So 1.1x means the new value is 1.1 times higher the previous value.
-
13% is the percentage increase in the metric's value.
So in this case, the metric increased by an absolute value of 7.81 units, which is a 1.1x or 13% increase over the previous value. The 7.81, 1.1x, and 13% all represent the same increase, just expressed in different ways (absolute, factor, and percentage respectively).


GenAI analyzes of the report:

How to use
PI Reporter was tested on Linux x86. To run the tool, you can start an EC2 instance with any x86 Linux OS.
Create an IAM Policy called pireporterPolicy.json which is part of this repository. You can modify the policy to add additional conditions if needed. Then, tag the database instance you plan to use with a tag that has the key pireporter and value allow.
Attach the pireporterPolicy to the instance role of the EC2 instance where you plan to run the tool.
There are two options to run pireporter:
- Clone this repo to local host and use node.js to execute the pireporter.js script. It requires connection to npm repositories and installation of packages and node.js itself.
cd pireporter
npm install
node pireporter.js --help- Use the portable packaged version which do not require any installations. The packaged version was created using pkg which is open-source tool published under MIT License.
cd portable
./pireporter --help
Note: For security reasons you can also clone the repository and install
pkgon a staging machine and build a packaged version yourself and then use it in your environment.
Consider that you can execute PIreporter from any Linux host located outside of AWS. For example, the access key and secret key can be stored in the shared credentials file ~/.aws/credentials. The AWS SDK used in PIreporter will automatically read it on load. For sure, the PIreporter policy must be attached to the IAM entity to which the access key applies.
AWS Region
The AWS Region will be automatically set to the region of the hosting EC2 instance, based on instance metadata retrieved through IMDSv2. You can overwrite this by setting the AWS_REGION environment variable to the desired value.
Security considerations
All the permissions required to run pireporter are read-only and include only the mandatory ones.
The IAM policy pireporterPolicy.json is attached to this repository.
The database log files will be downloaded and scanned for error messages if the --include-logfiles option is used.
According to the policy, only instances and clusters with the Tag pireporter:allow (Key: pireporter Value: allow) can be accessed. That is why, use tagging to control which database instances can be accessed by the tool.
Consider that the provided policy file can be modified by you. If you do not want to have a condition that checks for Tags, you can remove it before creating the policy or at any time afterward.
General considerations
PostgreSQL
For RDS PostgreSQL and Amazon Aurora with PostgreSQL compatibility, consider the following:
- Enable the
pg_stat_statementsextension to collect per-query statistics. This extension is enabled by default in Amazon Aurora with PostgreSQL compatibility. - By default, PostgreSQL databases truncate queries longer than 1,024 bytes. To increase the logged query size, change the
track_activity_query_sizeparameter in the DB parameter group associated with your database instance. When you change this parameter, an instance reboot is required. - By default, the
pg_stat_statements.trackparameter is set to the valueTOP, which means only top-level queries will be captured. To capture all queries like ones running from inside stored functions and procedures, set this parameter to the valueALL. - Important performance consideration! The
pg_stat_statementsextension uses a hash table in memory to store the query statistics. If there are more unique queries than available memory, then a locking mechanism will kick in which can lead to contention and performance problems. Thepg_stat_statements.maxparameter controls the maximum number of unique statements that can be stored in memory. The default value is 5000. If you have more unique queries, set this accordingly. For example, if you estimate ~6000 unique queries, set it to 10000 to be safe. - Also,
blk_read_timeandblk_write_timeare collected only when the additionaltrack_io_timingparameter is enabled.
If the snapshot start time and end time differs from the time you provided on command line, then make sure that the timezon of the host and the Aurora or RDS instance are same.
Check timezone on the host where you execute pireporter:
$ timedatectl | grep "Time zone"
       Time zone: Europe/Berlin (CET, +0100)
Then connect to the Aurora or RDS instance and check timezone related parameter, in case of PostgreSQL it will be timezone:
postgres=> show timezone;
   TimeZone
---------------
 Europe/Berlin
(1 row)
In both cases we have Europe/Berlin timezone. If you have differnt values, then you need to adjust the timezone of the host.
Synopsis
  $ pireporter --create-snapshot --rds-instance name --start-time YYYY-MM-DDTHH:MM --end-time YYYY-MM-DDTHH:MM [--comment text] [--include-logfiles]
  $ pireporter --create-report --snapshot snapshot_file
  $ pireporter --create-compare-report --snapshot snapshot_file --snapshot2 snapshot_file
  $ pireporter --do-estimation --rds-instance name --start-time YYYY-MM-DDTHH:MM --end-time YYYY-MM-DDTHH:MM
  $ pireporter --help
Command line options
  -h, --help                     Display this usage guide.
  -i, --rds-instance string      The RDS instance name to create snapshot.
  -s, --create-snapshot          Create snapshot.
  --start-time string            Snapshot start time. Allowed format is ISO
                                 8601 "YYYY-MM-DDTHH:MM". Seconds will be
                                 ignored if provided.
  --end-time string              Snapshot end time. Same format as for start
                                 time.
  --res-reserve-pct number       Specify the percentage of additional resources
                                 to reserve above the maximum metrics when
                                 generating instance type recommendations.
                                 Default is 15.
  --use-2sd-values               To calculate the required resource for the
                                 workload, consider the average value plus 2
                                 standard deviations (SDs). By default the
                                 maximum usage is used.
  -m, --comment string           Provide a comment to associate with the
                                 snapshot.
  -a, --ai-analyzes              When generating reports, include the analysis
                                 from the language model (Amazon Bedrock:
                                 Claude by Anthropic), which provides its
                                 findings, analysis, and recommendations. This
                                 option works with create report and create
                                 compare periods report.
  -r, --create-report            Create HTML report for snapshot.
  -c, --create-compare-report    Create compare snapshots HTML report for two
                                 snapshots.
  --snapshot string              Snapshot JSON file name.
  --snapshot2 string             Second snapshot JSON file name to compare.
  --include-logfiles             Instance log files will be scanned for errors
                                 or critical messages within the provided time
                                 range. This operation can be time-consuming
                                 and resource-intensive.
Examples
- Create a snapshot inlclude logfile analysis
$ pireporter --create-snapshot --start-time 2023-08-02T16:50 --end-time 2023-08-02T17:50 -i apginst1 --include-logfiles -m "High load period" - Create a report from snapshot
$ pireporter --create-report --snapshot snapshot_apg-bm_20230802145000_20230802155000.json - Create a compare periods report
$ pireporter --create-compare-report --snapshot snapshot_apg-bm_20230704150700_20230704194900.json --snapshot2 snapshot_apg-bm_20230619100000_20230619113000.json