node-red-contrib-v8-cpu-profiler
A Node-RED node to start CPU profiling on the V8 engine (used by NodeJs), to determine the root cause of high CPU usage.
Install
Run the following npm command in your Node-RED user directory (typically ~/.node-red):
npm install node-red-contrib-v8-cpu-profilerRemark: This node is based on the official v8-profiler-next package.
| :warning: Please have a look at the tutorials on the wiki |
|---|
Support my Node-RED developments
Please buy my wife a coffee to keep her happy, while I am busy developing Node-RED stuff for you ...

Node usage
This node can be used to start and stop (manually or automatically) a CPU profiling, in case you need to analyze why Node-RED is using much CPU.
Example flow
The following example flow shows how profiling can be started and stopped manually:
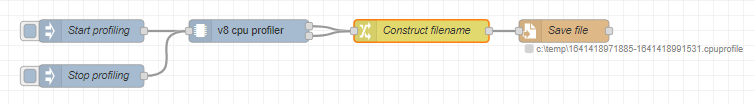
[{"id":"563b8f929d5b402f","type":"inject","z":"4aad778b57d4f47b","name":"Start profiling","props":[{"p":"payload"}],"repeat":"","crontab":"","once":false,"onceDelay":0.1,"topic":"","payload":"start_profiling","payloadType":"str","x":950,"y":720,"wires":[["2a2bf09c08c27940"]]},{"id":"61c69682821e25dd","type":"inject","z":"4aad778b57d4f47b","name":"Stop profiling","props":[{"p":"payload"}],"repeat":"","crontab":"","once":false,"onceDelay":0.1,"topic":"","payload":"stop_profiling","payloadType":"str","x":950,"y":780,"wires":[["2a2bf09c08c27940"]]},{"id":"f917781ef1253bb4","type":"file","z":"4aad778b57d4f47b","name":"Save file","filename":"filename","filenameType":"msg","appendNewline":false,"createDir":false,"overwriteFile":"true","encoding":"none","x":1580,"y":720,"wires":[[]]},{"id":"2a2bf09c08c27940","type":"v8-cpu-profiler","z":"4aad778b57d4f47b","timeout":"20","format":"tree","name":"","x":1160,"y":720,"wires":[["e230b5fe5c4b8237"],["e230b5fe5c4b8237"]]},{"id":"e230b5fe5c4b8237","type":"change","z":"4aad778b57d4f47b","name":"Construct filename","rules":[{"t":"set","p":"filename","pt":"msg","to":"'/tmp/' & payload.startTimestamp & '-' & payload.endTimestamp & '.cpuprofile'","tot":"jsonata"},{"t":"set","p":"payload","pt":"msg","to":"payload.profile","tot":"msg"}],"action":"","property":"","from":"","to":"","reg":false,"x":1390,"y":720,"wires":[["f917781ef1253bb4"]]}]The payload of the output message will contain following fields:
profile: the profiling result (in json format).startTimestamp: the profile when the profiling has been started. Note that this might differ a bit from the actual start of the profile.endTimestamp: the profile when the profiling has been stopped. Note that this might differ a bit from the actual end of the profile.
The node has two outputs:
- The messages with complete profiles will be send on the first output, i.e. profiles that have not been interrupted by a 'stop_profiling' input message. Those profiles will not have run over the entire time duration, as specified in this node's config screen.
- The messages with incomplete profiles will be send on the second output, i.e. profiles that have been interrupted by a 'stop_profiling' input message. Those profiles will have run over the entire time duration, as specified in this node's config screen.
Step by step
These are the basic steps that need to be executed to create a CPU profile:
-
Start the profiling by injecting
msg.payload = "start_profiling". In this flow the profiling will be started manually via the inject code. But of course it is also possible to do this automatically: e.g. create a flow that injects a message as soon as the CPU usage is higher than a specified threshold during some time interval. This can be very useful when the CPU usage is only high at unpredictable times, so it is impossible to start the profiling manuaaly in this case. -
Execute some actions in Node-RED that consume lots of CPU.
-
Stop the profiling by injecting
msg.payload = "stop_profiling".Note that a timeout of 20 seconds has been specified in the node's config screen. This means that the profiling will be ended after 20 seconds, unless the profiling is stopped earlier via an input message.
-
As soon as the profiling is stopped, an output message will be send.
Note that both outputs have been wired, which means that in this case we will both store the complete and interrupted profiles. But that depends on the use case...
-
A change node is used to construct the filename, in this case "C:\temp\
- ..cpuprofile" -
The File-Write node will store the json result with the specified filename.
-
Open the .cpuprofile file in a third party tool to show the flamegraph, for example via Chrome Developer Tools.
The wiki contains a tutorial which explains step-by-step how to do a Node-RED CPU profiling analysis via Chrome Developer Tools.
Node properties
Timeout
Specify after which time interval (in seconds) the profiling should be stopped, in case no stop_profiling is injected within that interval. A timeout value of 0 means no timeout.
Format
Specify which cpu profile format is required. The older 'flat' type or the new 'tree' type. The latter one is required for Chrome, Visual Studio Code, ...