Theme for WeeWX weather station software.
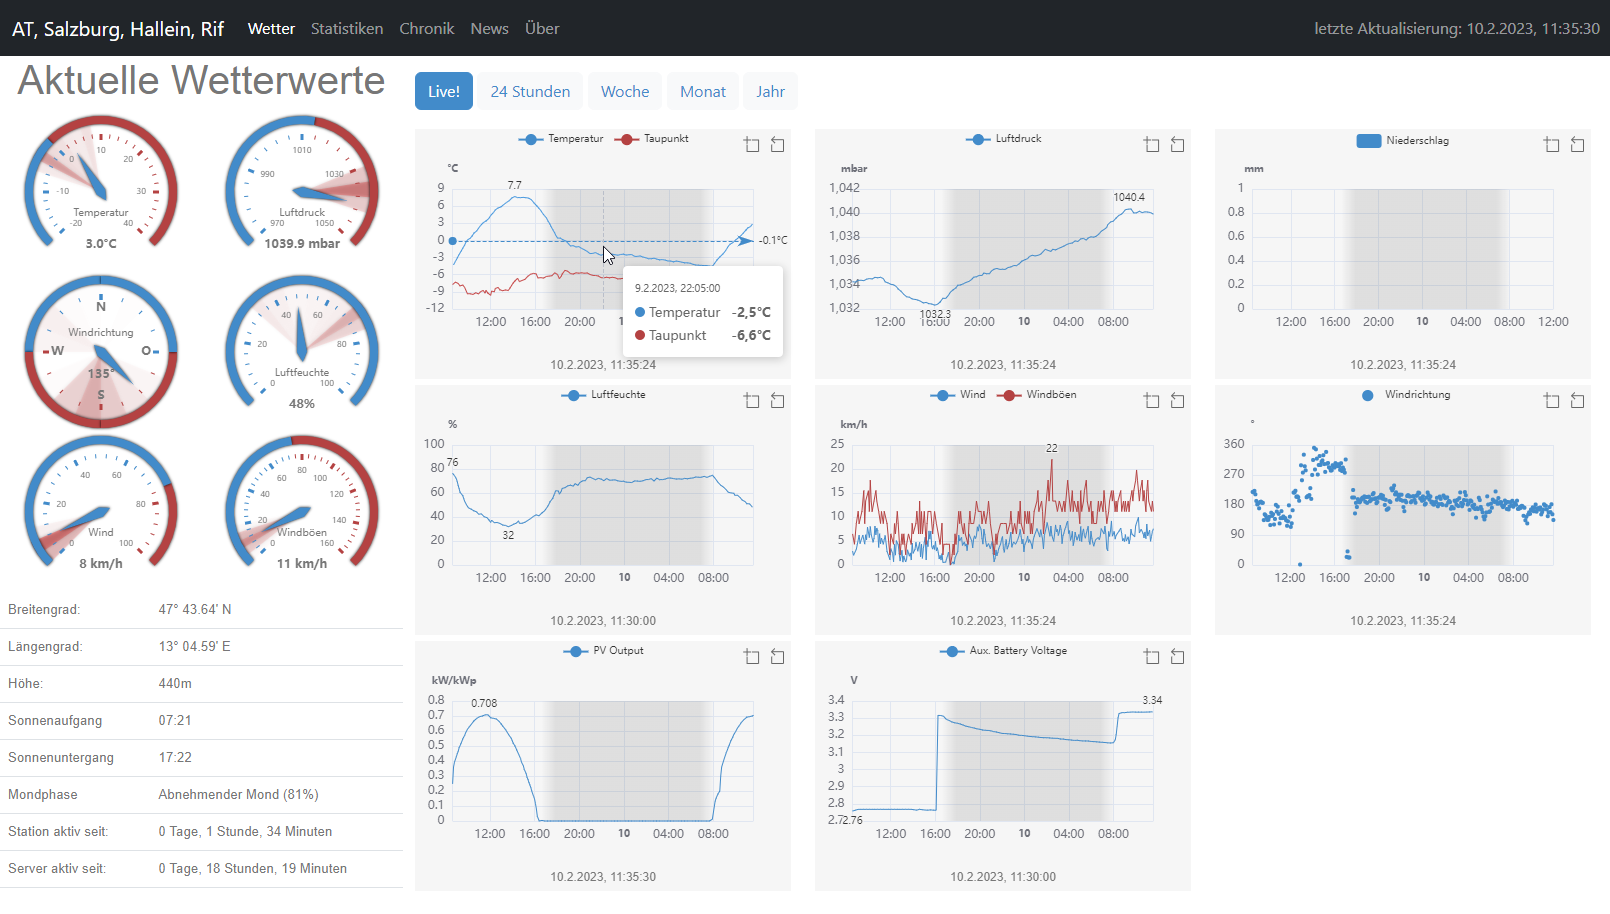
Gauge and Chart graphics showing current conditions.
| English example | German example with combined line/bar chart and scatter chart |
|---|---|
See it in action with live data (10s. refresh interval):
Interactive charts showing conditions over a timespan
MQTT enabled Gauges and charts - live weather data! (Live data needs extra extensions and configurations for publishing and subscribing MQTT messages and topics) see: https://github.com/brewster76/fuzzy-archer/wiki/MQTT-setup
Statistics: daily/weekly/monthly/yearly/alltime, highs/lows, ...
Historic data in color coded html tables.
Available in multiple languages. Help wanted! We need help with translations for:
- czech
- spanish
- finnish (there isn't even a language file stub yet)
- french
- greek
- italian
- korean (there isn't even a language file stub yet)
- dutch
- thai
Read the upgrading guides in the wiki, if you already have an older version installed: https://github.com/brewster76/fuzzy-archer/wiki
New in v4.2:
- Upgraded dependencies
- Overhaul of the UI, optimizations for mobile devices, more compact on mobile devices
- Navbar is fixed on top, faster and easier navigation especially on mobile devices
- Introduced Bootstrap Icons (https://icons.getbootstrap.com/)
- History: redundant specification of maxvalues for colors was removed, remove them from your custom configs (leaving them will still work, but is of no use)
- Support for customizing report data JSON in front end
- Fixed async refresh for sum aggregation in live charts
- Config option for axis intervals
- Config option for station info items
- Moon phase, sunrise/set, rain summaries, uptime is now updated asyncronously every archive_interval
- Added rain summaries in station info
New in v4.1:
- Mixed charts: you can now mix "line" series with "bar" series. A mixed radiation/UV chart is already in the configs, you can enable it by adding it to live_chart_items
- New chart type "scatter". A scatter chart for lightning strikes and distance is already in the configs, you can enable it by adding it to live_chart_items
- Configurable custom pages
- Configurable news items
- More config options for charts
- Gauges, charts, stats and history items are now shown and ordered explicitly using a configuration list.
- Mulit-language linking support: you can switch languages vie dropdown in multi-language installations
- localization throughout charts and gauges (the stats and history page still depends on the systems locale, see https://github.com/weewx/weewx/issues/867)
- Bugfixes and enhancements
New in v4.0:
- Complete and thorough overhaul of the skin, many breaking changes. It is recommended to start over with a fresh install
- This skin used to consist of three skins, now reduced to one
- Localization is now done the WeeWX way
- Less and easier configuration
- Many customizations can now be done by configuration only, no more need to touch the templates
- Day/night background in Live Charts (needs pyephem installed)
- Bug fixes and other enhancements

See it in action (legacy v2.x): dajda.net
Gauge with 3 Needles / Markers examples:


Frequently asked questions: here