Latest version: chiasm-v0.3.0.js
Chiasm is a browser based runtime environment and component architecture for interactive data visualizations. It allows plugins for data access, data transformation, and interactive visualization to be loaded and configured dynamically.
Here's a video that explains the history of the project: Story of the Chiasm Project, and here's another that covers the details of how Chiasm works and how you can use it: Introduction to Chiasm.
Examples
| thumbnail | description |
|---|---|
 |
Chiasm Boilerplate |
 |
Chiasm-Charts v0.1.5 |
 |
Interactive Scatter Plot with selectable X, Y columns. |
 |
Chiasm-Charts v0.1.0 |
 |
Bootstrap + Chiasm |
 |
Fusillade à Paris, a visualization of the attacks in Paris on November 13, 2015. |
 |
Migrant Deaths over Time. |
 |
Reactive Mixins for Visualizations. Described in detail in the video Introduction to Chiasm. |
 |
Magic Heat Map. |
 |
Magic Bar Chart (AngularJS UI). |
 |
Magic Bar Chart (Browserified). |
 |
Thumbnails of visualization techniques from a 1984 paper. |
 |
Fundamental visualization techniques in Chiasm. |
 |
Focus + Context Area Charts. |
 |
Crossfilter & Chiasm. |
 |
Focus + Context Scatter Plots. |
 |
Focus + Context Scatter Plots with Color. |
 |
Download SVG data using SVGSaver. |
 |
Map & Globe based on Leaflet.js and This is a Globe. |
 |
Migrant Deaths Map with Leaflet. |
 |
A self-contained example showing the new v0.2.0 plugin API. |
 |
A demo of the Chiasm configuration editor and nested box layout. |
 |
An example Chiasm configuration with a bar chart and line chart. |
 |
The Chiasm kitchen sink (code), showing various configurations including scatter plot, line chart, and bar chart. |
 |
An example demonstrating linked views and having a common color scale. |
 |
A more complex example with linked views using Crossfilter and loading data from an API. |
Usage
You can include Chiasm in your page like this:
<script src="http://chiasm-project.github.io/chiasm/chiasm-v0.3.0.js"></script>This will introduce a global variable Chiasm, which is a constructor function for instances of the Chiasm runtime environment.
Chiasm can also be used as an NPM module. To install, run
npm install -S chiasmTo use in your CommonJS JavaScript, you can require it like this:
var Chiasm = require("chiasm");Components
The subproject chiasm-component defines a common base for Chiasm components.
Several components are also subprojects under github.com/chiasm-project:
- chiasm-layout Nested box layout for Chiasm components.
- chiasm-links Data binding for Chiasm components.
- chiasm-dsv-dataset A Chiasm component that loads data files.
- chiasm-data-reduction A Chiasm component for aggregation and filtering data.
There are also the following other components that exist in various examples:
- dataLoader.js in Focus + Context Scatter Plots A component that loads and parses CSV files.
- chiasm-crossfilter.js An integration with Crossfilter.js.
- coloredRectangle.js in Chiasm Boilerplate A colored rectangle that changes color when you click on it.
- dummyVis.js in Chiasm Foundation. A colored rectangle with a draggable X and text label.
- wave.js in Chiasm Foundation. An example component that uses Canvas for an interactive wave simulation.
- chiasm-leaflet.js in Migrant Deaths Map and Map & Globe An integration with Leaflet.js.
- bubble-map.js from Migrant Deaths Map An extension of chiasm-leaflet.js that visualizes data using circles on a map.
There is a collection of components in the v0.1.9 archive branch. These will eventually be ported to the v0.2.0 API, and moved into their own separate repositories.
Presentations on Chiasm
- Notes from the Chiasm presentation at VisFest, San Francisco - November 2015
- Introduction to Chiasm - October 2015
- Story of the Chiasm Project - September 2015
- Chiasm @ Houston Data Visualization Meetup - August 2015
- Lightning Demo (2 min) at San Francisco D3 Meetup - July 2015
- Chiasm presentation at Alpine Data Labs (slides) - May 2015
- Constructing Interactive Data Visualizations - Plans for Chiasm - February 2015
- Visualizing the Universal Data Cube - November 2014 - Doctoral dissertation defense including the blueprint for Chiasm.
Background
The core concept of this project is that interactive graphics, particularly data visualizations, can be instantiated, configured with data, arranged on the screen, and coupled together to produce interactive linked views.
A JSON configuration structure defines the entire state of a Chiasm application. The configuration refers to plugins by name, which are invoked to instantiate instances of components. Configuration changes can be made at runtime, and Chiasm will propagate the changes through the system. The JSON configuration also updates in response to changes in the state of the component's Model at runtime.
With visualizations, this means that the state users arrived at by interacting with the system (customizing visualization parameters, changing the columns visualized, or changing colors) can be serialized. This makes it possible to build a system that stores and retrieves editable Chiasm configurations.
Configuration Structure and Runtime Environment
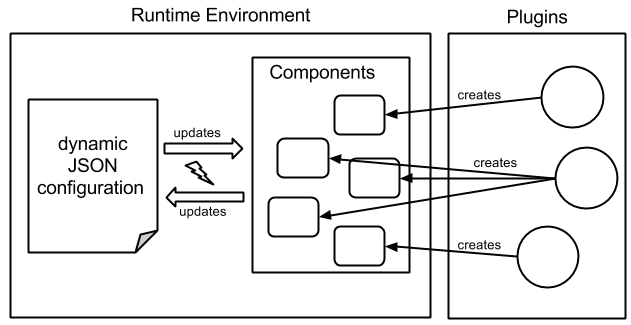
A configuration is a JSON object encapsulating an application state. This configuration contains specifications for a set of runtime components, each of which has:
- a unique name (called the "alias" of the component),
- an associated plugin that creates the runtime component, and
- a key-value dictionary specifying the state of the runtime component.
This organization allows a dynamic configuration structure to drive the state of the application, and also allows changes resulting from user interactions with runtime components to be propagated back to the configuration.

This diagram illustrates that
- Plugins create runtime components.
- Changes in configuration propagate to runtime components.
- Changes in runtime components propagate back to the configuration.
Related Work
This project is inspired by the following related work:
The word "Chiasm"

The optic nerve fibres on the nasal sides of each retina cross over to the opposite side of the brain via the optic nerve at the optic chiasm. -- Wikipedia
The Chiasm was a junction of interdimensional networks and corridors that allowed for instantaneous travel over long distances of space. - Dr. Who
Chiasm, this project, relates to the above meanings of the word "Chiasm" in that it connects the "brain" of data to the "eyes" of users through interactive visualization. When Chiasm is set up to use an interactive data transformation like Crossfilter, the visualization system is an intersection of multidimensional "corridors" in data space, and interacting with it allows users to rapidly pivot and navigate through the data.
Contributing
Any contributions or involvement is warmly welcome. Please give this repository a star if you think it's cool. If you're looking for ways to contribute, any examples you have created using Chiasm would be welcome as additions to the examples list (fork the repository, edit this README.md file, and send a pull request). Also, please take a look at the issues to see if there are any you'd be interested in taking on. Also feel free to submit new issues for feature requests and bugs. For feedback and discussion in general, please post to the Chiasm Google Group.