GNU source level debugger for Visual Studio Code
This extension for Visual Studo Code enables debugging of bare metal C/C++ programs for microcontrollers. The extension implements the Visual Studio Code debug adaptor for Arm embedded processors. This extension is suited for macOS, Linux and Window.


The adaptor uses the GNU source level debugger (GDB) that enables examination of your running program. You can find background documentation about the GNU source level debugger here.
Dependencies
- GDB client from GNU toolchain for you operating system (one of the following)
- Development board with debug probe or a separate debug probe
Features

- source level debugging of C and C+++
- set / clear breakpoints
- pause / continue, step over, step into, step out, restart
- change variables
- watch expressions
Output format
Visual Studio Code has no standard way to set the format of variables. In this extension you can change the output format with a number prefix.
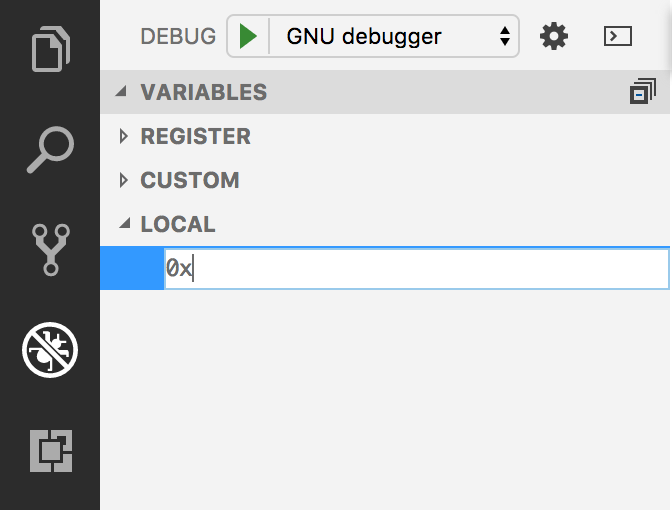
Use the following number prefixes:
- 0b = binary
- 0o = octal
- 0d = decimal
- 0x = hexadecimal
- 0n = natural (back to GDB default output format)
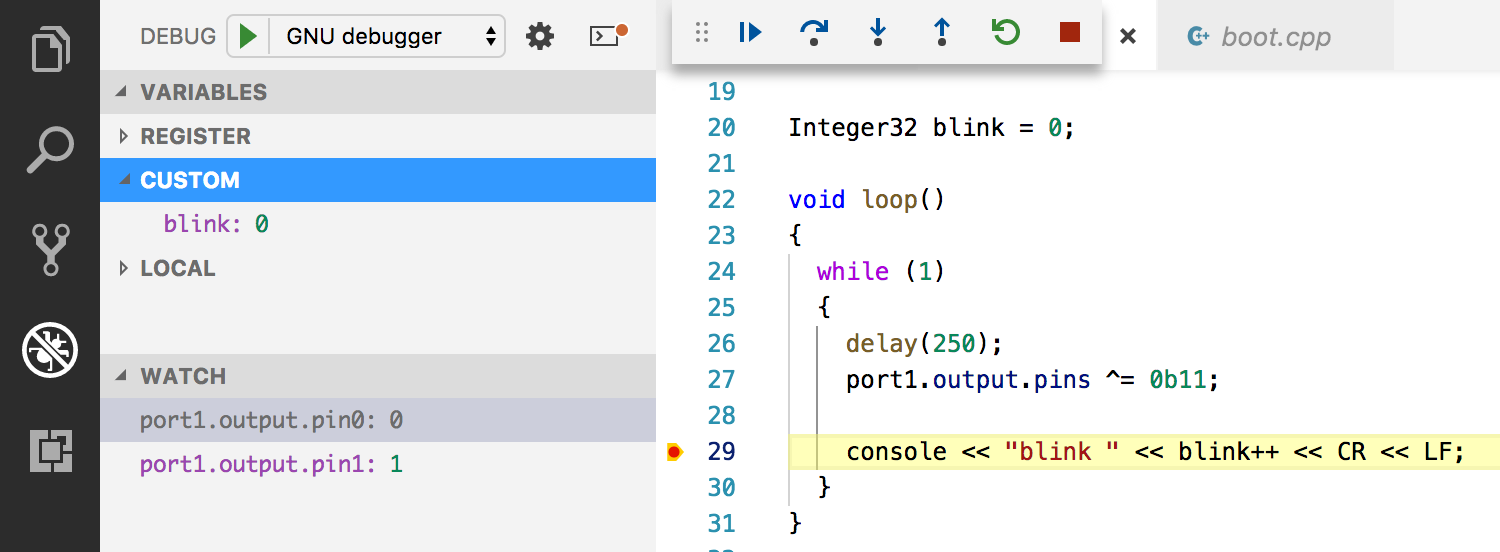
Custom variables
To view/change global variables on every debug session add a customVariables list to the launch.json.
Principle of operation
The extension uses the machine oriented text interface of the GNU source level debugger (GDB/MI). The adaptor translates workbench.action.debug commands to GDB/MI commands and translate GDB/MI outputs to graphical representation inside Visual Studio Code.
For Arm embedded platforms the GNU source level debugger consists of two parts:
- GDB client
- GDB server
Both programs must be installed on your development system.
GDB client
The GDB client is supplied by Arm free of charge as part of the Arm embedded toolchain. For convience I have packaged the latest toolchain for different operating systems as Visual Studio Code extension as mentioned in the dependencies section.
You can find GDB client for Arm embedded processors under the bin directory of the toolchain. The name of the GDB client program is:
- arm-none-eabi-gdb (macOS, Linux)
- arm-none-eabi-gdb.exe (Windows)
The GDB client communicates with a GDB server through a network connection (TCP/IP socket).
GDB server
The GDB server is supplied by the manufacterer of the debug probe. The most widely used lines of debug probes are the J-Link and ST-Link debug probes. The name of the SEGGER J-Link GDB server program is:
- JLinkGDBServer (macOS, Linux) (symbolic link, the actual command line program is JLinkGDBServerCLExe)
- JLinkGDBServerCL.exe (Windows)
If you have a development board with an onboard ST-Link debug probe you can upgrade the firmware to J-Link. More information for upgrading to J-Link may be found here.
OpenOCD
The Open On-Chip Debugger supports a large amount of debug probes. Starting from Version 0.0.5 you can use OpenOCD as GDB server.
Release Notes
Version 1.0.1
Support for Raspberry Pi Picoprobe