
1. Introduction to Traceshark
This is a graphical viewer for the Ftrace and Perf events that can be captured by the Linux kernel. It visualizes the following events:
cpu_frequency
cpu_idle
sched_migrate_task
sched_process_exit
sched_process_fork
sched_switch
sched_wakeup
sched_wakeup_new
sched_waking
The sched_waking events are not really visualized but there is a button to find the sched_waking event that has instigated a particular sched_wakeup event.
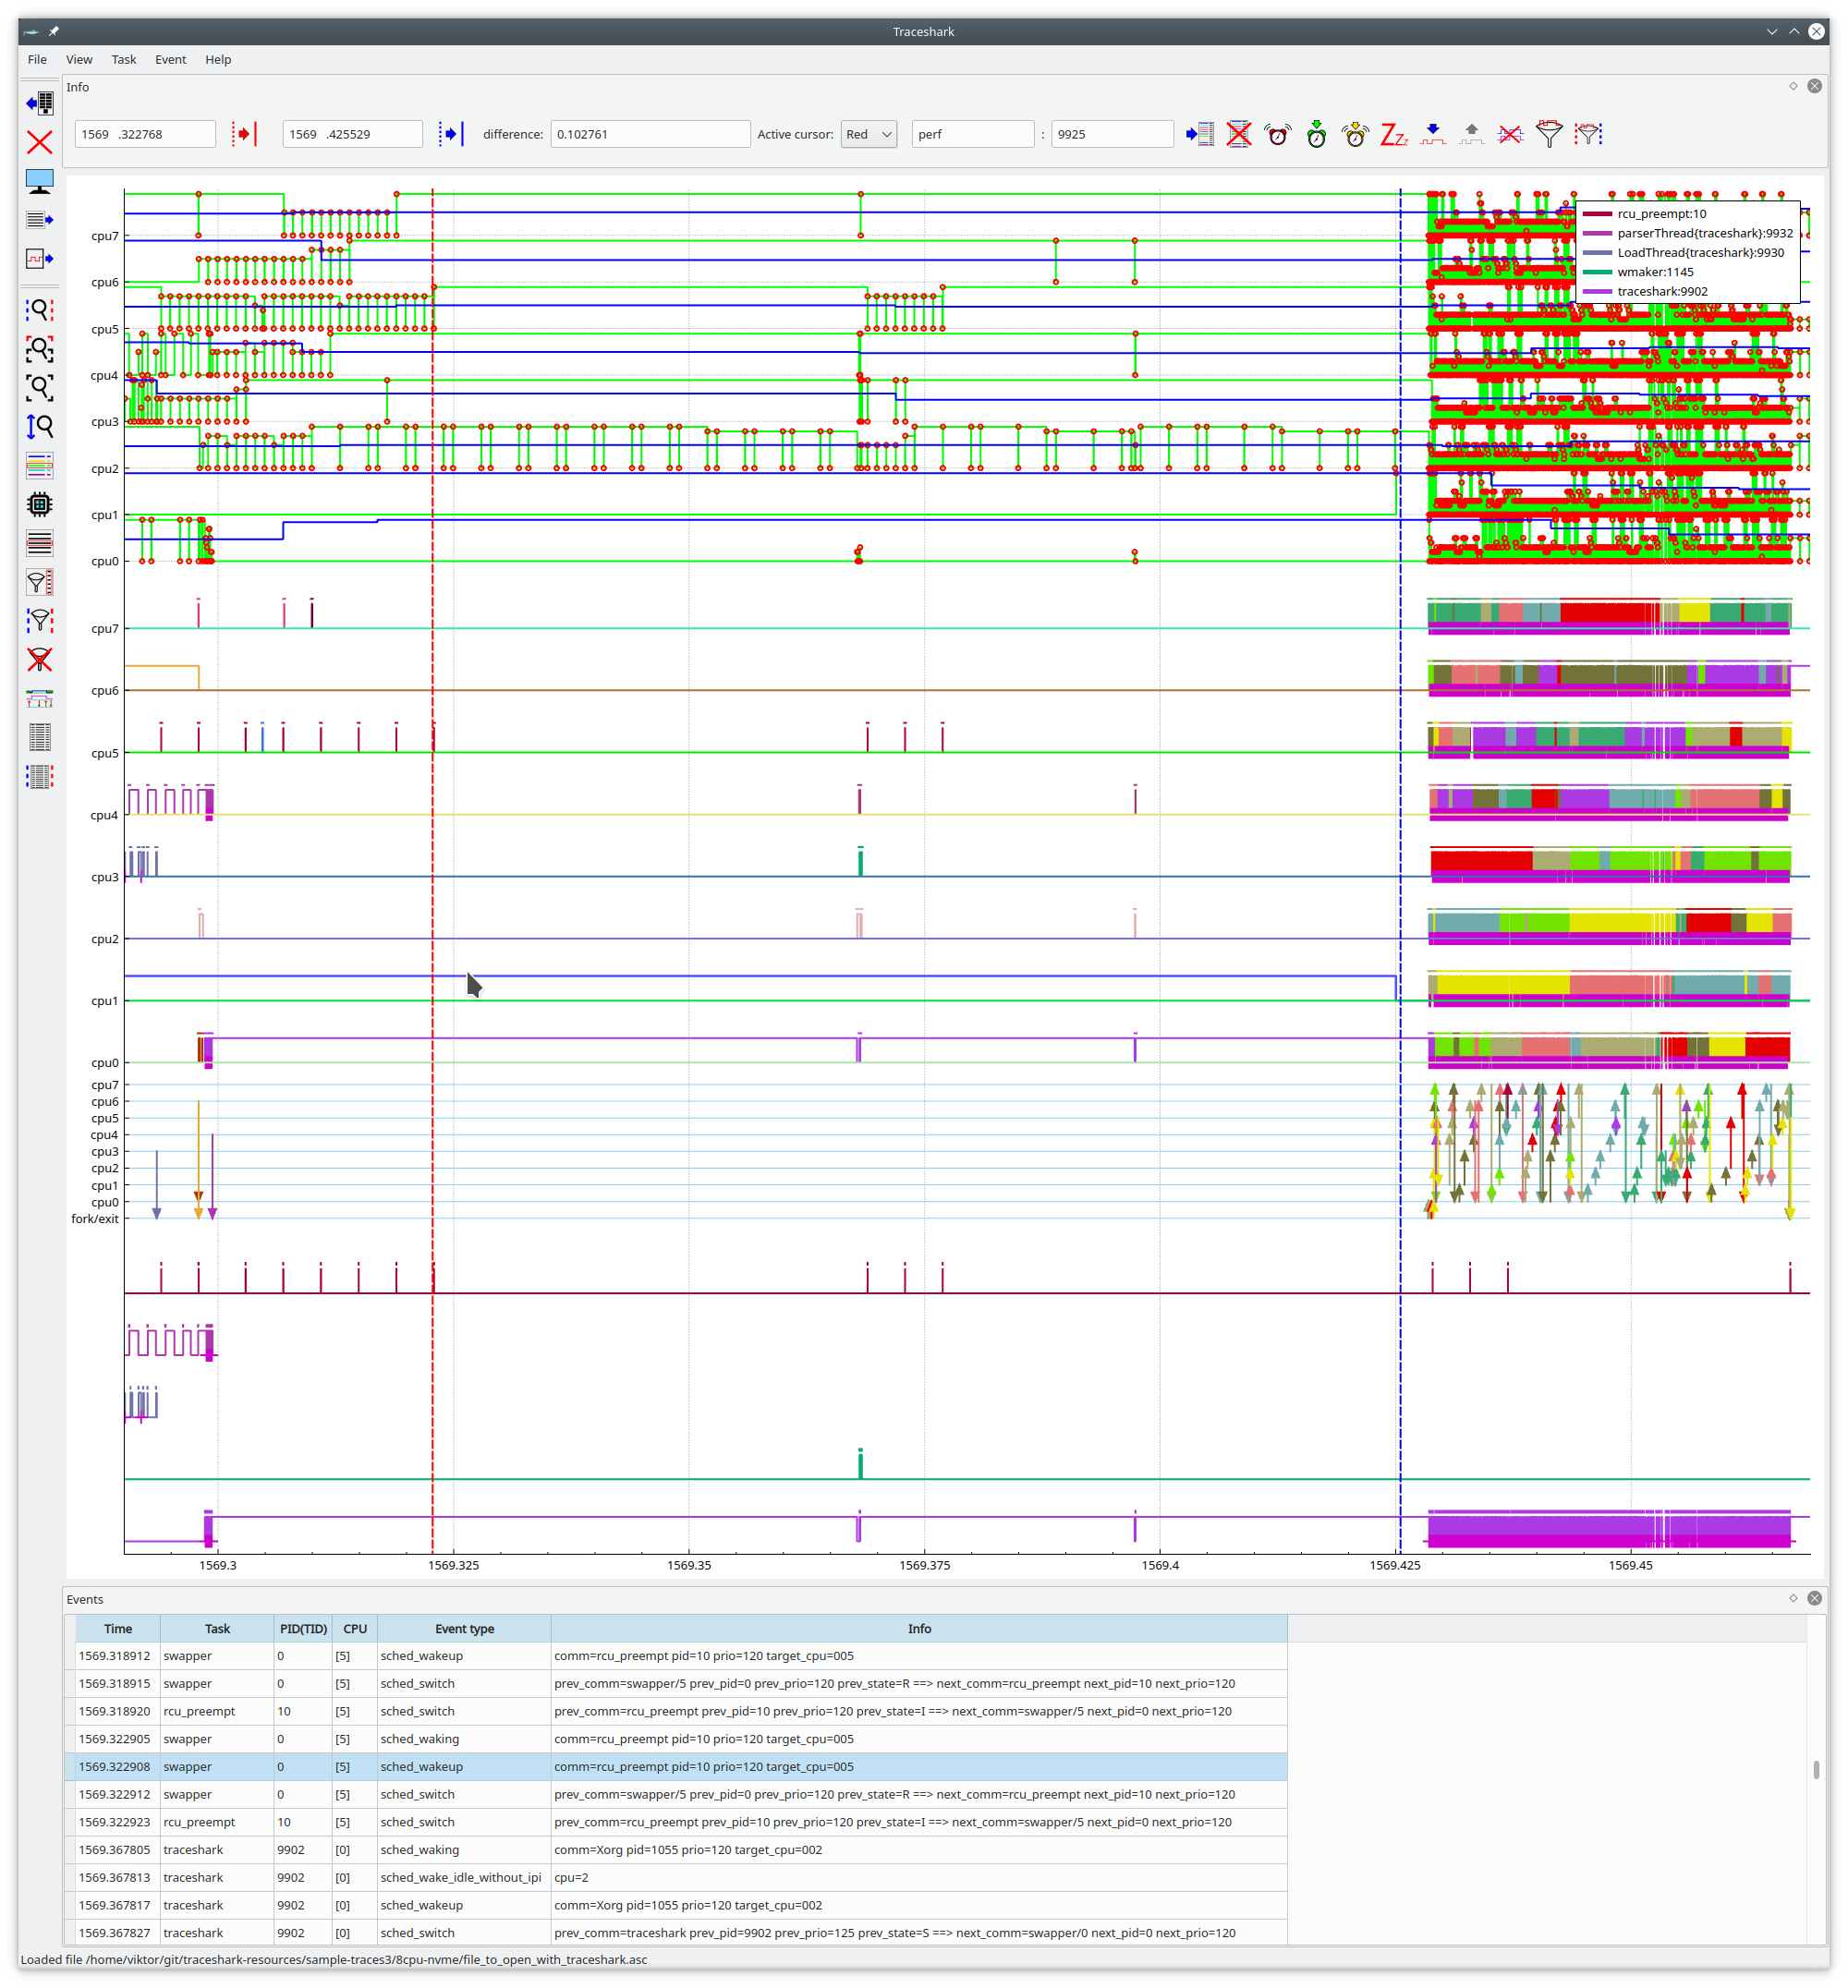
Above is a screenshot of traceshark. The eight uppermost graphs are for displaying CPU idle and frequency states. They are eight because the measurement was made on a system with eight virtual CPUs. The green graphs with red circles  show the CPU idle states while the thicker blue graphs
  show the CPU frequency changes.
Below these eight graphs are the per CPU scheduling graphs, the different colors of these graphs are for different tasks. The small vertical bars that are shown just above the per CPU graphs indicates the waiting time between a task becoming runnable and being scheduled, the highest height is equal to 20 ms, i.e. a full length means that the waiting time was at least 20 ms, possibly more.
Furthermore, in the scheduling graphs, there are the following subtle markers:
 The blue triangle indicates that the task was still running when it was scheduled out.
 The red triangle indicates that the task was preempted when it was scheduled out.
 The magenta colored plus sign indicates that the task went into uninterruptible sleep when it was scheduled out. Note that in practice, only the lower line of the plus sign is visible.
Below the scheduling graphs are the migration graphs. Task migrations between CPUs are shown with arrows. Fork/exit is shown with an arrow from/to fork/exit.
Below the migration arrows are the unified task graphs, where tasks are shown without caring about which CPU it is running on. Here the time between becoming runnable and being scheduled in shown by horizontal bars.
These graphs will only be shown if requested by the user. It is necessary to select a task and click the  button or the
 Add a unified graph button in the task select dialog.
The task select dialog can be shown by clicking View -> Show task list, or by clicking the dedicated  button for it on the left panel.
1.1 Brief summary of the functionality of the GUI
1.1.1 How to zoom and scroll vertically
The graphs are by default zoomed and scrolled horizontally, i.e. time wise. You can scroll by grabbing the graph with your mouse pointer and zoom with the mouse wheel.
If you instead want to zoom or scroll vertically, you need to toggle the  button.
Another option is to select the vertical axis by left clicking on it with your mouse pointer. N.B, you should click directly on the line representing the axis, not on the labels, such as "cpu0", "cpu1", etc. As long as the vertical axis is selected, all scrolling and zooming will be vertical. If you want to switch back to horizontal, then you just need to deselect the axis by clicking on it again. Vertical zooming and scrolling may be particularly useful if you are looking at a trace of a system with a large number of CPUs or if you are short of vertical screen space.
1.1.2 Functionality of the menus
The items in the menus are in general duplicated as buttons. However, there is one exception, those that are in the Event menu.
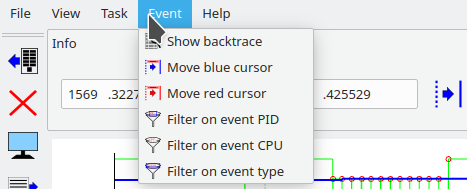
Above is a screenshot of the Event menu. For these items, there are no push buttons in the GUI. However, these actions can also be triggered by double clicking on the corresponding column of the currently selected event in the events view. Below is a brief explanation of these menu items:

Show backtrace: Shows a dialog window containing the backtrace of the currently selected event. The backtrace dialog window will look somewhat like this: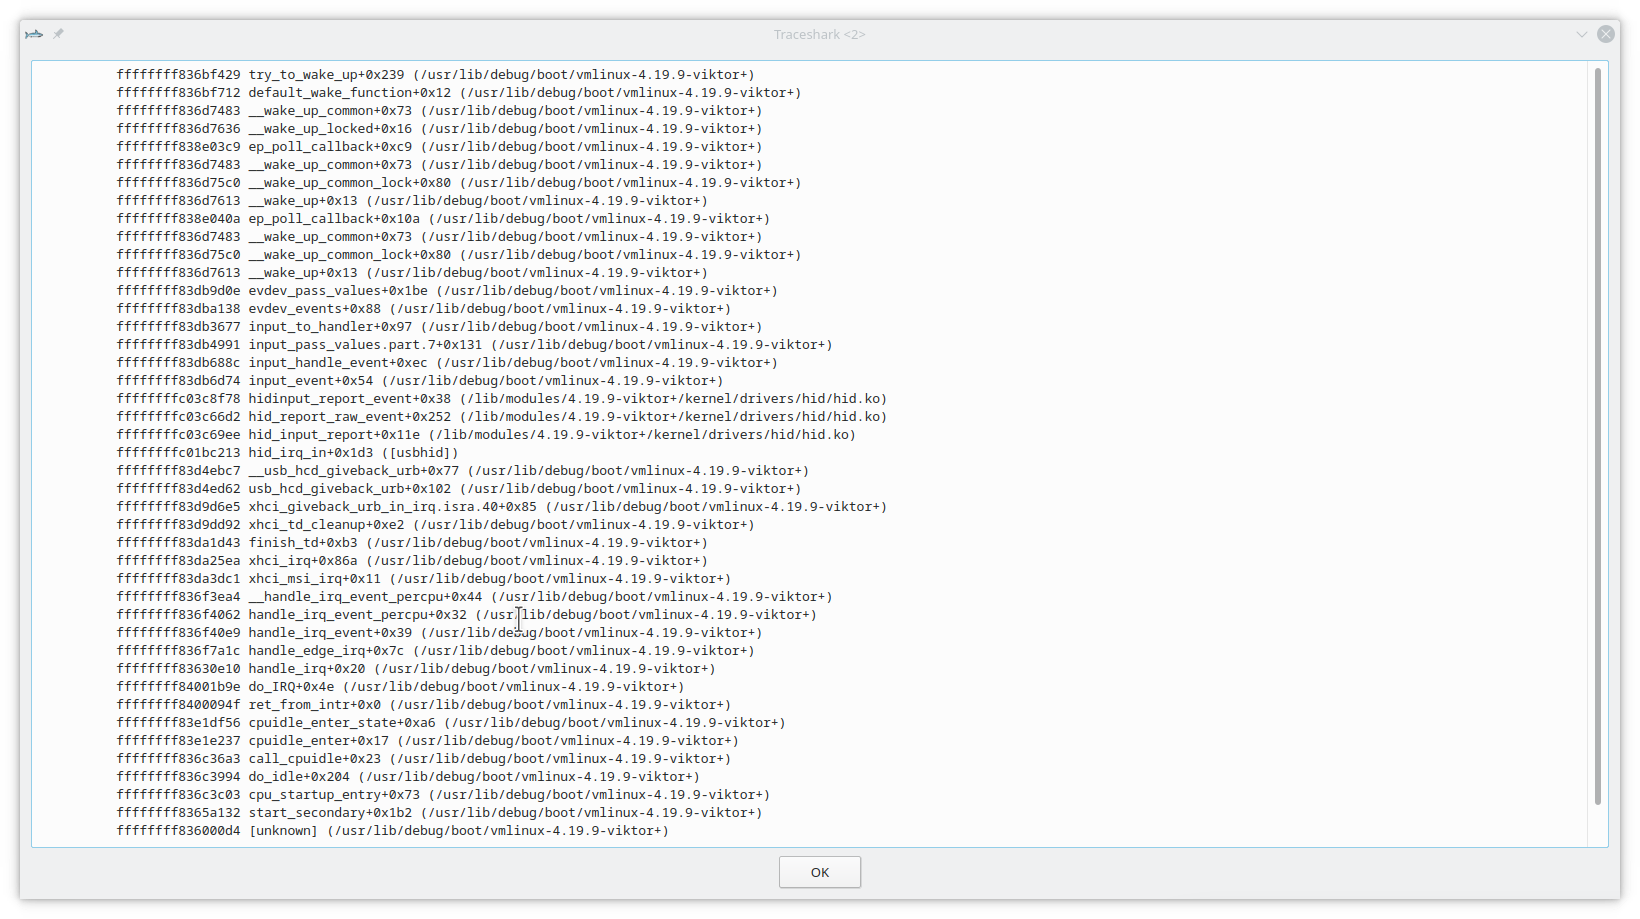

Move blue cursor: Move the blue cursor to the time of the selected event.
Move red cursor: Move the red cursor to the time of the selected event.
Filter on event PID: Filter the events view on the PID of the selected event.
Filter on event CPU: Filter the events view on the CPU of the selected event.
Filter on event type: Filter the events view on the type of the selected event.
1.1.3 Functionality of the buttons
There are a number of buttons in the GUI. These buttons are also duplicated in the menus. Here is a description of the buttons in the left panel:
 This button is used to open a trace file.
 Closes the currently open trace.
 Take a screenshot of the plot and save it to a file.
- Show the task select dialog. This makes it possible to filter the events view by task, to show a task in the legend, or to show a unified graph. This button is very useful when the user knows the name of a task of interest but cannot find it easily among the scheduling graphs.
 Show a list of CPUs and it's possible to filter the events view by CPU.
 Show a list of the different event types and it's possible to filter the events view by event type.
 Show a dialog that lets the user input one or several regular expressions and it is possible to filter the events view with these. The filtering only applies to what is in the Info field. The filtering is separately applied to the different words, which are delimited by spaces. The filtering will by default try with all words but it is also possible to select a certain position. The position may be from the start or from the match of the previous regular expression.
 This will filter the events view so that only events in the interval between the cursors are displayed.
 This button resets all filters.
 Opens a dialog that allows the filtered events to be saved to a file. The output format is more or less the same as from perf, so that if one has filtered on the
 cyclesevents, it's possible to generate a CPU Flame Graph with the tools here, or here. A typical way to use this would be something like this:- Move the blue and red cursors so that they define a time interval that is of interest.
- Click on the
 button to limit the events to this interval.
 - Click on the button. Select the
cyclesevent and click on theCreate events filterbutton. - Click on the button and select a task or a set of tasks that is of interest. Click on the
Create events filterbutton. - Click on the button and type in the filename
filtered.asc. Click on theSavebutton. - Download the flamegraph software by giving one of the following commands in your home directory:
git clone https://github.com/cunctator/FlameGraph.gitor
git clone https://github.com/brendangregg/FlameGraph.git - Create the flamegraph of the filtered events:
~/FlameGraph/stackcollapse-perf.pl --kernel filtered.asc > filtered.folded ~/FlameGraph/flamegraph.pl --hash --color=java filtered.folded > filtered.svg - If all went well, your file
filtered.svgshould now contain an image, that can be displayed by a web browser such as Chromium or Firefox. For an example, check the file doc/filtered.svg in this repository, it can be zoomed, unlike the png representation below: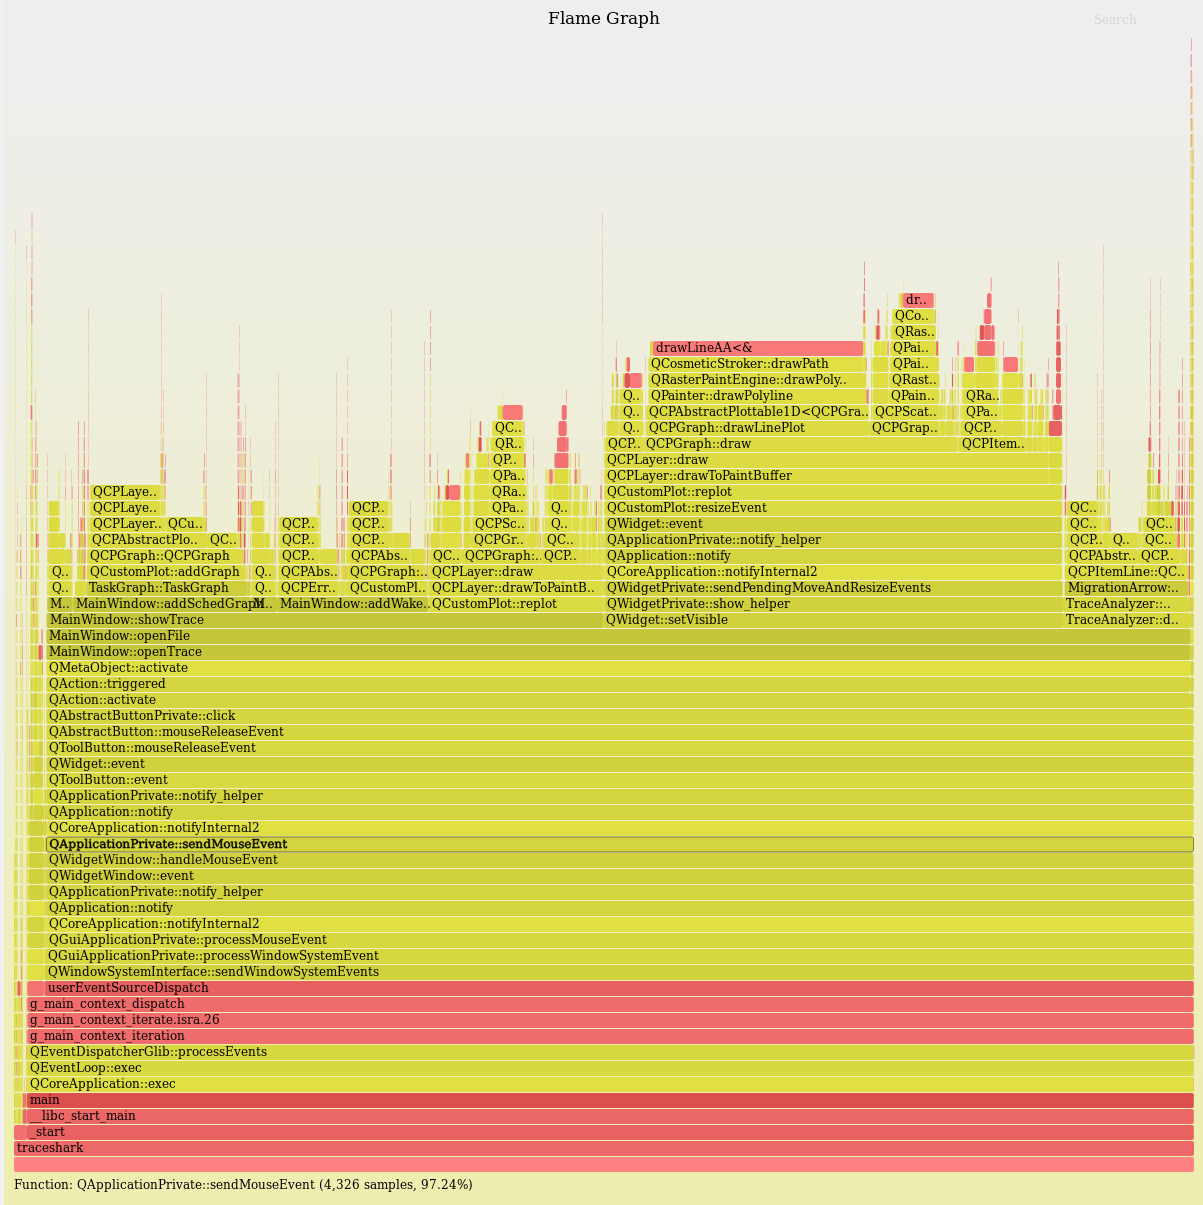 You can read more about flame graphs here.
 This functions exactly as the previously mentioned
  button, except that it only exports cycles events. The benefit is that the user doesn't need to separately filter on cycles events. The downside is that if the events of interest have a slightly different name, nothing will be exported. This could be the case with certain kernel versions, particularly heavily patched vendor kernels.
 Pressing this button will zoom the plot to the time interval that is defined by the cursors. This feature may be especially useful when a very large file has been opened and the response to mouse zooming is sluggish.
 Pressing this button will zoom the plot to the full time interval, that is from the beginning to the end of the trace. The height will also be adjusted so that everything is shown vertically too.
 Pressing this button will zoom the plot to the default zoom. This is the same as the full zoom, except that if there is not enough vertical screen space for displaying the trace without cluttering, then vertically only a part of the trace will be displayed and a vertical scroll bar will be displayed.
- Pressing this button will toggle the vertical zooming and scrolling. The effect is the same as toggling the selection of the vertical axis.
 Pressing this button will show a list of scheduling latencies. If a latency in the list is double clicked, then the task in question will be selected and the cursors will be moved to show the latency. The latencies are sorted so that the biggest latencies are displayed first. A scheduling latency is the delay between a task becoming runnable and being scheduled.
 Pressing this button will show a list of wakeup latencies. It works in the same way as the scheduling latencies button but shows wakeup latencies instead. Wakeup latencies only include the delay between a wakeup event and a task being scheduled. If a task is being scheduled out in a runnable state, then the delay until it being scheduled again is not included. If you want these latencies included, then you should use the previously mentioned button instead.
 Pressing this button will open a dialog that allows the user to select which types of graphs will be displayed. Here it is possible to disable certain graphs, for example CPU idle graphs that frequently may be of little interest. It is also possible to enable horizontal latency graphs for the per CPU task graphs that are disabled by default, because they will frequently overlap each other. If OpenGL is enabled at compile time, then it is possible to select the desired line width of the scheduling graphs. Otherwise, the line width will always be set to 1. The dialog has an
 Apply & Savebutton that allows the user to save the settings to$HOME/.traceshark, so that they will be remembered the next time traceshark is started. Pressing this button will show a dialog with global statistics on the left side of the plot. The statistics show how many % of the CPU time each task has consumed as well as the time consumed. The percentages are percentage of a core. This means that the maximum for a normal task is 100% and for the idle task, swapper with pid 0, the maximum is
 N * 100, where N is the number of CPUs. The tasks are sorted so that those tasks that consume more CPU time are shown earlier. The dialog has buttons for adding selected tasks to the legend, to add them as task graphs, to filter the events view on them, or to reset the filtering. There is even a button to close the dialog. Pressing this button will show a dialog with the same statistics as the previous button but the scope will not be the whole trace but the time between cursors and the statistics will be shown on the right side of the plot. If the cursors are moved while the dialog is shown, then the statistics will be updated accordingly.
The top widget has some buttons as well:
 Move the red cursor to the time specified in the time text box.
 Move the blue cursor to the time specified in the time text box.
 Adds the currently selected task, from the scheduling graphs, to the legend. A task can be removed from the legend by double clicking on it in the legend.
 Removes all tasks from the legend.
 This moves the non-active cursor to the immediately preceding scheduling of the currently selected task. The active cursor is moved to the wakeup event. The selected task is unselected and instead the task of the wakeup event is selected. The events view is scrolled to the wakeup event. This makes it convenient to easily check which task is waiting for which. It is a good idea to double click on the info field of the wakeup event, in order to see the backtrace so that one can determine whether the wakeup was caused by an interrupt or not. If all IRQs are traced it may also be possible to form a conclusion by looking at the surrounding IRQ related events. A typical way to use this button would be something like this:
- Choose a task whose wakeup sequence is of interest
- Double click to move the cursor to just after the scheduling of interest
- Make sure that the task is selected.
- Click on the button.
- Locate the wakeup event in the events view. It should be selected.
- Double click on the
Infofield to display the backtrace. Alternatively, you can use theEvent->Show backtracemenu item. - If the backtrace leads to an interrupt (including software interrupts), then the wakeup source has been found.
- If the
sched_wakeupevent is executed as pid 0, that is no new task has been auto-selected, and/or, the backtrace leads to something like this:2863f8 ttwu_do_wakeup 286522 ttwu_do_activate 2878a7 sched_ttwu_pending 29fec6 do_idle 2a00ff cpu_startup_entry 237418 start_secondary 2000d5 [unknown]Then it's necessary to find the preceding
sched_wakingevent and study its backtrace instead. Click on the button and go back to VI.
 - If none of the above is true, then go back to IV.
- This is used to find the
sched_wakingevent that is associated with and precedes a particularsched_wakeupevent. Asched_wakeupevent must be selected in the events view for this button to be enabled.  This is used to find the
 sched_wakingevent directly, without first finding thesched_wakeupevent. It operates in the same way as the button, based on the currently selected task and the position of the currently active cursor. If you use this button, you should remember that tasks might sometimes wake up without a sched_wakingevent. One example is when new tasks are woken up by thesched_wakeup_newevent; in that case there is no correspondingsched_wakingevent. This is used to find the next sched_switch event that puts the currently selected task to sleep. It is sometimes desirable to see what kind of code makes a task go to sleep; this is particularly useful together with the feature that the backtrace can be displayed by double clicking on the event's info field in the events view.
- Adds a unified scheduling graph for the currently selected task.
 Removes the currently selected unified graph.
 This button removes all unified graphs that have been added to the plot.
 This will filter the events view so that only events involving the currently selected task will be displayed.
 This will do the same as the previous, except that in addition it will exclude those events that are outside the interval defined by the positions of the cursors.
1.1.4 The Events view
At the bottom of the screen is the events view. The events view will be automatically scrolled when a cursor is moved. It is also possible to move the currently active cursor by double clicking on a time in the events view. Another very important feature is that by double clicking on the info field, a dialog will open that displays the backtrace of that particular event. In general, it is possible to trigger the actions in the Event menu by double clicking on the corresponding column of the currently selected event.
2. Building traceshark
2.1 How to set up your build environment
In order to build traceshark, you will need three things:
- A C++ compiler
- make
- The development packages for Qt
On Ubuntu 16.04, Ubuntu 18.04, Ubuntu 20.04, Debian 9, and Debian 10, you can install these like this:
sudo apt-get install qt5-default g++ makeOn Ubuntu 22.04 and Debian 11, you can install these like this:
sudo apt install qtbase5-dev g++ makeOn Fedora (tested with Fedora 32), you can do the following:
sudo dnf install qt5-qtbase-devel g++ makeIt is not recommended but if you plan to configure your build to use the QCustomPlot library on your distro instead of the patched built-in version, then you will need to install the relevant development package. On Ubuntu 20.04 and Debian 10:
sudo apt-get install libqcustomplot-devThe QCustomPlot library on Debian 9 and Ubuntu 18.04 is too old for traceshark.
On Fedora 32:
sudo dnf install qcustomplot-qt5-develOn macOS, you will need to:
- Install Xcode and Homebrew as described at brew.sh
- Install Qt version 6.x:
brew install qt
NB: It seems like on macOS you need to make sure that the currently used screen resolution matches the screen's native resolution. Otherwise, the graphs will be rendered in a very strange way; at least this has been seen on a Mac Studio with Ventura.
2.2 How to compile and install
The program can be compiled and installed by doing something like this:
qmake (on some distros you should use qmake6, or qmake-qt5 instead of qmake)
make -j5
sudo make install
On macOS, the sudo make install doesn't work. You can find the executable in traceshark.app/Contents/MacOS/traceshark. Running traceshark on macOS is currently in a quite experimental state.
2.3 How to configure your build
It is not necessary but you can tweak your build by editing traceshark.pro. One of the most important options is that you can disable OpenGL support. If and only if OpenGL support is enabled, then it is possible for the user to select the line width of the scheduling graphs, otherwise the line width will always be set to 1. OpenGL is enabled at compile time by default. If it has been enabled at compile time, then it will be enabled by default when running the application but only if the screen is deemed to be a high resolution screen. The user can enable or disable OpenGL at runtime by opening the dialog with the button. If you run into rendering problems, including problems with very slow rendering, then disabling OpenGL might be worth trying. OpenGL can be disabled at compile time by uncommenting the following line in traceshark.pro:
# DISABLE_OPENGL = yesYou can uncomment the following if you want the try to detect and optimize for your build machine:
# MARCH_FLAG = -march=native
# MTUNE_FLAG = -mtune=native
, or you can uncomment some specific flags to build for a certain machine, e.g. uncomment this to build for Broadwell:
# MARCH_FLAG = -march=broadwell
# MTUNE_FLAG = -mtune=broadwell
The recommended default compiler is g++ but you can compile with clang, or another version of g++, if you like, by uncommenting and possibly editing one of the following in traceshark.pro:
# USE_ALTERNATIVE_COMPILER = clang++-14
# USE_ALTERNATIVE_COMPILER = g++-12
If you want to build a debug build, uncomment one of the following two lines:
# Uncomment this for debug build:
# USE_DEBUG_FLAG = -g

# Uncomment this for debug symbols and optmized for debug:
# USE_DEBUG_FLAG = -g -Og
If you want to enable the Qt debug features, then you need to uncomment this line:
# Uncomment this for debug build. This affects Qt.
# QT_DEBUG_BUILD = yes
This is not recommended because it will very likely result in worse performance but if you absolutely want to use the QCustomPlot library on your system, then you need to uncomment the following line:
# USE_SYSTEM_QCUSTOMPLOT = yesPlease note that the software will compile for Qt 4 but that it has not been as tested with Qt 4. For that reason you might want to build with Qt 5, unless you happen to prefer Qt 4.
3. Obtaining a trace
There are two ways to capture a trace: Ftrace and perf. Perf is the recommended method because it is able to generate backtraces that are understood by traceshark. However, Ftrace has the benefit that it almost always works right out of the box on many distros. Nowadays, perf usually works right out of the box too but it was not always the case in the past.
For both Ftrace and perf it is very desirable to avoid lost events because traceshark cannot visualize correctly with lost events, nor can it find a wakeup event that has been lost.
When tracing, particularly when capturing many kilobytes of the stack with each event, the impact of the filesystem may easily become non-negligible. In particular, if when tracing some hot event that may be triggered by the file system, then if the storing of one event on average generates one or more additional events then there will of course be an explosion of events, and the tracing will end in a non-desirable way in one way or another.
If the system has enough RAM, one thing that can be done to ameliorate the situation is to store the trace to tmpfs. You can create a tmpfs by doing something like this:
 sudo mkdir -p /mnt/tmp
 sudo mount -t tmpfs -o size=8192M tmpfs /mnt/tmp
...or you can add a line to your /etc/fstab:
tmpfs /mnt/tmp tmpfs size=8192M 0 2The above is only provided as an example; you will probably need to adjust the size and path according to your needs. The benefit with tmpfs is that it is very fast and generally doesn't generate a lot of events. The downside is of course that it will easily consume a lot of RAM.
3.1 Sample traces
If you are not anxious to trace anything in particular but only want to play around with traceshark, then you can find sample traces here, or just clone the repo with the samples:
git clone https://github.com/cunctator/traceshark-resources.git3.2 Capturing a trace with Ftrace
You can get an Ftrace trace to view by doing the following:
trace-cmd record -e cpu_frequency -e cpu_idle -e sched_kthread_stop -e sched_kthread_stop_ret -e sched_migrate_task -e sched_move_numa -e sched_pi_setprio -e sched_process_exec -e sched_process_exit -e sched_process_fork -e sched_process_free -e sched_process_wait -e sched_stick_numa -e sched_swap_numa -e sched_switch -e sched_wait_task -e sched_wake_idle_without_ipi -e sched_wakeup -e sched_wakeup_new -e sched_wakingIf you get problem with lost events, then you may want to try the -r and -b options. For example:
trace-cmd record -e cpu_frequency -e cpu_idle -e sched_kthread_stop -e sched_kthread_stop_ret -e sched_migrate_task -e sched_move_numa -e sched_pi_setprio -e sched_process_exec -e sched_process_exit -e sched_process_fork -e sched_process_free -e sched_process_wait -e sched_stick_numa -e sched_swap_numa -e sched_switch -e sched_wait_task -e sched_wake_idle_without_ipi -e sched_wakeup -e sched_wakeup_new -e sched_waking -b 32768 -r 99The above will use kernel buffers that are a whopping 32 MB per cpu and run the capture threads with a real time priority of 99. You may want to adjust these values to suit your system.
You may also want to add additional events to the above command that are of interest to your software. You can get a list of available events by running the following command as root:
trace-cmd listIn order to open the trace with traceshark, it must first be converted to ASCII:
trace-cmd report trace.dat > file_to_open_with_traceshark.asc3.3 Capturing a trace with perf
With perf you may also want to consider additional events. A list of all events can be obtained by running the following command as root:
perf listA perf trace can be obtained by doing something like this:
perf record -e power:cpu_frequency -e power:cpu_idle -e sched:sched_kthread_stop -e sched:sched_kthread_stop_ret -e sched:sched_migrate_task -e sched:sched_move_numa -e sched:sched_pi_setprio -e sched:sched_process_exec -e sched:sched_process_exit -e sched:sched_process_fork -e sched:sched_process_free -e sched:sched_process_wait -e sched:sched_stick_numa -e sched:sched_swap_numa -e sched:sched_switch -e sched:sched_wait_task -e sched:sched_wake_idle_without_ipi -e sched:sched_wakeup -e sched:sched_wakeup_new -e sched:sched_waking -e cycles -a --call-graph=dwarf,20480 -m 128MThe --call-graph=dwarf,20480 option is needed, if you want to get stack traces for your events. You might need to adjust the size 20480, the maximum is 65528. The benefit with larger sizes is that you can capture bigger stacks, the downside is that the traces will be larger, tracing will have more overhead, and the probability that perf will lose some events is higher. I believe that you can use the -g option instead if your software is compiled with frame pointers.
The option -m 128M is needed to increase the memory used by perf for buffering in order to avoid lost events, especially when using the --call-graph option. This is necessary because traceshark doesn't cope well with lost events.
The stack trace of an event will be displayed by traceshark if you double click on the event's info field in the events view.
Typing the above commands every time may be error prone and tedious, for this reason, there is the perf-record.sh script in the scripts directory.
In order to get an ASCII representation that can be parsed by traceshark:
perf script -f > file_to_open_with_traceshark.ascNB: Your perf program need to be recent enough to work with traceshark, it may mean that you need to compile perf from the kernel sources of a recent kernel, rather than the perf that is supplied with your Linux distro.
It seems that some distros provide a perf program that is older than the kernel in the distro, or somehow a modified perf. This results in a trace being captured with some events in a different format than expected by traceshark, so that for example scheduling is not correctly shown.
One approach if the perf provided by your distro doesn't work with traceshark, is to check the kernel version with "uname -r", then go to kernel.org and download the corresponding mainline kernel and compile perf from the tools/perf directory in that kernel source tree. If it still doesn't work and you have a very old kernel, it might work to use perf from a newer kernel, although you would probably be better off if you upgraded both the kernel and perf but upgrading the kernel isn't always possible.
I am not exactly sure how recent perf/kernel is necessary but basically I believe that late 3.X and all 4.X and 5.x kernels to date should work as long as the perf program has not been patched.
If you use the '-g' flag, you might also want to compile your own perf because in some distros perf is compiled without support for backtraces and it starts working when you compile perf with those bits enabled. Fortunately, nowadays it's common that the perf utility shipped with the distro support backtraces.
When you compile perf, you get a report like this:
Auto-detecting system features:
...                         dwarf: [ on  ]
...            dwarf_getlocations: [ on  ]
...                         glibc: [ on  ]
...                          gtk2: [ OFF ]
...                      libaudit: [ on  ]
...                        libbfd: [ on  ]
...                        libelf: [ on  ]
...                       libnuma: [ on  ]
...        numa_num_possible_cpus: [ on  ]
...                       libperl: [ on  ]
...                     libpython: [ on  ]
...                      libslang: [ on  ]
...                     libcrypto: [ on  ]
...                     libunwind: [ OFF ]
...            libdw-dwarf-unwind: [ on  ]
...                          zlib: [ on  ]
...                          lzma: [ on  ]
...                     get_cpuid: [ on  ]
...                           bpf: [ on  ]
I believe that for backtraces to work, it's desirable that as many as possible of those dwarf, bfd, elf, and unwind related options are enabled. They tend to get automatically enabled if you have the necessary development packages installed on your machine.
On Ubuntu Bionic and Debian Buster/Bullseye the following might work:
sudo apt-get install binutils-dev binutils-multiarch-dev bison elfutils flex libaudit-dev libbfd-dev libdw-dev libelf-dev libelf1 libgtk2.0-dev libiberty-dev liblzma-dev libnuma-dev libperl-dev libslang2-dev libslang2 'libunwind*' libunwind8 python-dev libzstd-dev libcap-devOn Ubuntu Jammy, the following might work:
sudo apt-get install binutils-dev binutils-multiarch-dev bison elfutils flex libaudit-dev libbfd-dev libdw-dev libelf-dev libelf1 libgtk2.0-dev libiberty-dev liblzma-dev libnuma-dev libperl-dev libslang2-dev libslang2 libunwind-dev libunwind8 python3-dev libzstd-dev libcap-dev libtraceevent-dev libssl-dev libbabeltrace-dev python3-setuptools libpfm4-dev systemtap-sdt-dev java-common openjdk-8-jdkThe two examples above may need to be adjusted based on what kernel version you have.