logstash4dcache
Logstash + elasticsearch + kibana are modern tools to visualize logs and time-stamped data and can be used to monitor and visualize dCache's billing information.
The following setup is tested with Scientific Linux 6.5 with apache2
Installation
On the node with billing files
# /etc/yum.repos.d/logstash.repo
[logstash-1.4]
name=logstash repository for 1.4.x packages
baseurl=http://packages.elasticsearch.org/logstash/1.4/centos
gpgcheck=1
gpgkey=http://packages.elasticsearch.org/GPG-KEY-elasticsearch
enabled=1
# yum install logstash logstash-contribConfigure logstash
Create a file /etc/logstash/conf.d/dcache-billing.conf:
input {
  file {
    path => "/var/lib/dcache/billing/**/billing-20*"
    sincedb_path => "/var/tmp/sincedb-dcache"
    # uncomment next line if you want to import existing data
    # start_position => beginning
    # uncomment next line to import files with logstash 2.2.x
    # ignore_older => 0
    type => "dcache-billing"
  }
}

filter {

  if "RemoveFiles=" in [message] {
  # Because RemoveFiles= is the only(source needed) non-conforming event.
    grok {
      patterns_dir => "/etc/logstash/patterns"
      match => [ "message", "%{REMOVE_ON_POOL}" ]
      named_captures_only => true
      tag_on_failure => [ "_parse_dcache_failure10" ]
    } # End of grok
    mutate {
      split => [ "pnfsids", "," ]
      add_tag => [ "dcache_billing_removed" ]
    } # End of Mutate to make a real list of the entries in pnfsids

  } else {

    grok {
      patterns_dir => "/etc/logstash/patterns"
      match => [ "message", "%{TRANSFER_CLASSIC}" ]
      match => [ "message", "%{STORE_CLASSIC}" ]
      match => [ "message", "%{RESTORE_CLASSIC}" ]
      match => [ "message", "%{REQUEST_CLASSIC}" ]
      match => [ "message", "%{REQUEST_DCAP}" ]
      match => [ "message", "%{REMOVE_CLASSIC}" ]
      match => [ "message", "%{REMOVE_SRM}" ]
      named_captures_only => true
      remove_field => [ "message" ]
      tag_on_failure => [ "_parse_dcache_failure00" ]
    }

  } # End of if else

  date {
    match => [ "billing_time", "MM.dd HH:mm:ss" ]
    timezone => "CET"
    remove_field => [ "billing_time" ]
  }

  alter {
    condrewrite => [
      "is_write", "true", "write",
      "is_write", "false", "read"
    ]
  }
}

output {
  elasticsearch {
    host => "monitoring-host-name"
    index => "dcache-billing-%{+YYYY.MM.dd}"
    template_name => "billing"
    protocol => "http"
  }
}
Add parser for dCache's billing files
# mkdir /etc/logstash/patterns
# wget -O /etc/logstash/patterns/dcache-billing  https://raw.githubusercontent.com/dCache/logstash4dcache/master/patterns/dcache-billing
On the node which will run as monitoring system
# /etc/yum.repos.d/elasticsearch.repo
[elasticsearch-1.2]
name=Elasticsearch repository for 1.2.x packages
baseurl=http://packages.elasticsearch.org/elasticsearch/1.2/centos
gpgcheck=1
gpgkey=http://packages.elasticsearch.org/GPG-KEY-elasticsearch
enabled=1
# yum install yum-conf-epel httpd elasticsearch redisDownload and configure Kibana
# wget https://download.elasticsearch.org/kibana/kibana/kibana-3.0.1.tar.gz
# tar -xvzf kibana-3.0.1.tar.gz
# mv kibana-3.0.1 /var/www/html/kibana3
In the file /var/www/html/kibana3/config.js update line with 'elasticsearch:' (line 32?):
elasticsearch: "http://<your-host-name>:9200",Add apache config file to access kibana /etc/httpd/conf.d/kibana.conf:
  ProxyPass /elasticsearch http://localhost:9200
  ProxyPassReverse /elasticsearch http://localhost:9200
  Alias /kibana /var/www/html/kibana3

  <Location /kibana>
    Order deny,allow
    Deny from all
    Allow from <your-host-or-network>
  </Location>
Configure redis, in /etc/redis.conf
bind <your-ip-here>Notice, that bind ip MUST match one used in logstash config file in elasticsearch section.
Update /etc/sysconfig/elasticsearch to adjust memory available for elasticsearch. Do not use more then 1/2 of total memory.
ES_HEAP_SIZE=4gTweak elasticsearch for single node performance. Update /etc/elasticsearch/elasticsearch.yml
index.number_of_shards: 1
index.number_of_replicas: 0
Ready to go!
On monitoring host:
# service redis start
# service elasticsearch start
# service httpd start
We need to update tamplate for newly crated indexes (databases)
# curl -XPUT 'http://localhost:9200/_template/billing' -d '
  {
    "order":0,
    "template":"dcache-billing-*",
    "settings":{
      "index.refresh_interval":"5s"
    },
    "mappings":{
      "_default_":{
        "dynamic_templates":[
          {
            "string_fields":{
              "mapping":{
                "index":"analyzed",
                "omit_norms":true,
                "type":"string",
                "fields":{
                  "raw":{
                    "index":"not_analyzed",
                    "ignore_above":256,
                    "type":"string"
                  }
                }
              },
              "match_mapping_type":"string",
              "match":"*"
            }
          }
        ],
        "properties":{
          "geoip":{
            "dynamic":true,
            "path":"full",
            "properties":{
              "location":{
                "type":"geo_point"
              }
            },
            "type":"object"
          },
          "@version":{
            "index":"not_analyzed",
            "type":"string"
          }
        },
        "_all":{
          "enabled":true
        }
      }
    }
  }
'
On billing host:
# service logstash startThis configuration will crate a new index (database) for each day. The database for May 1 2014 can be dropped by:
curl -XDELETE 'http://localhost:9200/dcache-billing-2014.05.01'Creating a dashboard
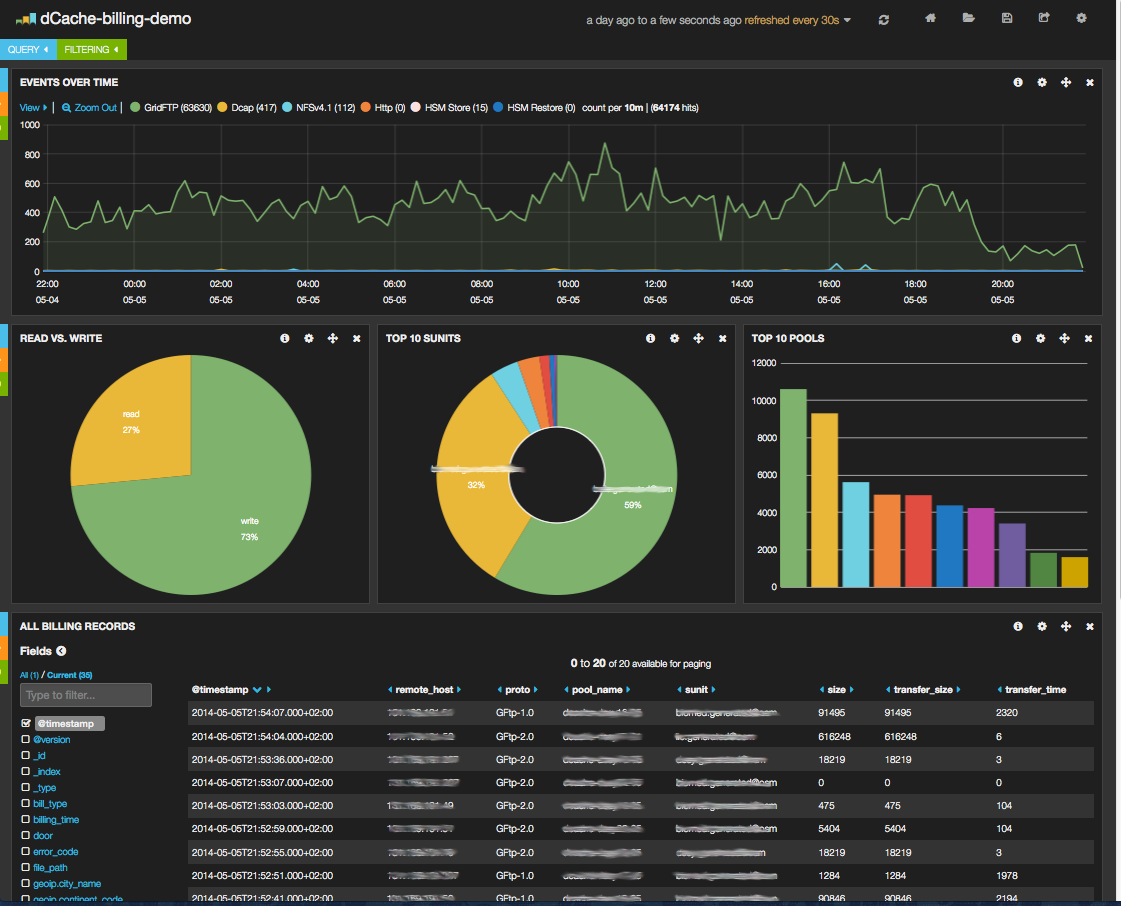
Point your browser to (http://your-monitoring-host/kibana/index.html#/dashboard/file/default.json) In the right upper corner, you can see the load icon ( in for of a folder ). Click on it -> Advanced -> Gist and paste this url dCache-billing-demo
You should get the same dashboard shown above.
We will be happy to see your own dashboards!