Closed rabernat closed 3 years ago
Thanks for the writeup and the motivation @rabernat . In general I agree with everything that you've written.
I'll try to lay out the challenge from a scheduling perspective. The worker notices that it is running low on memory. The things that it can do are:
Probably it should run some task, but it doesn't know which tasks generate data, and which tasks allow it to eventually release data. In principle we know that operations like from_hdf5
are probably bad for memory and operations like sum
are probably good, but we probably can't pin these names into the worker itself.
One option that I ran into recently is that we could slowly try to learn which tasks cause memory to arrive and which tasks cause memory to be released. This learning would happen on the worker. This isn't straightforward because there are many tasks running concurrently and their results on the system will be confused (there is no way to tie a system metric like CPU time or memory use to a particular Python function). Some simple model might give a decent idea over time though.
We do something similar (though simpler) with runtime. We maintain an exponentially weighted moving average of task run time, grouped by task prefix name (like from-hdf5
), and use this for scheduling heuristics.
This approach would also be useful for other resource constraints, like network use (it'd be good to have a small number of network-heavy tasks like from-s3
running at once), and the use of accelerators like GPUs (the primary cause of my recent interest).
If someone wanted to try out the approach above my suggestion would be to ...
key_split
)Worker.memory_monitor
and maybe make a new one
self.ready
and reprioritize?self.ready
we only accept those that we think reduce memory use?There are likely other solutions to this whole problem. But this might be one.
there is no way to tie a system metric like CPU time or memory use to a particular Python function
but we do measure the memory usage of the inputs and outputs of functions that have run (not the internal transient memory), and also know whether running of a function ought to free the memory used by its inputs. If measurements were done on the prefix basis mentioned, there could be a reasonable guess at the memory implications of running a given task.
Thanks a lot for your quick response.
One quick clarification question... You say that a central challenge is that the scheduler
doesn't know which tasks generate data, and which tasks allow it to eventually release data
In my mental model, this is obvious from the input and output array shapes. If a task has an input which is 1000x1000 and an output which is 10x10, it is a net sink of memory. The initial nodes of the graph are always sources. I assumed that the graph must know about these input and output shapes, and the resulting memory footprint, even if it has no idea how long each task will take. But perhaps I misunderstand how much the scheduler knows about the tasks it is running.
Wouldn't it be easier to expose this information to the scheduler than it would be to rig up an adaptive monitoring solution?
but we do measure the memory usage of the inputs and outputs of functions that have run (not the internal transient memory), and also know whether running of a function ought to free the memory used by its inputs. If measurements were done on the prefix basis mentioned, there could be a reasonable guess at the memory implications of running a given task.
That's a good point, and it's much easier to measure :)
In my mental model, this is obvious from the input and output array shapes. If a task has an input which is 1000x1000 and an output which is 10x10, it is a net sink of memory. The initial nodes of the graph are always sources. I assumed that the graph must know about these input and output shapes, and the resulting memory footprint, even if it has no idea how long each task will take. But perhaps I misunderstand how much the scheduler knows about the tasks it is running.
The scheduler doesn't know about shapes or dtypes of your arrays. It only knows that it is running a Python function, and that that function produces some outputs. You're thinking about Dask array, not Dask.
@martindurant 's suggestion is probably enough for your needs though.
The scheduler doesn't know about shapes or dtypes of your arrays
I suppose the client does, at least for arrays, so there could be another route to pass along the expected output memory size of some tasks. In the dataframe case, the client might know enough, and in the general case, there could be a way for users to specify expected output size.
Hi everyone,
This is a subject of interest to me too. But I thought that Dask tried already to minimize memory footprint as explained here. Obviously, this is not what @rabernat is observing, and I've seen the same behavior as him on similar use cases.
Couldn't we just give an overall strategy for the Scheduler to use? Like work on the depth of the graph first?
But I thought that Dask tried already to minimize memory footprint as explained here. Couldn't we just give an overall strategy for the Scheduler to use? Like work on the depth of the graph first?
The scheduler does indeed run the graph depth first to the extent possible (actually, it's a bit more complex than this, but your depth-first intuition is correct). Things get odd though if
These issues also impact my use cases.
One thing I've considered is rather than creating a graph purely composed of parallel reductions:
a b c d e f g h
\ / \ / \ / \ /
\ / \ /
\ / \ /
\ /
\ /
\ /
\ /
\ /
is to define some degree of parallelism (2 in this example) and then create two "linked lists", where the results of a previous operation are aggregated with those of the current.
a e
| |
b f
| |
c g
| |
d h
\ /
I haven't tried this out yet, so not sure to what extent it would actually help, but its on my todo list to mock the above up with dummy ops.
I suppose the client does, at least for arrays, so there could be another route to pass along the expected output memory size of some tasks. In the dataframe case, the client might know enough, and in the general case, there could be a way for users to specify expected output size.
In this context it's probably worth re-raising Task Annotations again: https://github.com/dask/dask/issues/3783, which in a complete form would allow annotating a task with an estimate of it's memory output. I started on it in https://github.com/dask/distributed/pull/2180 but haven't found time to push it forward.
This also affects my work-flow so I would be curious to see progress on it. On our end, writing out to disk doesn't help since disk is also a finite resource. We have a few workarounds such as adding artificial dependencies into a graph or submitting a large graph in pieces.
Thanks everyone for the helpful discussion. It sounds like @mrocklin and @martindurant have identified a concrete idea to try which could improve the situation. This issue is a pretty high priority for us in Pangeo, so we would be very happy to test any prototype implementation of this idea.
I’ll be on paternity leave for at least the next two weeks (maybe longer, depending on how things are going). If this is still open then I’ll tackle it then.
Hi folks...I'm just pinging this issue to remind us that it remains a crucial priority for Pangeo.
👍 it's on my list for tomorrow :)
https://nbviewer.jupyter.org/gist/TomAugspurger/2df7828c22882d336ad5a0722fbec842 has a few initial thoughts. The first problem is that the rechunking from along just axis 0 to just axis 1 cause a tough, global communication pattern. The output of my_custom_function
will need input from every original chunk.
So for this specific problem it may be an option to preserve the chunks along axis 0, and only add additional chunks along axis 1. This leads to a better communication pattern.
But, a few issues with that
I'll keep looking into this, assuming that a different chunking pattern isn't feasible.
(FYI @mrocklin the HTML array repr came in handy).
@TomAugspurger , the general problem remains interesting, though, of using the expected output size and known set of things that could be dropped of a given tasks as an additional heuristic in determining when/where to schedule that task.
Yep.
I notice now that my notebook oversimplified things. The original example still has chunks along the first and second axis before the map_blocks (which means the communication shouldn't be entirely global). I'll update things.
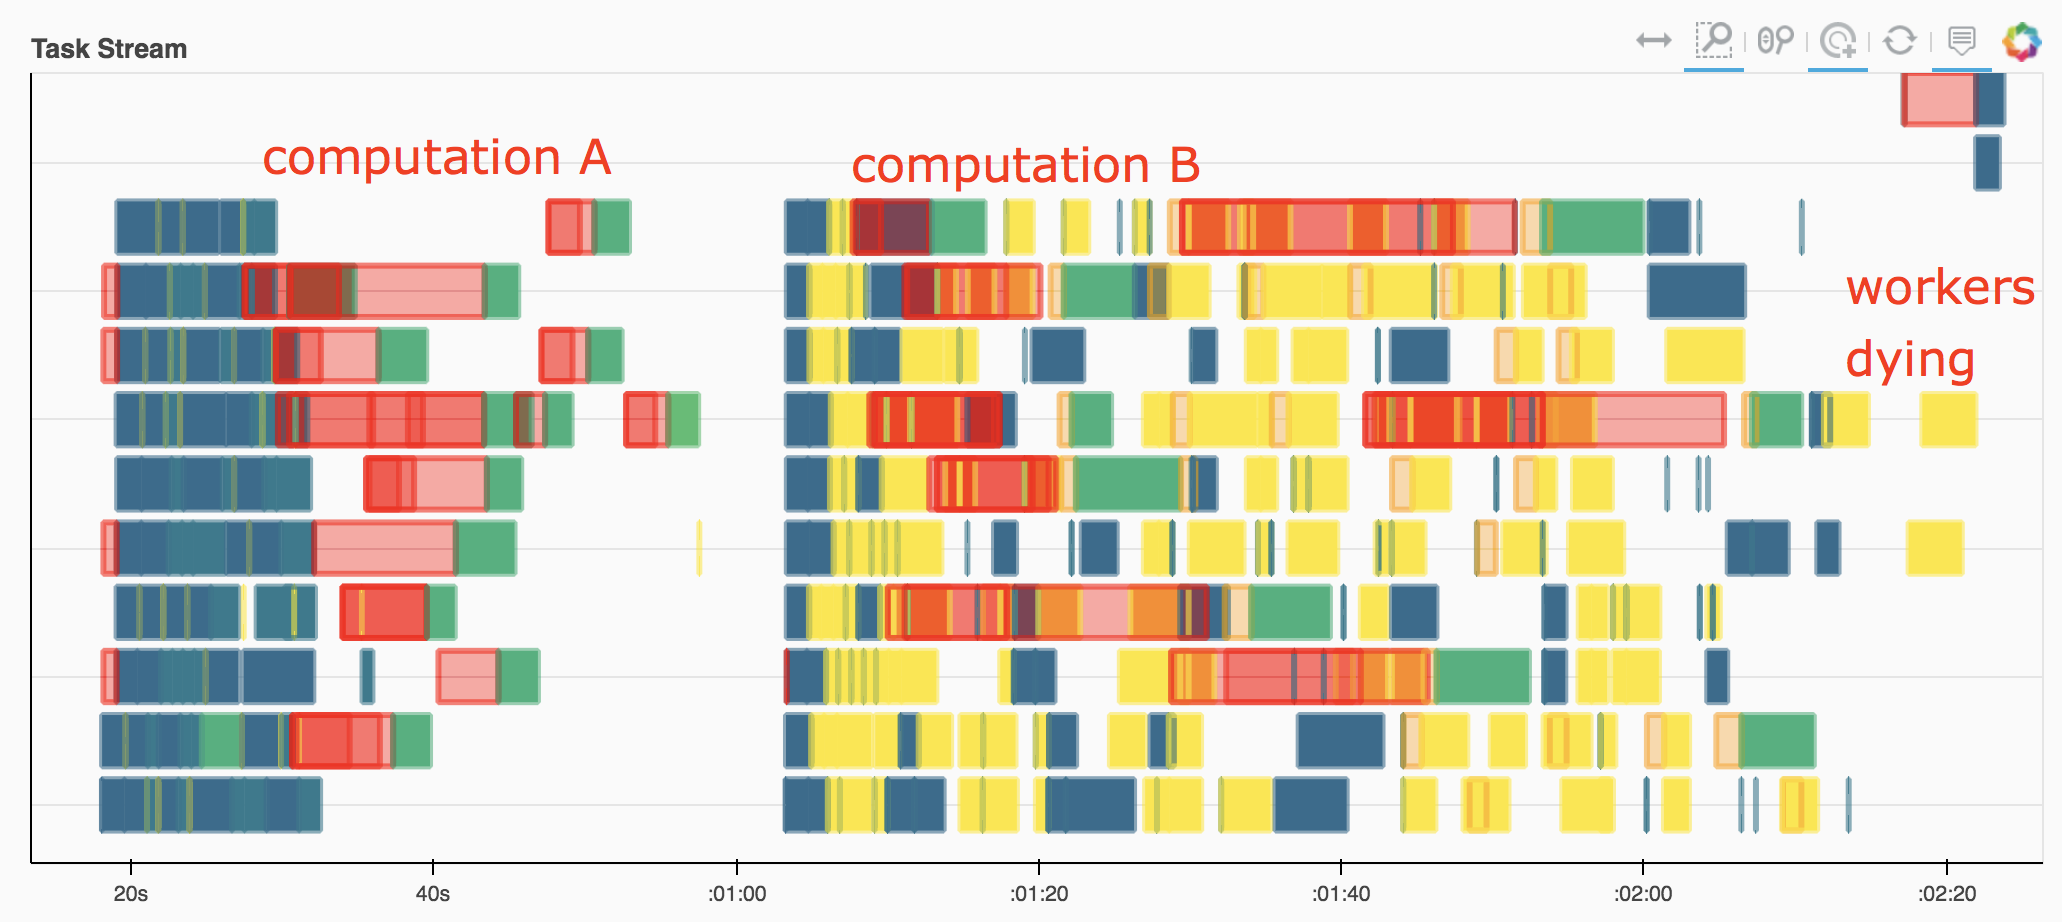
This is a "real world" example that can be run from ocean.pangeo.io which I believe illustrates the core issue. It is challenging because the chunks are big, leading to lots of memory pressure.
import intake
cat = intake.Catalog('https://raw.githubusercontent.com/pangeo-data/pangeo-datastore/master/intake-catalogs/ocean.yaml')
ds = cat.GODAS.to_dask()
print(ds)
salt_clim = ds.salt.groupby('time.month').mean(dim='time')
print(salt_clim)
# launch dask cluster
from dask.distributed import Client
from dask_kubernetes import KubeCluster
# using more workers might alleviate the problem, but that is not a satisfactory workaround
cluster = KubeCluster(n_workers=5)
client = Client(cluster)
# computation A
# compute just one month of the climatology
# it works fine, indicating that the computation could be done in serial
salt_clim[0].load()
# computation B
# now load the whole thing
# workers quickly run out of memory, spill to disk, and even get killed
salt_clim.load()
Thanks @rabernat. I'll try it out on the pangeo binder once I have something working locally.
I think (hope) I have a workable solution. My basic plan is
.nbytes
of tasks at the prefix-level (easy)So if we currently have high memory usage, and we see a set of tasks like
a1 a2 # 5 bytes, 5 bytes | x1 x2 # 5 bytes, 5 bytes
\ / | \ /
b # 1 byte | y # 20 bytes
We would (ideally) schedule b
before y
, since it tends to have a net
decrease in memory usage. Or if we have tasks running that we know will free up
some memory, we might wait to schedule y
since it tends to increase memory.
I'm sure there are things I'm missing, but this should provide a good start.
@TomAugspurger , that's exactly how I was picturing things. Additionally, you may need to know whether calculating b
, for example, actually releases a1
and a2
.
you may need to know whether calculating b, for example, actually releases a1 and a2.
Yeah, I've been looking through the recommendations -> release logic now. I'm wondering if we can also keep a counter of "completing this task recommended that we release this many bytes". That seems a bit easier to track than knowing whether a1
and a2
were actually released.
As a user of dask.array, it confuses me that the graph itself doesn't have this information in it already. In my mind, all of my dask.array operations know about the shape and dtype of their inputs and outputs. Consequently, the memory impact of a task is known a-priori.
I do understand that this information is not encoded into the dask graph--all the graph knows about is tasks and their dependencies. But, to my naive interpretation, it seems harder to try to "learn" the memory impact of tasks based on past experience than it does to pass this information through the graph itself, in the form of task annotation.
As a user of dask.array, it confuses me that the graph itself doesn't have this information in it already. In my mind, all of my dask.array operations know about the shape and dtype of their inputs and outputs. Consequently, the memory impact of a task is known a-priori.
As you say, TaskAnnotations mentioned by @sjperkins in https://github.com/dask/distributed/issues/2602#issuecomment-474232764 would let us pass that information through. I think that approach should be considered, but I have two reasons for pursing the "learning" approach within distributed for now
delayed
on a source that can't easily provide the memory usage information.I will take another look at the task annotation issue though.
A promising note, the additional LOC for the tracking seems to be ~3 :) I'm just keeping a task_net_nbytes
that tracks the difference between task input and output at the prefix-level. With that, we correctly see that
--------------------------------------------------------------------------------
# task_net_nbytes after all the computation is done.
{'my_custom_function': -18666656,
'random_sample': 20000000,
'rechunk-merge': 0,
'rechunk-split-rechunk-merge': 0}
The scheduling changes will be harder, but this seems promising so far.
@TomAugspurger said
We would (ideally) schedule b before y, since it tends to have a net decrease in memory usage
Sounds reasonable. As a warning, there might be other considerations fighting for attention here. Scheduling is an interesting balancing game.
@martindurant said
Additionally, you may need to know whether calculating b, for example, actually releases a1 and a2.
This is a nice point. One naive approach would be to divide the effect by the number of dependents of the dependency-to-be-released.
Also, I'm very glad to have more people thinking about the internal scheduling logic!
@mrocklin do you know off hand whether the changes to the scheduling logic are likely to be on the worker, scheduler, or both? I can imagine both situations occurring, so I suspect the answer is "both".
I would say either. Dask has task priorities in three places:
What you're proposing seems like it plays at the first level, similar to dask.order. You're going to want to be careful not to overwhelm the user provided priorities. I think that you're going to hit some interesting situations where bytes handling and dask.order disagree. In some ways bytes handling is smarter on a short term basis, but might bite you by being short sighted. It will be interesting to see what happens.
In terms of scheduler vs worker, the scheduler would be nicer because you can learn the bytes size across the cluster as a whole, rather than having to relearn on every worker. Learning on the worker is a bit nicer because you'll be able to update priorities more rapidly and it's always nice to move any potentially costly logic away from the scheduler. My sense is that it might not matter much where you implement the logic to start.
On Fri, May 24, 2019 at 12:00 PM Tom Augspurger notifications@github.com wrote:
@mrocklin https://github.com/mrocklin do you know off hand whether the changes to the scheduling logic are likely to be on the worker, scheduler, or both? I can imagine both situations occurring, so I suspect the answer is "both".
— You are receiving this because you were mentioned. Reply to this email directly, view it on GitHub https://github.com/dask/distributed/issues/2602?email_source=notifications&email_token=AACKZTB3OWMOUTWRN6H6ZGLPXANLXA5CNFSM4HEYFY22YY3PNVWWK3TUL52HS4DFVREXG43VMVBW63LNMVXHJKTDN5WW2ZLOORPWSZGODWF7DOI#issuecomment-495710649, or mute the thread https://github.com/notifications/unsubscribe-auth/AACKZTEDQHV77JAGZKMYR7LPXANLXANCNFSM4HEYFY2Q .
I could also imagine us not asking the client to run dask.order at all, and doing all task prioritization on the workers. This would allow us to integrate the byte sizes into the dask.order computation (and remove it from the single-threaded client-scheduler processing). This is probably something to explore as future work though.
I could also imagine us not asking the client to run dask.order at all, and doing all task prioritization on the workers.
FWIW, dask.order
does correctly order this workload. The final task of each parallel branch comes before the first task of the next branch.
So this looks more like a problem with reordering / waiting to execute some tasks, if we notice that we
@mrocklin question for you. In scheduler.py
when a task is completed, _add_to_memory
handles some things including marking that a task's dependencies may be ready for release https://github.com/dask/distributed/blob/d202e6253ed8ddc7919d0d4f128d88954e9859b8/distributed/scheduler.py#L3472-L3479
Do you know if there's something similar for Worker? Worker.put_key_in_memory
doesn't seem to have logic for maybe releasing dependencies of a recently completed task.
In my current approach, I'm using whether a task releases other tasks to measure the net memory usage of completing a task (output nbytes - sum of released memory).
Right, the Worker doesn't have the full graph (this would be hard to make consistent, especially if the graph is changing rapidly). It signals to the scheduler that a task has finished and hopefully a short time later the scheduler sends a release message back.
OK, then maybe prioritization isn't the right place to put this. Maybe workers just refuse to run tasks that are likely to increase memory when they are under memory pressure.
It signals to the scheduler that a task has finished and hopefully a short time later the scheduler sends a release message back.
Ah OK. I think I misunderstood https://distributed.dask.org/en/latest/scheduling-policies.html#last-in-first-out.
OK, then maybe prioritization isn't the right place to put this. Maybe workers just refuse to run tasks that are likely to increase memory when they are under memory pressure.
I think that'll be the first change to make. If that doesn't seem to work well in practice, I'll look into a "reorder priorities while under load" method on the scheduler.
I'll look into a "reorder priorities while under load" method on the scheduler.
To be clear, I think that the best place to handle this is on the worker. It will have many tasks that it can run, at some point when an individual worker runs low on free memory it switches to preferring memory-freeing tasks.
@rabernat in your computation, do you recall seeing messages like WARNING Memory use on tcp://192.168.7.20:53133 is high but worker has no data to store to disk. Perhaps some other process is leaking memory?
before your workers were killed?
I think the backpressure / reschedule based on memory usage idea is still valuable, but that warning, and the root cause behind it, are making things a bit more difficult for me. That warning is saying that we don't have an accurate picture of the worker processes memory, so scheduling decisions based on that are likely to be faulty. I'm trying to decide which rabbit hole to go down first.
When I try this on ocean.pangeo.io with 5 workers, I don't see those errors. And I don't actually have dying workers.
What I see is a task stream that looks like this:
At this point, all the workers are "orange" in memory consumption and are spilling massive amounts of data to disk. Progress grinds to a halt, but no errors are raised. (I interrupted the computation at this point; maybe if I had let it run longer something different would happen.)
(Edit: I am referring to my original standalone example with my_custom_function
.)
Thanks, I'll try out the original example on ocean.pangeo.io (when I tried the real-world example in https://github.com/dask/distributed/issues/2602#issuecomment-495262673 last weeks things seemed to work fine with a few workers)
when I tried the real-world example in #2602 (comment) last weeks things seemed to work fine with a few workers
This dataset was updated (made smaller) and probably doesn't produce that problem anymore.
Here is another classic example that produces the same problem. It uses xarray, but only to produce the indices needed for grouping. This is the example that is most relevant for climate stuff, because it is related to calculating climatologies.
import dask.array as dsa
import numpy as np
import xarray as xr
data = dsa.random.random((10000, 1000000), chunks=(1, 1000000))
da = xr.DataArray(data, dims=['time', 'x'],
coords={'day': ('time', np.arange(10000) % 100)})
clim = da.groupby('day').mean(dim='time')
anom = da.groupby('day') - clim
anom_mean = anom.mean(dim='time')
# works fine, meaning I could evaluate the mean in serial
# by using a loop
anom[0].load()
# runs out of memory quickly
anom_mean.load()
If you're going to focus on one example, this is the most important one.
This is, I think, a different situation from a scheduling perspective. I don't think that there is a way to compute that example in small memory without loading data twice. You have to load all of the data in order to compute clim
. And then you need that data again to compute anom_mean
.
The scheduling ask here is "be willing to delete and recompute data" while the scheduling ask before was "prefer tasks that release memory, and be willing to hold off a bit on tasks that increase net data".
I don't mean to say that this isn't also a valid issue, but it's completely different work on the Dask side, even though both issues manifest as memory issues.
(I also don't see a clear way forward on the "be willing to delete and recompute data" approach. A change like that would touch a lot of the scheduling code. I would estimate that at developer-months of time.)
Matt, thanks for the clarification. From my perspective, the issues seemed very similar--both fail due to memory overconsumption but can be executed successfully in a loop. But I understand now how they are not.
Some potentially interesting observations below on the original example (note that I've edited the call to map_blocks
to fix the output chunks, so that we get the metadata right. I'm also using a larger reduction (every 100th elements, rather than 15th) to make the reduced output fit on my laptop).
data_rc.blocks[0, 0]
just fine (~4 Mb). The custom reduction reduces the 4 Mb -> 40 Kb. We have ~500 of these per output block,
So [500 * 4 Kb] -> 4 Mb
per block in res
.res.blocks[0, 0]
, let alone res.compute()
.# manually build the graph
vblocks = []
for i in range(data_rc.numblocks[0]):
b = data_rc.blocks[0]
c1 = b.ravel()[::FACTOR].size // b.numblocks[1]
r = b.map_blocks(lambda x: x.ravel()[::FACTOR][None, :], drop_axis=2, chunks=(1, c1))
vblocks.append(r)
r = da.concatenate(vblocks)
Together, 2 and 3 point to an issue with map_blocks
not generating the ideal task graph when dropping axes and compressing chunks. I'll look into that independently. I think this scheduling issue is still higher priority.
When replacing the data_rc.map_blocks(my_custom_function, ...)
with the manually built version, I'm able to successfully perform the 200 Gb -> 2 Gb reduction on my laptop (2 workers, 2.5Gb each).
I also don't see a clear way forward on the "be willing to delete and recompute data" approach.
Would it be possible for the user to "trick" dask into recomputing the data by using distinct tokens?
I think the current way for users to work around this is to persist the small output of the large computation first:
clim = da.groupby('day').mean(dim='time').persist() # or .compute()
anom = da.groupby('day') - clim
anom_mean = anom.mean(dim='time')
That's essentially manually doing the two passes over the data that's required for this computation to not blow up memory.
How about registering a memory estimation function for a task? The idea being that, given the inputs to the task, it would estimate the memory of a task's output without doing the full work of the task.
The idea is somewhat similar to tensorflow's shape estimation API - given an operator's input shapes one can try to infer the output shape.
How about registering a memory estimation function for a task?
FWIW, with #2765 something like this would be possible with a scheduler plugin (but not documented / officially supported). I'm hesitant to do something like this now, since I think that Task annotations are likely to occur someday.
OK, just to be clear I wasn't necessarily thinking of including it under the banner of the Task Annotations. More something along the lines of the following pseudo-code:
def my_sum(a, b):
""" Sum equally shaped a and b arrays """
return a + b
@register_mem_estimator(my_sum)
def _sum_estimator(a, b):
""" Reduction, net sink """
return a.nbytes
class Scheduler(object):
...
def schedule(fn, *args, **kwargs):
try:
mem_estimator = estimator_lookup[fn]
except ImportError:
out_bytes = heuristic_estimator(fn, *args, **kwargs)
else:
out_bytes = mem_estimator(*args, **kwargs)
However, I don't understand the scheduler well enough to understand if the above is possible or any of the possible constraints.
Would it be possible for the user to "trick" dask into recomputing the data by using distinct tokens?
You could try fusing these functions into other tasks. We do this today with some getitem functinos
Hello @TomAugspurger @mrocklin any updates on progress here? Thank you !
In my work with large climate datasets, I often concoct calculations that cause my dask workers to run out of memory, start dumping to disk, and eventually grind my computation to a halt. There are many ways to mitigate this by e.g. using more workers, more memory, better disk-spilling settings, simpler jobs, etc. and these have all been tried over the years with some degree of success. But in this issue, I would like to address what I believe is the root of my problems within the dask scheduler algorithms.
The core problem is that the tasks early in my graph generate data faster than it can be consumed downstream, causing data to pile up, eventually overwhelming my workers. Here is a self contained example:
(Perhaps this could be simplified further, but I have done my best to preserve the basic structure of my real problem.)
When I watch this execute on my dashboard, I see the workers just keep generating data until they reach their memory thresholds, at which point they start writing data to disk, before
my_custom_function
ever gets called to relieve the memory buildup. Depending on the size of the problem and the speed of the disks where they are spilling, sometimes we can recover and manage to finish after a very long time. Usually the workers just stop working.This fail case is frustrating, because often I can achieve a reasonable result by just doing the naive thing:
and evaluating my computation in serial.
I wish the dask scheduler knew to stop generating new data before the downstream data could be consumed. I am not an expert, but I believe the term for this is backpressure. I see this term has come up in https://github.com/dask/distributed/issues/641, and also in this blog post by @mrocklin regarding streaming data.
I have a hunch that resolving this problem would resolve many of the pervasive but hard-to-diagnose problems we have in the xarray / pangeo sphere. But I also suspect it is not easy and requires major changes to core algorithms.
Dask version 1.1.4