Closed rabernat closed 3 years ago
Sorry, I was off last week. Getting back to it this week. But a short status update.
This branch does two things
Part 1 works well enough for now, I think (task annotations may help make things more exact in the future).
I'm struggling with part 2. I'm having trouble finding an acceptable scheduling policy that doesn't totally kill performance in some workloads.
@MikeAlopis if you have additional examples where you're unexpectedly running into worker memory errors, I'd be happy to see them. I think I'll want to test this out on a diverse set of workloads.
Would it make sense to merge in part 1 before part 2?
For review ease of review, yes. https://github.com/dask/distributed/pull/2847
I've been poking at this again. In the examples I've been using, the root cause of the memory blowing up is communication between workers. I see a few ways to address this
a-1 a-2 a-3 a-4
\ / \ /
b-1 b-2
| |
c-1 c-2
With two machines, we might schedule a-1
on machine 1 and a-2
on machine 2. Then we'll need to move the result of one to the other machine. We (maybe) would want to schedule a-1
and a-2
on the same machine. I have some thoughts on an API here, but haven't coded anything up yet. This wouldn't be a general solution, since many problems require some communication.
We (maybe) would want to schedule a-1 and a-2 on the same machine
Indeed. This would be great, and would help to accelerate many workloads if we could make this general.
I have some thoughts on an API here, but haven't coded anything up yet.
I'm mildly against a short term solution here that accepts hints from a user. Historically we've solved all of these scheduling problems at the core so that they affect all uses, not a special few. This approach has been, so far, effective.
If we can find a way to make it cheap enough, something might find its way into the worker objective:
There are things to balance here. It's an interesting problem.
worker_objective
might be too late, at least for the kinds of problems I'm playing with right now.
For problems that start with many inputs, which can be processed (mostly) in parallel, we go down the not-ideal path in the elif self.idle
here
Naively that makes sense. But for certain problems we're willing to pay a bit of time to find a better worker for each tasks.
@mrocklin do you know if we have any scheduling logic that looks at the "siblings" of a task? If I have (top to bottom)
a-1 a-2 a-3 a-4 a-5 a-6
\ | / \ | /
b-1 b-2
When I'm scheduling a-2
, I'd like to look at where a-1
and a-3
are perhaps scheduled to run (in testing on a toy problem, assigning this task to the worker with the most sibling tasks works).
It gets even stranger, right? Not just siblings, but cousins of various levels of removed-ness :) And at some point you're going to want to cut the family tree.
I don't know of any scheduling logic that we have currently. If I were to start solving this problem I would start with pen and paper, write down a variety of situations, figure out how I would go about scheduling them in a few situations, and hopefully build out some intuition for the problem.
Any updates or progress here? I’ve been experiencing symptoms that may be related to the same issue.
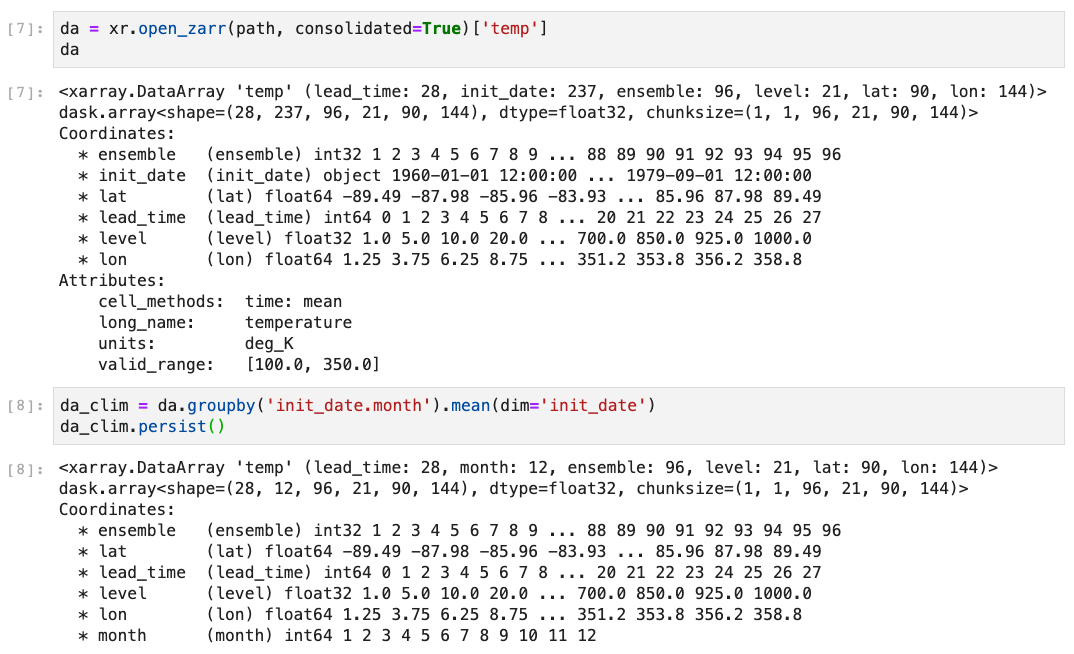
When running a groupby.mean
operation on a relatively large dataset using a dask cluster the memory usage of each worker increases very rapidly, to values substantially larger than what I would expect based on the chunking. The issue is particularly severe when accessing and processing data stored on an ultra-fast parallel file storage system.
My example also uses xarray,
Interestingly, the amount of memory used per worker is a function of the number of workers I provide. For a single worker, the maximum memory load is about what I would expect for this persist (~45GB). For two workers, each max out at 80GB per worker before the calculation finishes. For three workers, they start to spill to disk before the calculation completes (120GB per worker is the maximum I can request on the system I am using).
Just chiming in to say this remains a persistent and serious problem for many pangeo users. We are keen to help resolve it but not sure the best way to engage.
We are keen to help resolve it but not sure the best way to engage.
I get the sense that at this point the right way to engage is to find people who are interested in low memory task scheduling and have them dive into Dask's heuristics.
@TomAugspurger you looked at this problem most recently. Are you able to summarize the current state of things and avenues for work as you see them?
I'm still poking at it, but all my attempts (https://github.com/dask/distributed/pull/2847, https://github.com/dask/distributed/pull/2940, and others that haven't made it to PR stage) have failed.
Thus far, it's seemed like the most common issues have been communication heavy workloads. So the two solutions I've attempted are better scheduling to not need as much communication, and better handling communication when we are already high on memory.
Collecting workloads that fail is still helpful.
Turning to @dougiesquire's example (thanks for posting that), I'm roughly trying to replicate it with the following random data. For debugging, the arrays and number of chunks is much smaller.
>>> size = (3, 24, 96, 5, 9, 10)
>>> chunks = (1, 1, 96, 5, 9, 10)
>>> arr = da.random.random(size, chunks=chunks)
>>> arr
>>>
>>> items = dict(
>>> ensemble = np.arange(size[0]),
>>> init_date = pd.date_range(start='1960', periods=size[1]),
>>> lat = np.arange(size[2]).astype(float),
>>> lead_time = np.arange(size[3]),
>>> level = np.arange(size[4]).astype(float),
>>> lon = np.arange(size[5]).astype(float),
>>> )
>>> dims, coords = zip(*list(items.items()))
>>>
>>> array = xr.DataArray(arr, coords=coords, dims=dims)
>>> dset = xr.Dataset({'data': array})
>>> dset
<xarray.Dataset>
Dimensions: (ensemble: 3, init_date: 24, lat: 96, lead_time: 5, level: 9, lon: 10)
Coordinates:
* ensemble (ensemble) int64 0 1 2
* init_date (init_date) datetime64[ns] 1960-01-01 1960-01-02 ... 1960-01-24
* lat (lat) float64 0.0 1.0 2.0 3.0 4.0 ... 91.0 92.0 93.0 94.0 95.0
* lead_time (lead_time) int64 0 1 2 3 4
* level (level) float64 0.0 1.0 2.0 3.0 4.0 5.0 6.0 7.0 8.0
* lon (lon) float64 0.0 1.0 2.0 3.0 4.0 5.0 6.0 7.0 8.0 9.0
Data variables:
data (ensemble, init_date, lat, lead_time, level, lon) float64 dask.array<chunksize=(1, 1, 96, 5, 9, 10), meta=np.ndarray>
I see two issues. First, fuse_ave_width
is again a very important parameter to tune configuration, and the presence of a single root task that's the dependency of all the open_zarr
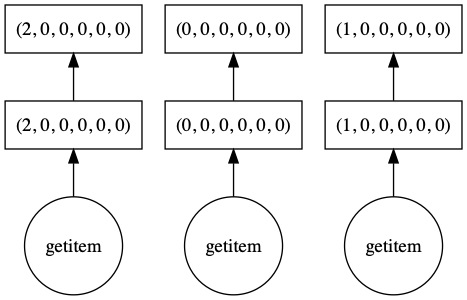
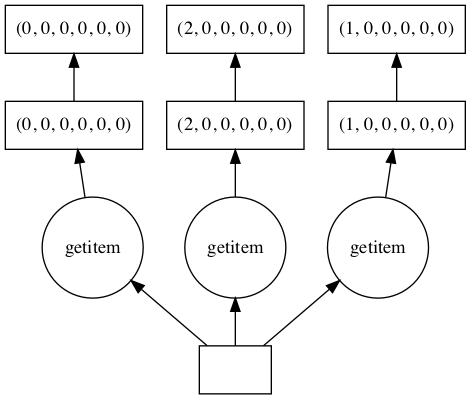
tasks causes issues with optimization. Consider the following four task graphs visualizing the dset['data'].groupby("init_date.month").mean(dim="init_date")
open_zarr
, default fusion:open_zarr
, with fuse_ave_width=200
(some large number):The Zarr vs. random issue looks like https://github.com/dask/distributed/issues/3032. I'll see what xarray is doing in open_zarr
. If it's using from_array
I'll see what things look like with concat
.
I'm not sure yet how that scales up to the larger datasets @dougiesquire's is working with. Presumably too much fusing there would mean way too large of chunks, but I haven't done the math yet.
See https://nbviewer.jupyter.org/gist/TomAugspurger/8c487aeef83fc018f6fed2b345b366c9
Stupid question: My solution to issues of this type at the moment is to use a single, multi-core worker. This works great for fixing the memory issue, but obviously means I'm limited by the size of a single node. Is there a way to "turn off" inter-worker communication?
For now, your best bet may be set the distributed.worker.connections.outgoing
config value to some small number (3-10?)
https://github.com/dask/distributed/pull/3071 will effectively do that automatically when the worker is under high memory pressure, so that too much communication won't end up killing a high-memory worker, but you still get the benefit of communicating with many workers when memory is normal.
For now, your best bet may be set the
distributed.worker.connections.outgoing
config value to some small number (3-10?)
Thanks for this, @TomAugspurger. Unfortunately tweaking distributed.worker.connections.outgoing
doesn't seem to make much difference at all.
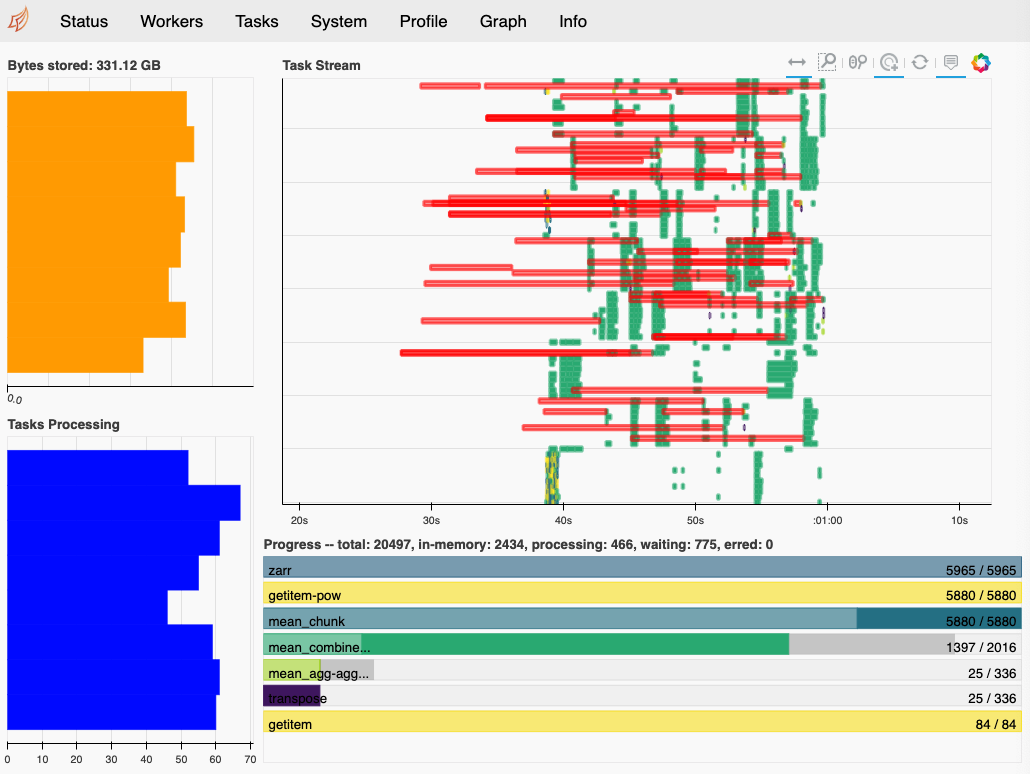
@dougiesquire what does the dashboard show just before the workers are dying? High memory usage and a lot of communication (overlaid in red)?
Yup - this is a screen shot of the dashboard as the workers start to die
the presence of a single root task that's the dependency of all the
open_zarr
tasks causes issues with optimization
What is this "root task"? Is it something we could eliminate on the xarray (or dask) side?
What is this "root task"?
By this I mean a task on which many other things depend. It is probably a reference to the Zarr file. You could probably optionally recreate the Zarr file in every task. In some cases that might slow things down. I'm not sure.
Folks here might want to take a look at https://github.com/dask/dask/pull/5451
Tom and I were playing with high level fusion, and this was an interesting outcome.
I believe @dougiesquire has provided some example(s) but is there anything additional someone facing this issue could log or document that could assist with a solution?
Nothing comes to mind at the moment. This probably needs someone to think hard about the problem and general task scheduling policies for a while. Most of the people who do that regularly are pretty backed up these days.
Short summary a call with @dougiesquire and @Thomas-Moore-Creative yesterday, looking at the problem described in https://github.com/dask/distributed/issues/2602#issuecomment-534795074.
This is a common
workload.
We eventually got things working well by setting fuse_ave_width
to a sufficiently large value for the workload. We tried with Dask 2.9 and unfortunately the root fusion wasn't enough to fuse things correctly for this workload. I'm going to explore that a bit more today.
@TomAugspurger - thank you for taking the time to look at the problem with us. Greatly appreciated and part of why we love this Pangeo community.
I can narrowly comment on @TomAugspurger's example of "open_zarr
with fuse_ave_width=200
" that resulted in this DAG:
Specifically, this doesn't fuse down similar to "random data with fusion" like
because of the hold_keys
optimization introduced in https://github.com/dask/dask/pull/2080.
Without hold_keys
, the optimized DAG looks like
To be honest, I still don't fully grok what we want to accomplish with hold_keys
, if it's still necessary, or if it can be improved.
To be honest, I still don't fully grok what we want to accomplish with hold_keys, if it's still necessary, or if it can be improved.
Often we don't want to inline the array object into every task. This is the case with numpy arrays (they're faster to serialize on their own, and we don't want to copy the full array for every individual task), and for objects like h5py.Datasets
which don't work well with pickle. It may be that with Zarr we do want to include the Zarr object within every task individually. This would be the case if it was very cheap to serialize.
I don't see why hold_keys
is necessary for any of what you just said. This may mean I don't understand what you just said, nor do I understand the previous discussions around hold_keys
. I understand what the code hold_keys
is doing, but I don't get why.
Furthermore, I suspect the graph from open_zarr
with fuse_ave_width=200
likely represents a failure of graph optimization, and, for this, hold_keys
is the culprit. Whatever the goal of hold_keys
, I suspect it's better done as part of fuse
. I would prefer to fix this optimization as a more general solution instead of repeating open_zarr
in every task.
open_zarr
above won't get fused, and it wouldn't get fused if it were a numpy array either.
It seems there are a couple considerations regarding what hold_keys
tries to do with getters such as getitem
.
Is this correct? Is (2) a primary concern? The consequence of being unserializable is that all direct dependents must be executed on the same worker, right?
I believe the open_zarr
example above is a failure case, because it results in sending the original objects to many, many tasks, and then the results of those tasks need to be sent around as part of a reduction. If the user knows their workflow and sets fuse_ave_width
very high, then dask should respect that and use the graph with three branches that I shared in my previous post.
I think fuse
can be improved if it's given two sets of keys that:
Thoughts?
Whatever the goal of hold_keys, I suspect it's better done as part of fuse
That could be. Looking at the docstring of hold_keys, one of the main objectives was to avoid fusing things like "x"
below:
{"x": np.array([1, 2, 3, ...]),
"y": (inc, "x"),
"z": (dec, "x"),
...
}
We don't want "x"
to be fused anywhere because it is easier to serialize as a raw value, rather than tucked away into a task.
Furthermore, I suspect the graph from open_zarr with fuse_ave_width=200 likely represents a failure of graph optimization, and, for this, hold_keys is the culprit.
I definitely agree that a width of 200 is a fail case. What are we trying to achieve with that example? I'm not sure that there is an optimization to be made?
For root fusion (I'm not sure that this is what we're talking about here or not) we would want to benefit in cases like the following:
x = da.open_zarr(...)
y = da.open_zarr(...)
z = x + y
z.sum().compute()
Ideally the matching chunks from x and y would be loaded on the same machine. This is easy to guarantee if they are part of the same task. Root fusion does this if the task doesn't have any dependencies, which in this case, they do, which blocks things. I'm not sure that any of the problems presented above have this structure though, so that might not be what we're talking about here.
So, do we know what the ask is here? Do we have confidence that the problem presented above is likely to be resolved by improved optimization?
Is (2) a primary concern? The consequence of being unserializable is that all direct dependents must be executed on the same worker, right?
Not quite. We can serialize these things, but only if they're bare tasks, because then our custom serialization can take over, rather than having to rely on pickle.
We've been seeing a number of weird errors (like killed workers) for which I think this problem might be the root cause.
We create dask arrays from HDF5 files, stack/concatenate them together to make one big array, and then typically do some slicing and dicing before a reduction step. We're using dask_jobqueue
to launch workers through Slurm. As the data involved gets bigger, I believe it's trying to load data too quickly rather than pushing it through to the reduction step. What puzzles me is: what are we doing that's strange? It seems like exactly the kind of use case that dask.array is meant to handle, and clearly not everyone has this problem.
We create dask arrays from HDF5 files, stack/concatenate them together to make one big array, and then typically do some slicing and dicing before a reduction step.
This is essentially the same pattern as climate science.
It seems like exactly the kind of use case that dask.array is meant to handle, and clearly not everyone has this problem.
Many of us do indeed have this problem. Users have developed several workarounds, none very satisfactory:
Yesterday @jcrist and I had an interesting chat about an idea that might help out. The idea was to have an explicit "fuse all upstream tasks" function. Maybe that will help us out a bit.
At this point, several institutions have significant amounts of money we could potentially throw at this problem, which has emerged as a serious roadblock for scaling dask. I would welcome ideas from the dask devs about how that money could be effectively deployed to fix this issue at its root cause.
Thanks! I have observed that throwing more resources at the problem sometimes makes it go away. I'll explore the other approaches you mention.
I also work at such an institution - European XFEL - and my immediate boss is a big fan of supporting the ecosystem of open source tools. So if there were a concrete plan for how money could be applied to make a substantial improvement in this area, I'd push for EuXFEL to contribute. (Obviously this is just me talking, and I can't promise anything)
@takluyver, depending on your HPC system and workflows, another potential (but also not very satisfactory) workaround may be to run your jobs using a single (multi-core) worker. This has helped me get through problematic jobs in the past.
At this point, several institutions have significant amounts of money we could potentially throw at this problem, which has emerged as a serious roadblock for scaling dask. I would welcome ideas from the dask devs about how that money could be effectively deployed to fix this issue at its root cause.
I apologize generally for not being able to resolve all of these problems recently. As Dask grows it gets harder to track everything personally. Money definitely helps to prioritize things though :) Thank you @rabernat for bringing this up. I'm starting to take on support contracts at Coiled, and hire some people to help work on them. Money goes a long way to giving us more bandwidth, especially on problems like this one that require some dedicated thinking. @rabernat @takluyver I'll reach out by e-mail.
I thought I would mention that this sort of problem is currently being discussed on the Pangeo discourse forum: https://discourse.pangeo.io/t/best-practices-to-go-from-1000s-of-netcdf-files-to-analyses-on-a-hpc-cluster/588/9 Folks may find some relevant points in that thread.
This seems like a good place to bring up a new option that I haven't seen discussed: Linux memory pressure statistics (https://www.kernel.org/doc/html/latest/accounting/psi.html). This is a fairly new metric, and it allows a fundamentally different approach to memory pressure.
Basically, it tells you "this is how much time you've spent waiting for the memory subsystem". So as memory resources get low, you start getting pressure feedback as swapping increases.
This means you don't have to try as hard to come up with estimates of memory usage in advance, you can be reactive to actual usage patterns as the code runs. You can imagine everything from "we should drop this cached data and recalculate" to load shedding to dynamically adjusting chunk sizes, based not just one guesses but an actual measurement of performance impact of current memory usage.
https://www.youtube.com/watch?v=cSJFLBJusVY is a good talk about how Facebook is using it, at a different level of abstraction than Distributed would, but the same approach (relying less on overprovisioning and prediction and more on reacting to actual usage) would likely be quite useful in Distributed as well.
Other notes: there's also CPU and I/O (i.e. disk, I think?) backpressure info, and you can get the info per cgroup (==container).
Hi all, thank you very much for exposing this challenge @rabernat ! The issue was very helpful to our team.
I am not sure this is the right place for it but don't know where to push it otherwise. I deeply apologize if this is not the place to report on this.
We have been using for some time an helper method in order to sequentially process large datasets along embarrassingly parallel dimensions and I'd like to share it: here
The method has proven to be very valuable with time and the hope is that it can help other people. There are most likely other approaches to do this and I would be very much looking forward to hear about it.
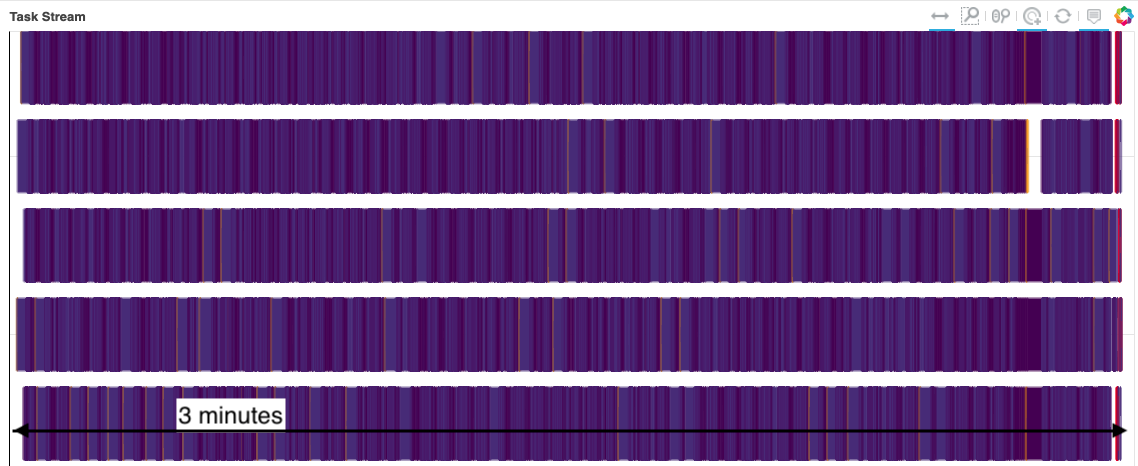
So #4892 helps with this a lot. On my laptop (8-core intel MPB, 32GB memory), @rabernat's original example at the top of of this issue takes:
main
: 43 minutes, spills ~130GB data to disk, makes my system largely unresponsivemain (performance report):
I want to give a big shout-out to @JSKenyon, who so clearly identified the problem in #4864, and @fjetter who started us towards a solution. Dask had been scheduling the initial data-creation tasks in a very bad way, leading to huge amounts of unnecessary data transfer, and therefore data duplication, and therefore ballooning memory usage.
I made two changes before running these trials:
Added a .copy()
at the end of the "pretend memory-reducing function":
def my_custom_function(f):
# a pretend custom function that would do a bunch of stuff along
# axis 0 and 2 and then reduce the data heavily
return f.ravel()[::15][None, :].copy() # <-- key: copy the slice to release `f`
This is essential, because the small slice of f
we were returning was just a view of f
's memory. And that meant all of f
's memory had to stick around—so the memory-reducing function was not reducing memory at all! The NumPy docs even mention this:
Care must be taken when extracting a small portion from a large array which becomes useless after the extraction, because the small portion extracted contains a reference to the large original array whose memory will not be released until all arrays derived from it are garbage-collected. In such cases an explicit
copy()
is recommended.
This is unintuitive behavior, but I wonder how often it happens unknowingly with Dask, and if it plays a role in real-world cases. I wonder if we could add logic to Dask to warn you of this situation, where the memory backing an array result is, say, 2x larger than memory needed for the number of elements in that array, and suggest you make a copy.
Ran under jemalloc to avoid the unreleased memory issue (@crusaderky has explained this clearly in the Dask docs):
DYLD_INSERT_LIBRARIES=$(brew --prefix jemalloc)/lib/libjemalloc.dylib python backpressure.py
It probably would have still worked without this, but would have spilled more and been messier.
It's also interesting that memory backpressure wouldn't have helped with this exact example snippet. Because of the view-vs-copy issue, that code was essentially trying to compute all 93 GiB of the original data into memory. No matter your order through the graph, that end result's just not possible.
Not to say that we won't ever need memory backpressure (xref #4891). But I wonder how many other cases that feel like Dask is producing more data than it can consume actually involve other sly bugs like the ones here. (Both the view-vs-copy and the poor ordering of root tasks were sly bugs, on behalf of a user and of dask.) And if there are tools/visualizations to help identify these issues that would serve us better than adding more complexity (memory backpressure) to try to work around them.
I'd love to hear if folks who have also run into these memory problems could retry their workloads with this update and report back how things change?
But I wonder how many other cases that feel like Dask is producing more data than it can consume actually involve other sly bugs like the ones here. ... And if there are tools/visualizations to help identify these issues that would serve us better than adding more complexity (memory backpressure) to try to work around them.
For issues that involve allocating too much memory or holding on to too much memory, you can figure out the sources of peak memory usage using the Fil memory profiler. Though for now you'll need to use the threaded or single-threaded Dask schedulers, it doesn't support subprocesses yet.
I've tried rerunning a couple examples from this thread under the new PR. Performance is greatly improved.
20-worker cluster with 2-CPU, 10GiB workers
main
: 624.51sMALLOC_TRIM_THRESHOLD_=0
: 93.42s (6x speedup)@mrocklin originally said about this example:
I don't think that there is a way to compute that example in small memory without loading data twice. You have to load all of the data in order to compute
clim
. And then you need that data again to computeanom_mean
.The scheduling ask here is "be willing to delete and recompute data" while the scheduling ask before was "prefer tasks that release memory, and be willing to hold off a bit on tasks that increase net data".
This is still true. However in this example, data
was only 200GiB, which is a reasonable size for a cluster (mine had exactly 200GiB total memory). So this still won't work on your laptop. But on a cluster, when we place the initial chunks of data
well so they don't have to be shuffled around later, we can actually compute this quite efficiently.
20-worker cluster with 2-CPU, 20GiB workers
main
+ MALLOC_TRIM_THRESHOLD_=0
: gave up after 30min and 1.25TiB spilled to disk (!!)MALLOC_TRIM_THRESHOLD_=0
: 230sFWIW, even with the colocation PR, this struggled when workers only had 8GiB of memory. Bumping to 20GiB smoothed things out (well, not for main
). It would still be really cool if dask/distributed could tell you what amount of memory per worker was necessary to compute a given graph.
Wow, this is really terrific @gjoseph92 ! Thanks heaps. Looking forward to giving it a spin.
@gjoseph92 - that left-hand dashboard looks sadly familiar but the one on the right looks really exciting! Fantastic.
It would still be really cool if dask/distributed could tell you what amount of memory per worker was necessary to compute a given graph.
+1 @mrocklin how much crowd-sourcing do you think we need to make that happen? ;-)
So 200GiB problem required 400GiB cluster memory to run smoothly? Seems like what happens generally from experience?
Be interesting to try that same test in the single large machine case - e.g. run the above ona 512GB machine what happens?
@mrocklin how much crowd-sourcing do you think we need to make that happen? ;-)
Have you filled out the dask survey yet? dask.org/survey
A lot of what we're working on now is motivated by responses there. Although this work itself comes from generous sponsorship from @rabernat and crew.
(hopefully) obviously it was a cheeky comment @mrocklin - but your response got me thinking about how other orgs ( beyond @rabernat et al ) might try to help resource these efforts.
Thanks for all the hard work from all contributors. Going to hit that survey now.
Tell all your friends!
Really well done by all involved!
This does look like a huge improvement! I look forward to trying it out on my problems.
EXciting!
This is essential, because the small slice of f we were returning was just a view of f's memory. And that meant all of f's memory had to stick around—so the memory-reducing function was not reducing memory at all! This is unintuitive behavior, but I wonder how often it happens unknowingly with Dask, and if it plays a role in real-world cases. I wonder if we could add logic to Dask to warn you of this situation, where the memory backing an array result is, say, 2x larger than memory needed for the number of elements in that array, and suggest you make a copy.
@gjoseph92 This happens all the time! See https://github.com/dask/dask/issues/3595 (especially https://github.com/dask/dask/issues/3595#issuecomment-449544992) @mrocklin proposed a solution here: https://github.com/dask/dask/issues/3595 . I use the map_blocks(np.copy)
trick frequently
@dcherian thanks for the xref! https://github.com/dask/dask/issues/3595#issuecomment-451355007 is exactly what I was thinking. (It wouldn't help with user code in map_blocks
like this case specifically, but since that's advanced, maybe that's okay.) I might like to take this on.
From a Coiled resourcing perspective, +1 on spending time on the getitem fix. That seems cheap to implement and medium-high value.
On Wed, Jun 30, 2021 at 9:32 AM Gabe Joseph @.***> wrote:
@dcherian https://github.com/dcherian thanks for the xref! dask/dask#3595 (comment) https://github.com/dask/dask/issues/3595#issuecomment-451355007 is exactly what I was thinking. (It wouldn't help with user code in map_blocks like this case specifically, but since that's advanced, maybe that's okay.) I might like to take this on.
— You are receiving this because you were mentioned. Reply to this email directly, view it on GitHub https://github.com/dask/distributed/issues/2602#issuecomment-871556900, or unsubscribe https://github.com/notifications/unsubscribe-auth/AACKZTBBHQSYYGDLSQQDCITTVNBJRANCNFSM4HEYFY2Q .
In my work with large climate datasets, I often concoct calculations that cause my dask workers to run out of memory, start dumping to disk, and eventually grind my computation to a halt. There are many ways to mitigate this by e.g. using more workers, more memory, better disk-spilling settings, simpler jobs, etc. and these have all been tried over the years with some degree of success. But in this issue, I would like to address what I believe is the root of my problems within the dask scheduler algorithms.
The core problem is that the tasks early in my graph generate data faster than it can be consumed downstream, causing data to pile up, eventually overwhelming my workers. Here is a self contained example:
(Perhaps this could be simplified further, but I have done my best to preserve the basic structure of my real problem.)
When I watch this execute on my dashboard, I see the workers just keep generating data until they reach their memory thresholds, at which point they start writing data to disk, before
my_custom_function
ever gets called to relieve the memory buildup. Depending on the size of the problem and the speed of the disks where they are spilling, sometimes we can recover and manage to finish after a very long time. Usually the workers just stop working.This fail case is frustrating, because often I can achieve a reasonable result by just doing the naive thing:
and evaluating my computation in serial.
I wish the dask scheduler knew to stop generating new data before the downstream data could be consumed. I am not an expert, but I believe the term for this is backpressure. I see this term has come up in https://github.com/dask/distributed/issues/641, and also in this blog post by @mrocklin regarding streaming data.
I have a hunch that resolving this problem would resolve many of the pervasive but hard-to-diagnose problems we have in the xarray / pangeo sphere. But I also suspect it is not easy and requires major changes to core algorithms.
Dask version 1.1.4