I'm closing this out. If folks have other issues here though then I'm happy to reopen.
@rabernat , thank you for opening this originally. My apologies that it took so long to come to a good solution.
Closed rabernat closed 3 years ago
I'm closing this out. If folks have other issues here though then I'm happy to reopen.
@rabernat , thank you for opening this originally. My apologies that it took so long to come to a good solution.
Which dask release do users need to be running to get this feature? My impression is 2021.07.0, correct?
I think anything 2021.07 or greater should work. We're also releasing 2021.07.2 today if you wanted to wait a day :)
On Fri, Jul 30, 2021 at 6:12 AM Ryan Abernathey @.***> wrote:
Which dask release do users need to be running to get this feature?
— You are receiving this because you modified the open/close state. Reply to this email directly, view it on GitHub https://github.com/dask/distributed/issues/2602#issuecomment-889821511, or unsubscribe https://github.com/notifications/unsubscribe-auth/AACKZTCMKTQFEGPRUEWISCTT2KCJRANCNFSM4HEYFY2Q .
I am working on a blog post to advertise the exciting progress we have made on this problem. As part of this, I have created an example notebook that can be run in Pangeo Binder (including with Dask Gateway) with two different versions of Dask which attempts to reproduce the issue and its resolution.
Older Dask version (2020.12.1): https://binder.pangeo.io/v2/gh/pangeo-gallery/default-binder/b8d1c53?urlpath=git-pull%3Frepo%3Dhttps%253A%252F%252Fgist.github.com%252Frabernat%252F39d8b6a396e076d168c24167b8871c4b%26urlpath%3Dtree%252F39d8b6a396e076d168c24167b8871c4b%252Fanomaly_std.ipynb%26branch%3Dmaster
The notebook uses the following cluster settings, which is the biggest cluster we can reasonably share publicly on Pangeo Binder:
nworkers = 30
worker_memory = 8
worker_cores = 1
It includes both the "canonical anomaly-mean example example" with synthetic data from https://github.com/dask/distributed/issues/2602#issuecomment-498718651 (referenced by @gjoseph92 in https://github.com/dask/distributed/issues/2602#issuecomment-870930134) as well as a similar real-world example that uses cloud data.
I have found that the critical performance issues are largely resolved even in Dask 2020.12.1 when I use options.environment = {"MALLOC_TRIM_THRESHOLD_": "0"}. For the synthetic data example, the older Dask version (pre #4967) is just a few s slower. For the real-world data example, the new version is significantly faster (2 min vs. 3 min), but nowhere close to the 6x increases reported above. But if I don't set MALLOC_TRIM_THRESHOLD_, both clusters crash. This leads me to conclude that, for these workloads, MALLOC_TRIM_THRESHOLD_ is much more important than #4967.
My questions for the group are:
MALLOC_TRIM_THRESHOLD_ makes the biggest differences for these climatology-anomaly-style workloads, is there an alternative workflow that would better highlight the improvements of #4967 for the blog post?MALLOC_TRIM_THRESHOLD_=0 on all of our clusters?(edit below)
@dougiesquire's climactic mean example from #2602 (comment)
20-worker cluster with 2-CPU, 20GiB workers
main+MALLOC_TRIM_THRESHOLD_=0: gave up after 30min and 1.25TiB spilled to disk (!!)- Co-assign root-ish tasks #4967 +
MALLOC_TRIM_THRESHOLD_=0: 230s
I am now trying to run this example, which should presumably reproduce the issue better.
Latest edit:
I ran a slightly modified version of the "dougiesquire's climactic mean example" and added it to the gist. The only real change I made was to also reduce over the ensemble dimension in order to reduce the total size of the final result--otherwise you end up with a 20GB array that can't fit into the notebook memory.
Using MALLOC_TRIM_THRESHOLD_=0 and comparing Dask 2020.12.0 vs. 2021.07.1, I found 6min 49s vs. 4min 13s. This is definitely an improvement, but very different from @gjoseph92's results ("main + MALLOC_TRIMTHRESHOLD=0: gave up after 30min and 1.25TiB spilled to disk (!!)")
So I can definitely see evidence of an incremental improvement, but I feel like I'm still missing something.
Thanks Ryan. Have not tested this on anything seriously large, but hopefully will soon.
but I feel like I'm still missing something.
This thread is a confusing mix of many issues. The slice vs copy issue is real, but doesn't affect groupby problems since xarray indexes out groups with a list-of-ints (always a copy) [except for resampling which uses slices].
result = dset['data'].groupby("init_date.month")
This example (from @dougiesquire I think) has chunksize=1 along init_date which is daily frequency. Xarray's groupby construct a nice graph for this case so it executes well (it'll pick out all chunks with january data and apply dask.array.mean; this is embarrassingly parallel for different groups). If it doesn't execute well, that's up to dask+distributed to schedule it properly. Note that the writeup in https://github.com/ocean-transport/coiled_collaboration/issues/17 only discusses this example.
The earlier example:
cat = intake.Catalog('https://raw.githubusercontent.com/pangeo-data/pangeo-datastore/master/intake-catalogs/ocean.yaml')
ds = cat.GODAS.to_dask()
print(ds)
salt_clim = ds.salt.groupby('time.month').mean(dim='time')
ds.salt has chunksize=4 along time with a monthly mean in each timestep so there are 4 months in a block
Array |
Chunk |
|---|---|
| 11.31 GB | 96.08 MB |
| (471, 40, 417, 360) | (4, 40, 417, 360) |
| 119 Tasks | 118 Chunks |
| float32 | numpy.ndarray |
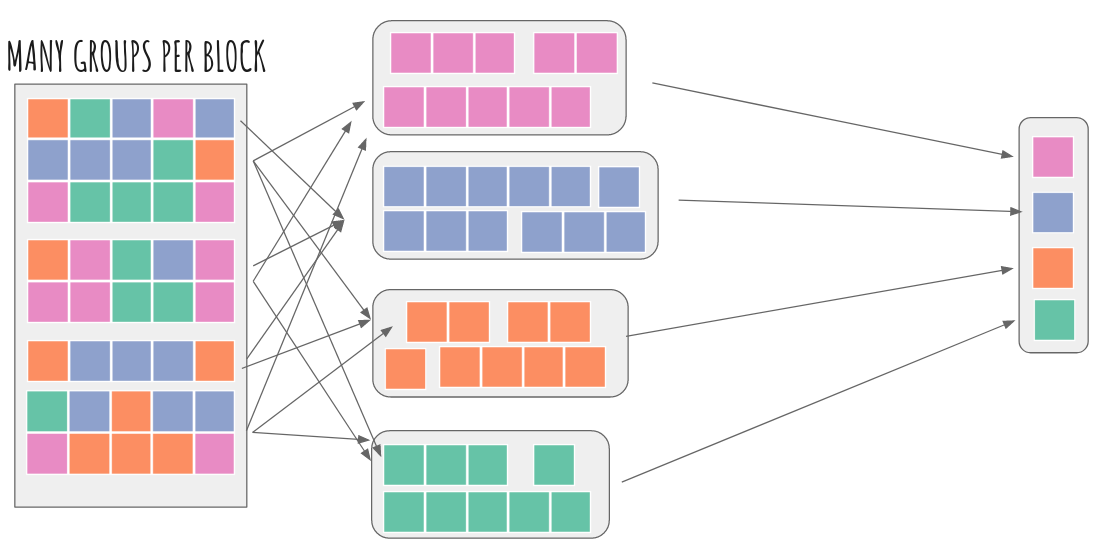
So groupby("time.month") splits every block into 4 and we end up with a quadratic-ish shuffling-type workload that tends to work poorly (though I haven't tried this on latest dask)

The best way to reduce the GODAS dataset should be this strategy: https://flox.readthedocs.io/en/latest/implementation.html#method-cohorts i.e. we index out months 1-4 which always occur together and map-reduce that. Repeat for all other cohorts (months 5-8, 9-12) and then concatenate for the final result.
One could test this with flox.xarray.xarray_reduce(ds.salt, ds.time.dt.month, func="mean", method="cohorts") and potentially throw in engine="numba" for extra fun =) Who wants to try it?!
Though this issue is closed, I imagine that most of you following it are still interested in memory usage in dask, and might still be having problems with it. It's possible that closing this with https://github.com/dask/distributed/pull/4967 was premature, but I'm hoping that https://github.com/dask/distributed/pull/6614 actually addresses the core problem in this issue.
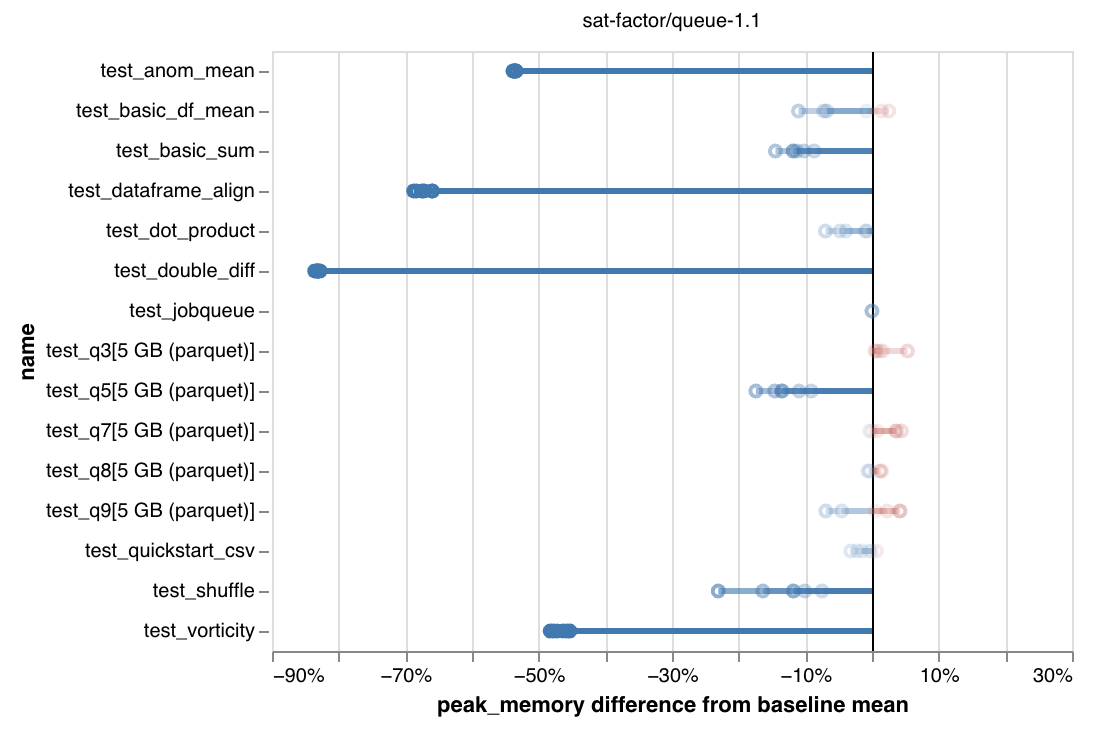
If you are (or aren't) having problems with workloads running out of memory, please try out the new worker-saturation config option!
Information on how to set it is here. And please comment on the discussion to share how it goes:
These are benchmarking results showing significant reductions in peak memory use:

We're especially interested in hearing how the runtime-vs-memory tradeoff feels to people. So please try it out and report back!
Lastly, thank you all for your collaboration and persistence in working on these issues. It's frustrating when you need to get something done, and dask isn't working for you. The examples everyone has shared here have been invaluable in working towards a solution, so thanks to everyone who's taken their time to keep engaging on this.
Thanks @gjoseph92
In my work with large climate datasets, I often concoct calculations that cause my dask workers to run out of memory, start dumping to disk, and eventually grind my computation to a halt. There are many ways to mitigate this by e.g. using more workers, more memory, better disk-spilling settings, simpler jobs, etc. and these have all been tried over the years with some degree of success. But in this issue, I would like to address what I believe is the root of my problems within the dask scheduler algorithms.
The core problem is that the tasks early in my graph generate data faster than it can be consumed downstream, causing data to pile up, eventually overwhelming my workers. Here is a self contained example:
(Perhaps this could be simplified further, but I have done my best to preserve the basic structure of my real problem.)
When I watch this execute on my dashboard, I see the workers just keep generating data until they reach their memory thresholds, at which point they start writing data to disk, before
my_custom_functionever gets called to relieve the memory buildup. Depending on the size of the problem and the speed of the disks where they are spilling, sometimes we can recover and manage to finish after a very long time. Usually the workers just stop working.This fail case is frustrating, because often I can achieve a reasonable result by just doing the naive thing:
and evaluating my computation in serial.
I wish the dask scheduler knew to stop generating new data before the downstream data could be consumed. I am not an expert, but I believe the term for this is backpressure. I see this term has come up in https://github.com/dask/distributed/issues/641, and also in this blog post by @mrocklin regarding streaming data.
I have a hunch that resolving this problem would resolve many of the pervasive but hard-to-diagnose problems we have in the xarray / pangeo sphere. But I also suspect it is not easy and requires major changes to core algorithms.
Dask version 1.1.4