Background
This report provides information on a client's distribution and data replication of the storage providers being used.
The results from this report should only be used as a guide for analyzing a particular client. When using this report in conjunction with the individual context of a client, there could be a completely valid explaination that negates the client from being flagged in the first place. This should be determined on a case by case basis.
If you have any questions or feedback for the cid-checker, you can leave a comment in cid-tracker-tooling slack channel or open an issue.
Triggering the report
this report can be triggered on a specific application in the filecoin-plus-large-datasets repo for a specific client application using the following methods:
- label trigger - when a label of
state:Approvedis added to the github issue. - manually trigger - add a comment to an application with this text:
checker:manualTrigger - combine with other addresses - add a comment to an application with this text:
checker:manualTrigger <other_address_1> <other_address_2> .... This is useful if those addresses belong to the same series of LDN applications.
Report Breakdown
all assets for these reports are uploaded to filplus-checker-assets.
Storage Provider Distribution
A table showing the distribution of storage providers that have stored data for the client, along with approximate location, total deals sealed, unique data stored, and percentage of duplicate deals for each provider. Criteria for flaggable events is listed in the report itself.
Healthy Report

Flagged Report

Deal Data Replication
A table showing the replication of unique data across storage providers, along with information on the size of the unique data, total deals made, number of providers, and deal percentage for each data replication category. In general, a healthy data replication chart would show higher number of replication counts across providers moving towards the right side of the x-axis (colored green). If there is a large amount of data that is only replicated between a smaller provider set, this is viewed as a flaggable condition.
Healthy Report

Flagged Report

Shared CIDs
A table showing the provider breakdown and number of CIDs that have been shared across providers. CID sharing can be seen as an flaggable condition.
Healthy Report

Flagged Report

Retrieval Report
We've created a new report that shows how well clients and SPs are doing in terms of retrievability. It is powered by RetrievalBot
Retrieval Statistics
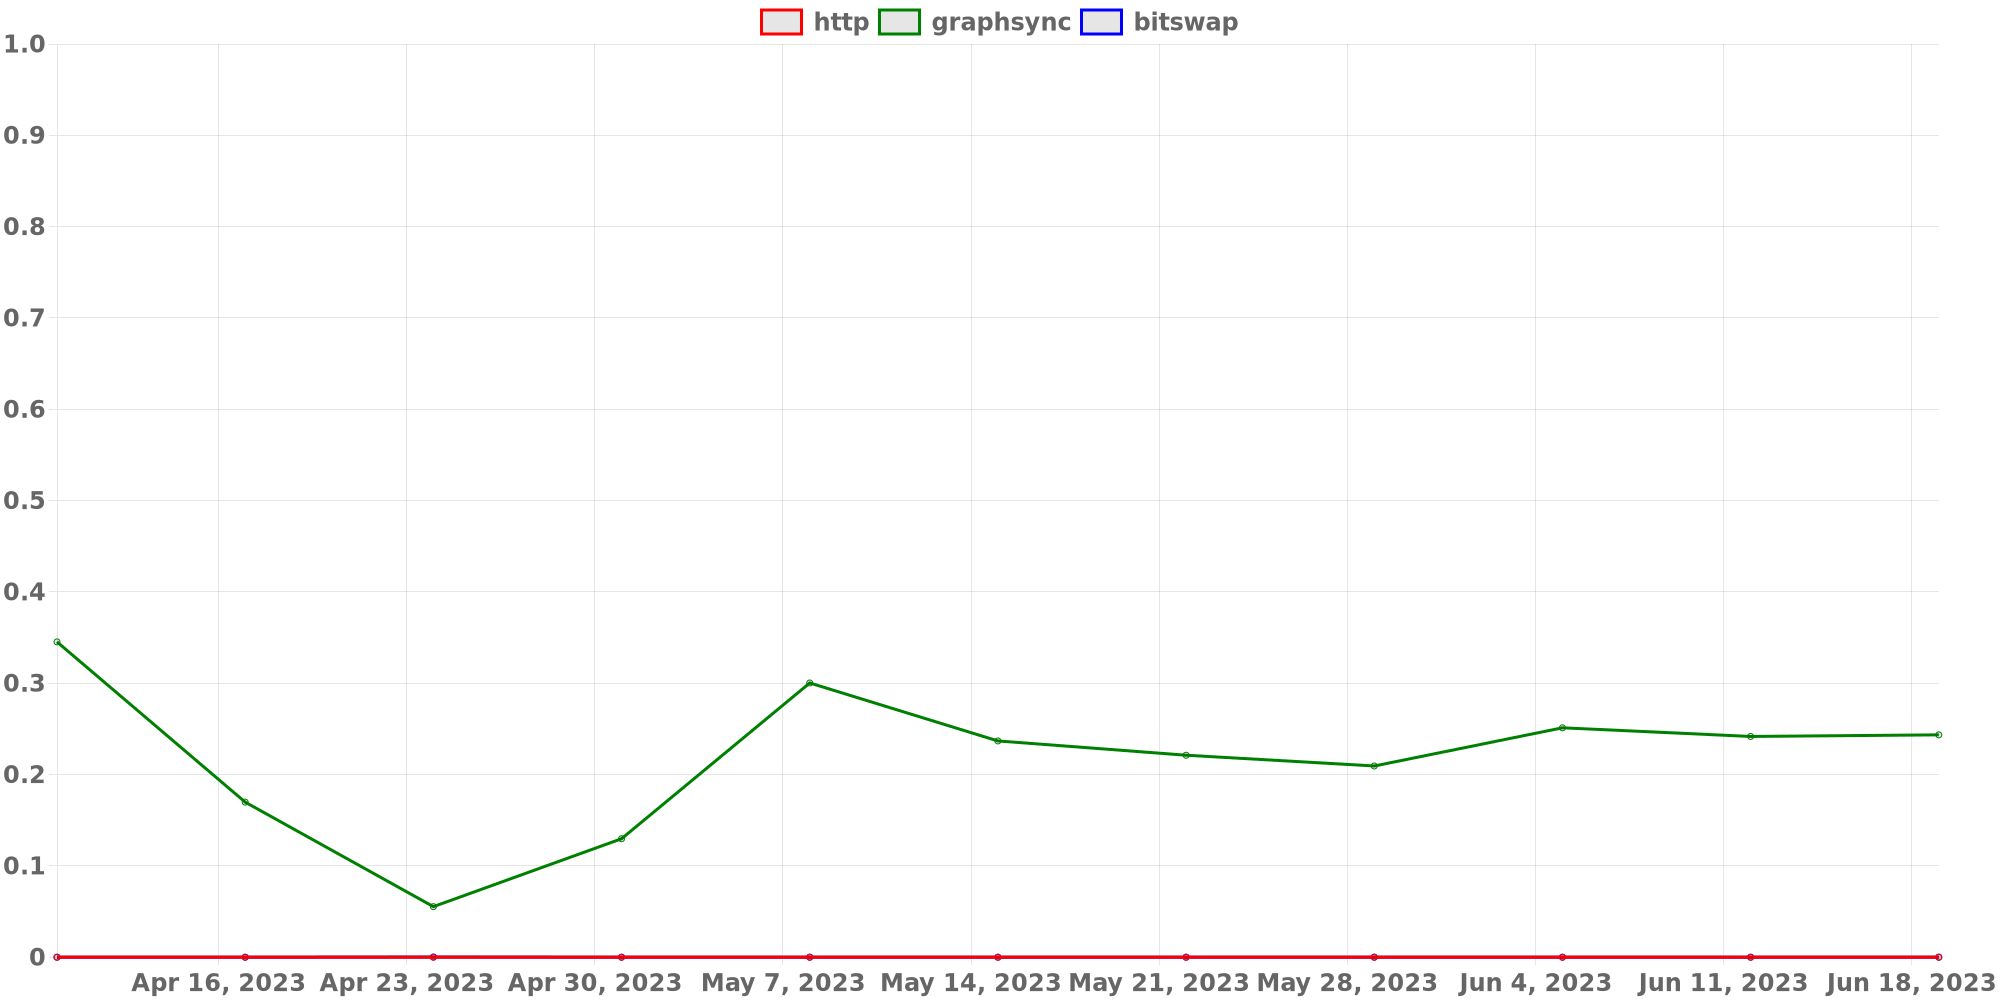
A time series like below shows how retrieval success rate of each retrieval protocol

Break down by Provider
| A table like below will show the success rate of retrieval for each provider of all time. | Provider | GraphSync Retrievals | GraphSync Success Ratio | HTTP Retrievals | HTTP Success Ratio | Bitswap Retrievals | Bitswap Success Ratio |
|---|---|---|---|---|---|---|---|
| f01989866 | 11298 | 0.00% | 11291 | 0.00% | 11291 | 0.00% | |
| f01969323 | 9031 | 0.00% | 9030 | 0.00% | 9031 | 0.00% | |
| f033462 | 11607 | 78.97% | 11610 | 0.00% | 11611 | 0.00% | |
| f01832393 | 199 | 28.64% | 199 | 0.00% | 199 | 1.01% |
Break down by error code
| A table like below will show how different types of errors are observed for each provider and retrieval protocol | Provider | Success | Cannot Connect to the Provider | Retrieval timeout | Piece not Found | Retrieval not free | General retrieval failure | Retrieval rejected | Deal state missing |
|---|---|---|---|---|---|---|---|---|---|
| f01989866 | 0 | 2096 | 1156 | 7994 | 0 | 52 | 0 | 0 | |
| f01907545 | 0 | 319 | 12 | 0 | 0 | 0 | 0 | 0 | |
| f0750779 | 1653 | 1928 | 6297 | 3 | 0 | 0 | 0 | 3 | |
| f0673990 | 0 | 6788 | 0 | 0 | 0 | 0 | 0 | 0 | |
| f01761579 | 61 | 2 | 7 | 0 | 0 | 0 | 0 | 0 |