elm-chart-builder
Note: the library is in active development and some parts of the API will change in the upcoming release.
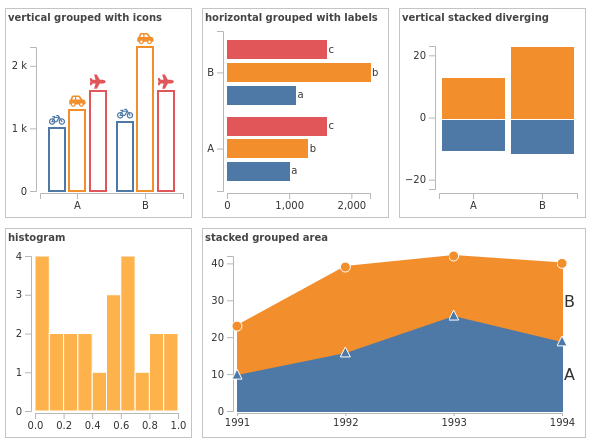
An opinionated and accessible charting library for elm based on gam pleman/elm-visualization and elm-community/typed-svg.
The aim of this package is to expose an easy and intuitive api for building a variety of accessible chart types.
It is an opinionated library, because every charting module represents a very specific charting choice. If your aim is to build some personalized charts not covered here, then you should probably try a more low level library such as gampleman/elm-visualization.
All chart modules are being developed with full accessibility in mind (work in progress).
Core concepts
To build a chart you need:
- Your data
- An accessor function that tells elm-chart-builder how to get x and y values from the data, and how to group them.
- A configuration (data structure) that tells elm-chart-builder how the chart should look
Build your configuration in a pipeline:
- Start with 'init', which takes all the mandatory parameters,
- pipe through functions that set options,
- and end with 'render' which takes your data and accessor and returns your chart as
Html msg.
Bar.init
    { margin =
        { top = 10
        , right = 10
        , bottom = 30
        , left = 30
        }
    , width = 500
    , height = 200
    }
    |> Bar.withStackedLayout Bar.noDirection
    |> Bar.render
        ( [ ("a", 10 ), ("b", 20 )]
        , Bar.Accessor (always Nothing)
            Tuple.first
            Tuple.second
        )
Built-in CSS classes
elm-chart-builder adds a number of css classes to the generated elements. These can be used to customize the charts with css.
Documentation
Find the documentation on Elm's package website.
Online presentation page
Development
Examples
You can test code changes with the existing examples. It expects elm to already be installed and accessible.
$ cd examples
$ elm reactor
and then open examples.
Unit tests:
$ npm install
$ npx elm-test
elm-analyse:
$ npm install
$ npx elm-analyse > elm-analyse.log
Screenshot tests:
It expects the elm reactor server to be already running on port 8000.
$ npm install
$ cd screenshot-tests

# Check if a page in the examples folder has changed unexpectedly after a code change:
$ node tests.js

# Then if any example page has changed:
# you can check the diff images in the diffs folder,
# and you can also check the current and prev images in the images folder.

# If the change was intentional, you can reset all images by running:
$ node tests.js --reset