GraphVis
说明:github版本不再更新,如要使用最新版本,请转到码云查看下载 码云Gitee。
一个较为完善的图可视化引擎,支持自定义的可视化效果,集成多种经典网络布局算法,社区发现算法,路径分析算法,方便使用人员或开发者快速构建自己的图可视化分析应用。
开发指南:GraphVis开发指南
Gitee:GitHub地址
项目核心价值
- 快速高效的可视化引擎,支持大量数据的交互式操作。
- 集成大量的经典布局算法,如:树形结构类,力导向布局类,圆形类,层级关系类、节点避免重叠等
- 支持经典社区划分算法,如:chineseWisper, lovin,newman等
- 完整的在线应用实例,完善的开发文档(持续更新中...)
活跃的交流群体,持续优化改进的可视化效果和交互,让GraphVis在未来一定会成为图数据可视化领域的一个活跃分子。
欢迎有兴趣的同学们参与进来,共同把GraphVis打造成为图数据可视化分析领域的流行组件,服务更多的开发者。
快速使用
界面原生方式引用
当前组件包支持两种引用方式:

页面标签直接引用
<script type="text/javascript" src="https://github.com/dubaopeng/GraphVis/raw/master/./visgraph-x.x.x.min.js"></script>

require异步加载引用 页面标签直接引用
requirejs(['visgraph','layoutFactory','clusterFactory'],function(VisGraph,layoutFactory,clusterFactory) {//do something});
GraphVis实现图数据的可视化只需以下三步即可,无需深入的基础知识也可快速使用:
1、后台服务按照格式组织数据,如:
var data = {
   nodes:[{id:'1',label:'刘备',type:'男',properties:{age:50}},
         {id:'2',label:'关羽',type:'男'},
         {id:'3',label:'张飞',type:'男'}],
   links:[{source:'1',target:'2',label:'二弟',properties:{other:'other prop'}},
         {source:'1',target:'3',label:'三弟'}]
};

2、界面添加图层包裹元素,如:
<div id="graph-panel" style="width:800px;height:600px;"></div>

3、初始化关系图
let visGraph = new VisGraph(document.getElementById('graph-panel'));
visgraph.drawData(data);//绘制图完成
支持自定义配置,实现个性化需求及交互
详细配置如下,可选择性配置需要的参数,不需要无需配置
let visGraph = new VisGraph(document.getElementById(visDomId),
    {
        node:{ //节点的默认配置
            label:{ //标签配置
                show:true, //是否显示
                color:'50,50,50',//字体颜色
                font:'12px 微软雅黑',//字体大小及类型
                wrapText:false, //节点包裹文字
                textPosition:'Middle_Center'//文字位置 Top_Center,Bottom_Center,Middle_Right
            },
            shape:'circle',//节点形状 circle,rect,square,ellipse,triangle,star,polygon,text
            color:'20,20,200',//节点颜色
            //image:'images/T1030001.svg',//节点图标(设置后节点显示为圆形图标)
            borderColor:'255,255,20',//边框颜色
            borderWidth:0,//边框宽度,
            lineDash:[3,2],//边框虚线间隔,borderWidth>0时生效
            showShadow:true,//显示选中阴影
            shadowColor:'0,255,0',//阴影颜色
            alpha:1,//节点透明度
            size:60, //节点默认大小
            width:80, //节点的长度(shape为rect生效)
            height:40,//节点的高度(shape为rect生效)
            onClick : function(event,node){ //节点点击事件回调
                // do something
                console.log('click node----['+node.id+':'+node.label+']');
            }
        },
        link:{ //连线的默认配置
            label:{ //连线标签
                show:false, //是否显示
                color:'20,20,20', //字体颜色
                font:'11px 微软雅黑'//字体大小及类型
            },
            lineType:'direct',//连线类型,direct,curver,vlink,hlink,bezier,vbezier,hbezier
            colorType:'defined',//连线颜色类型 source:继承source颜色,target:继承target颜色 both:用双边颜色,defined:自定义
            color:'180,180,180', //连线颜色
            alpha:1,  // 连线透明度
            lineWidth:5, //连线宽度
            lineDash:[0],//虚线间隔样式如:[5,8]
            showArrow:true,//显示箭头
            onClick :function(event,link){ //连线点击事件回调
                // do something
                console.log('click link---['+link.source.id+'-->'+link.target.id+']');
            }
        },
        highLightNeiber:true, //相邻节点高亮开关
        backGroundType:'png',//保存图片的类型,支持png、jpeg
        wheelZoom:0.8,//滚轮缩放开关,不使用时不设置[0,1]
        marginLeft:-40, //对右键菜单位置进行调校的参数
        rightMenu:{
            nodeMenu:NodeRightMenu,  //节点右键菜单配置
            linkMenu:LinkRightMenu   // 连线右键菜单配置
        }
    }
);
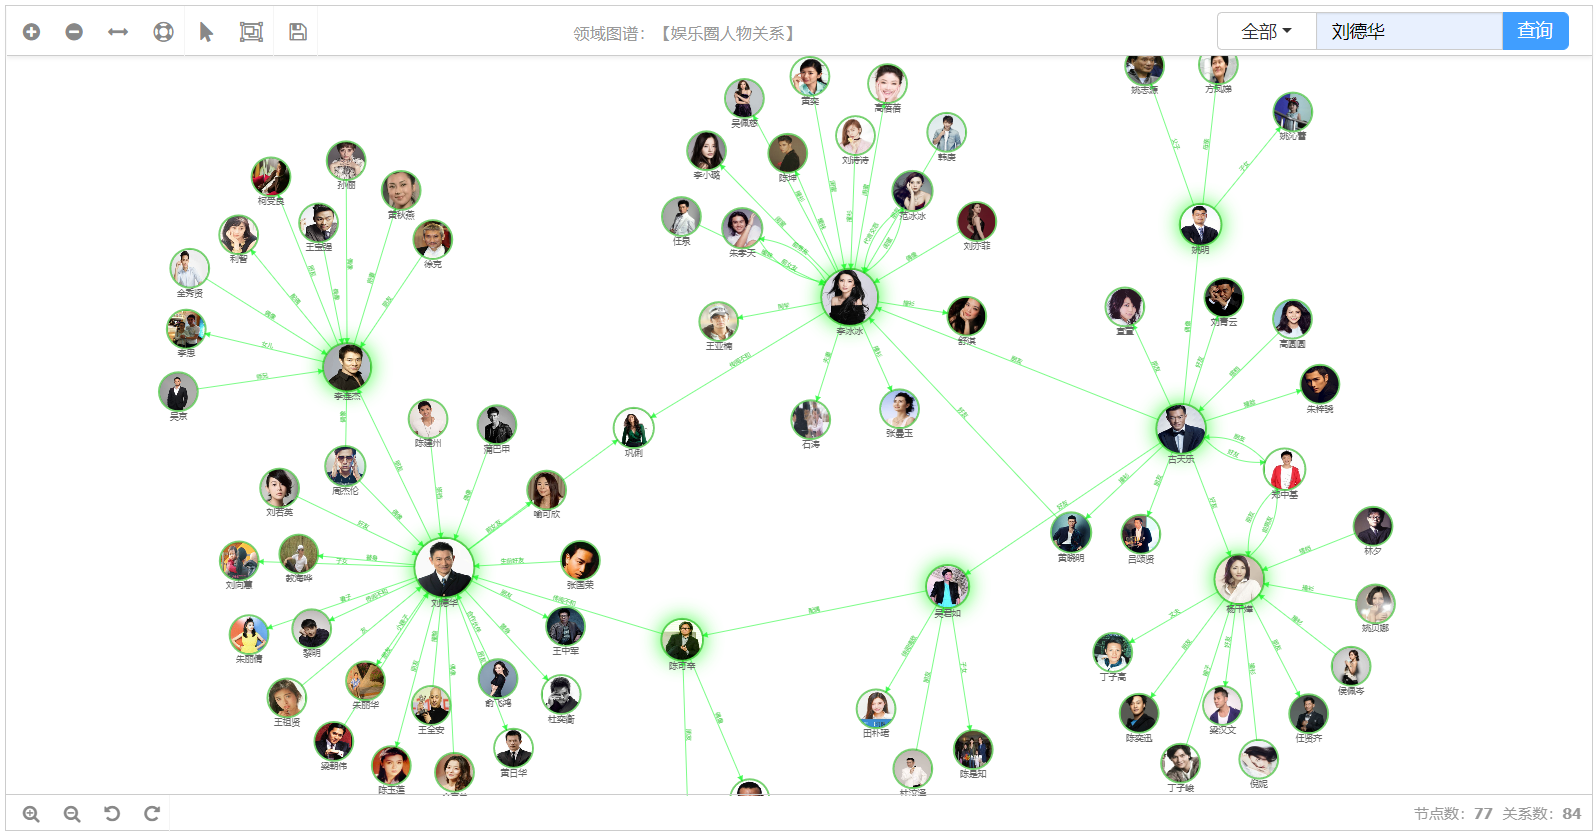
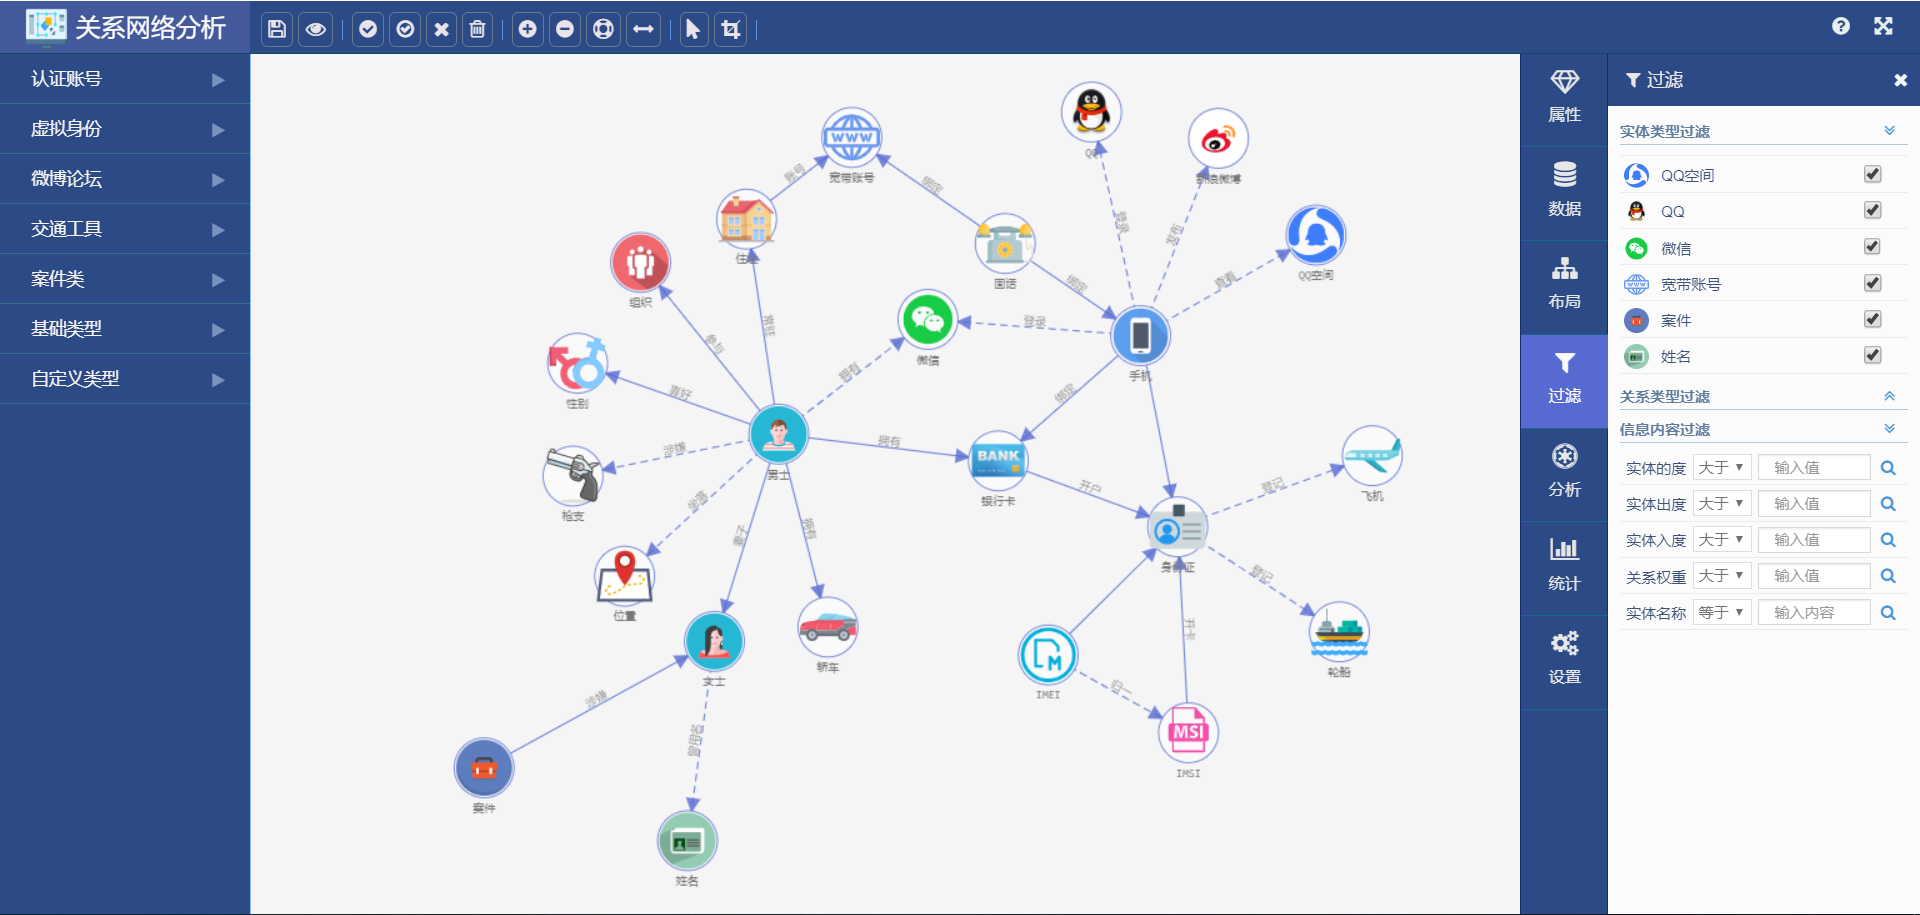
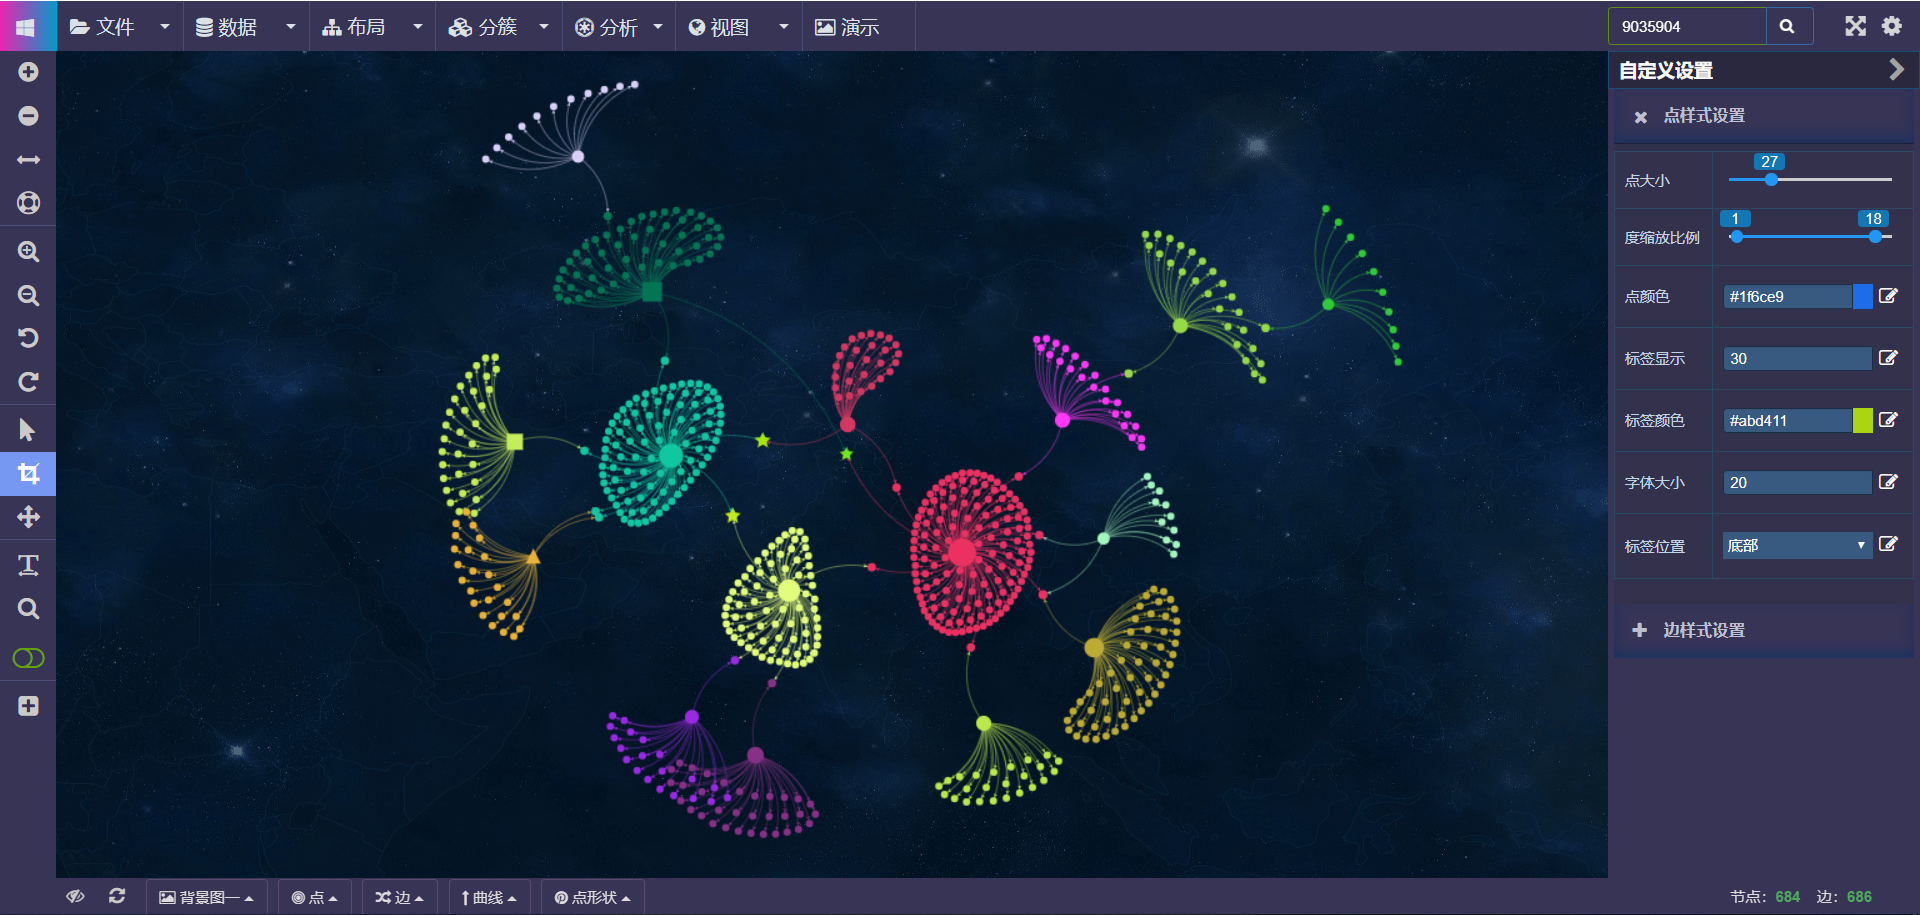
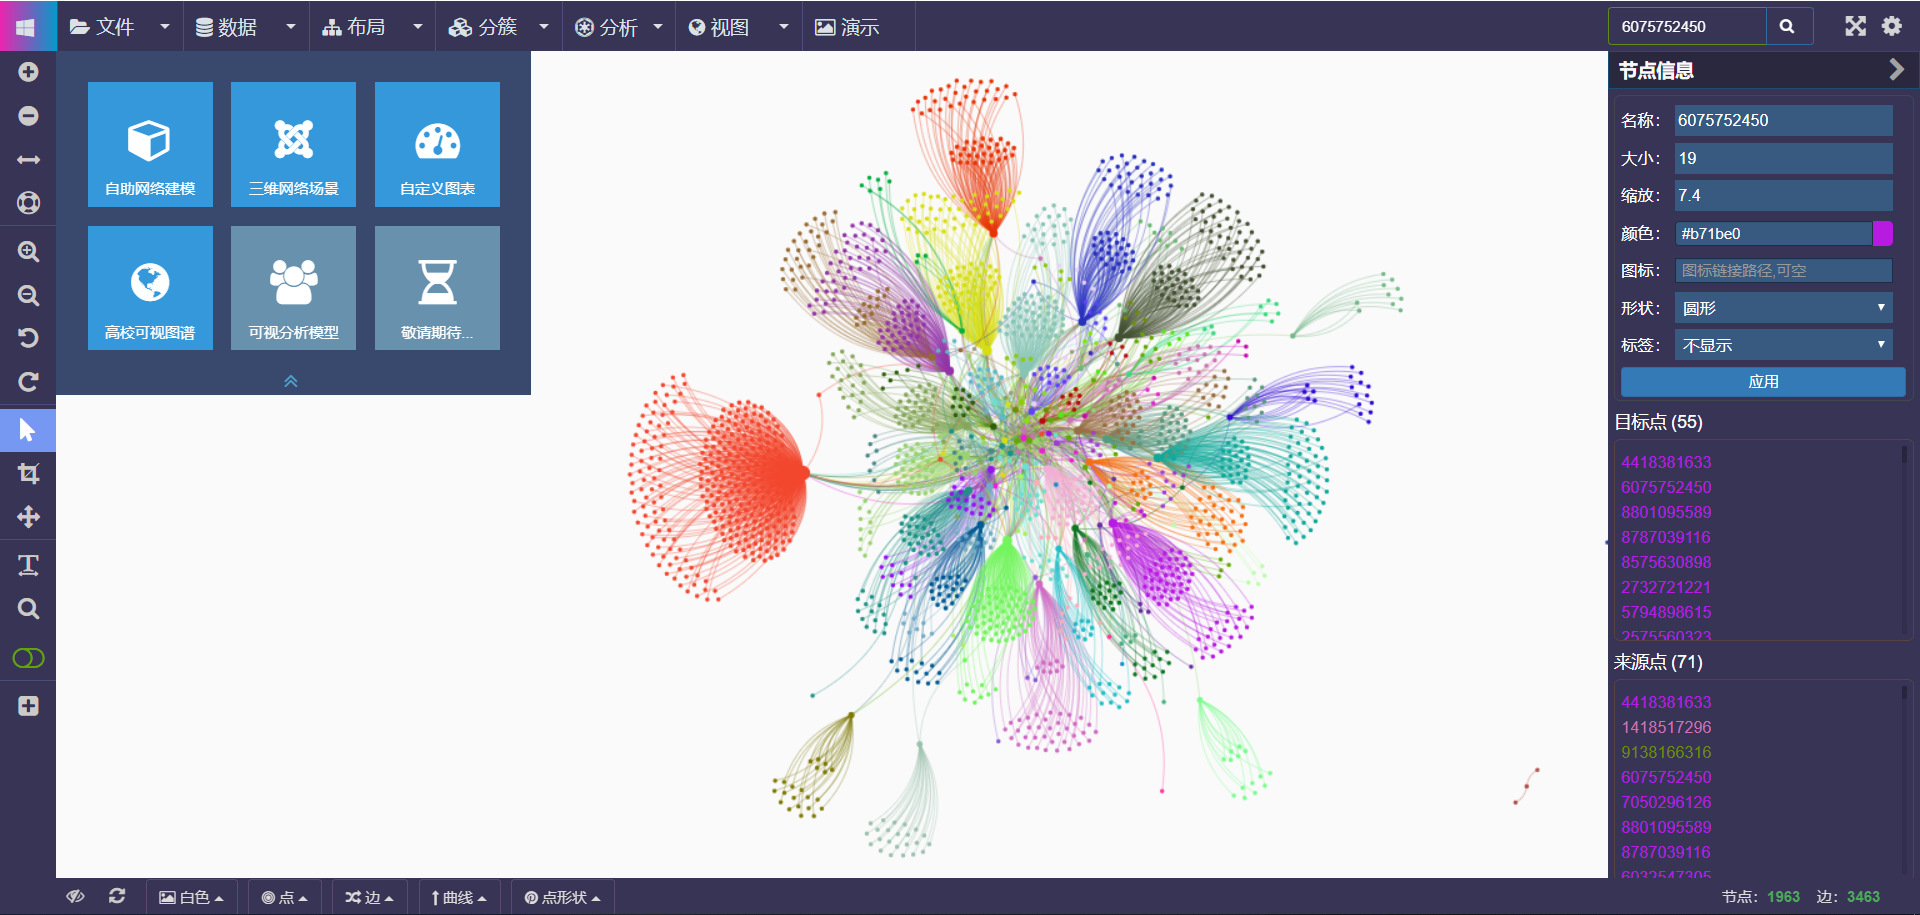
应用效果图
 |
 |
 |
 |
 |
GraphVis 交流讨论
 |
 |
联系作者
1、微信:dubaopeng123 2、QQ: 583037838