 cloudhan
commented
5 months ago
cloudhan
commented
5 months ago For more reference, seqlen 32768
  void vllm::paged_attention_v2_kernel<unsigned short, (int)128, (int)16, (int)128, (int)512>(float *, float *, T1 *, const T1 *, const T1 *, const T1 *, int, float, const int *, const int *, int, const float *, int, int, int) (32, 1, 64)x(128, 1, 1), Context 1, Stream 7, Device 0, CC 8.9
    Section: GPU Speed Of Light Throughput
    ----------------------- ------------- ------------
    Metric Name               Metric Unit Metric Value
    ----------------------- ------------- ------------
    DRAM Frequency          cycle/nsecond        10.24
    SM Frequency            cycle/nsecond         2.23
    Elapsed Cycles                  cycle      1196860
    Memory Throughput                   %        95.66
    DRAM Throughput                     %        95.66
    Duration                      usecond       535.52
...

  void vllm::paged_attention_v2_reduce_kernel<unsigned short, (int)128, (int)128, (int)512>(T1 *, const float *, const float *, const T1 *, const int *, int) (32, 1, 1)x(128, 1, 1), Context 1, Stream 7, Device 0, CC 8.9
    Section: GPU Speed Of Light Throughput
    ----------------------- ------------- ------------
    Metric Name               Metric Unit Metric Value
    ----------------------- ------------- ------------
    DRAM Frequency          cycle/nsecond        10.15
    SM Frequency            cycle/nsecond         2.21
    Elapsed Cycles                  cycle        12643
    Memory Throughput                   %        10.78
    DRAM Throughput                     %        10.78
    Duration                      usecond         5.73
yzh119
In the 2024-02-02 blog post, for example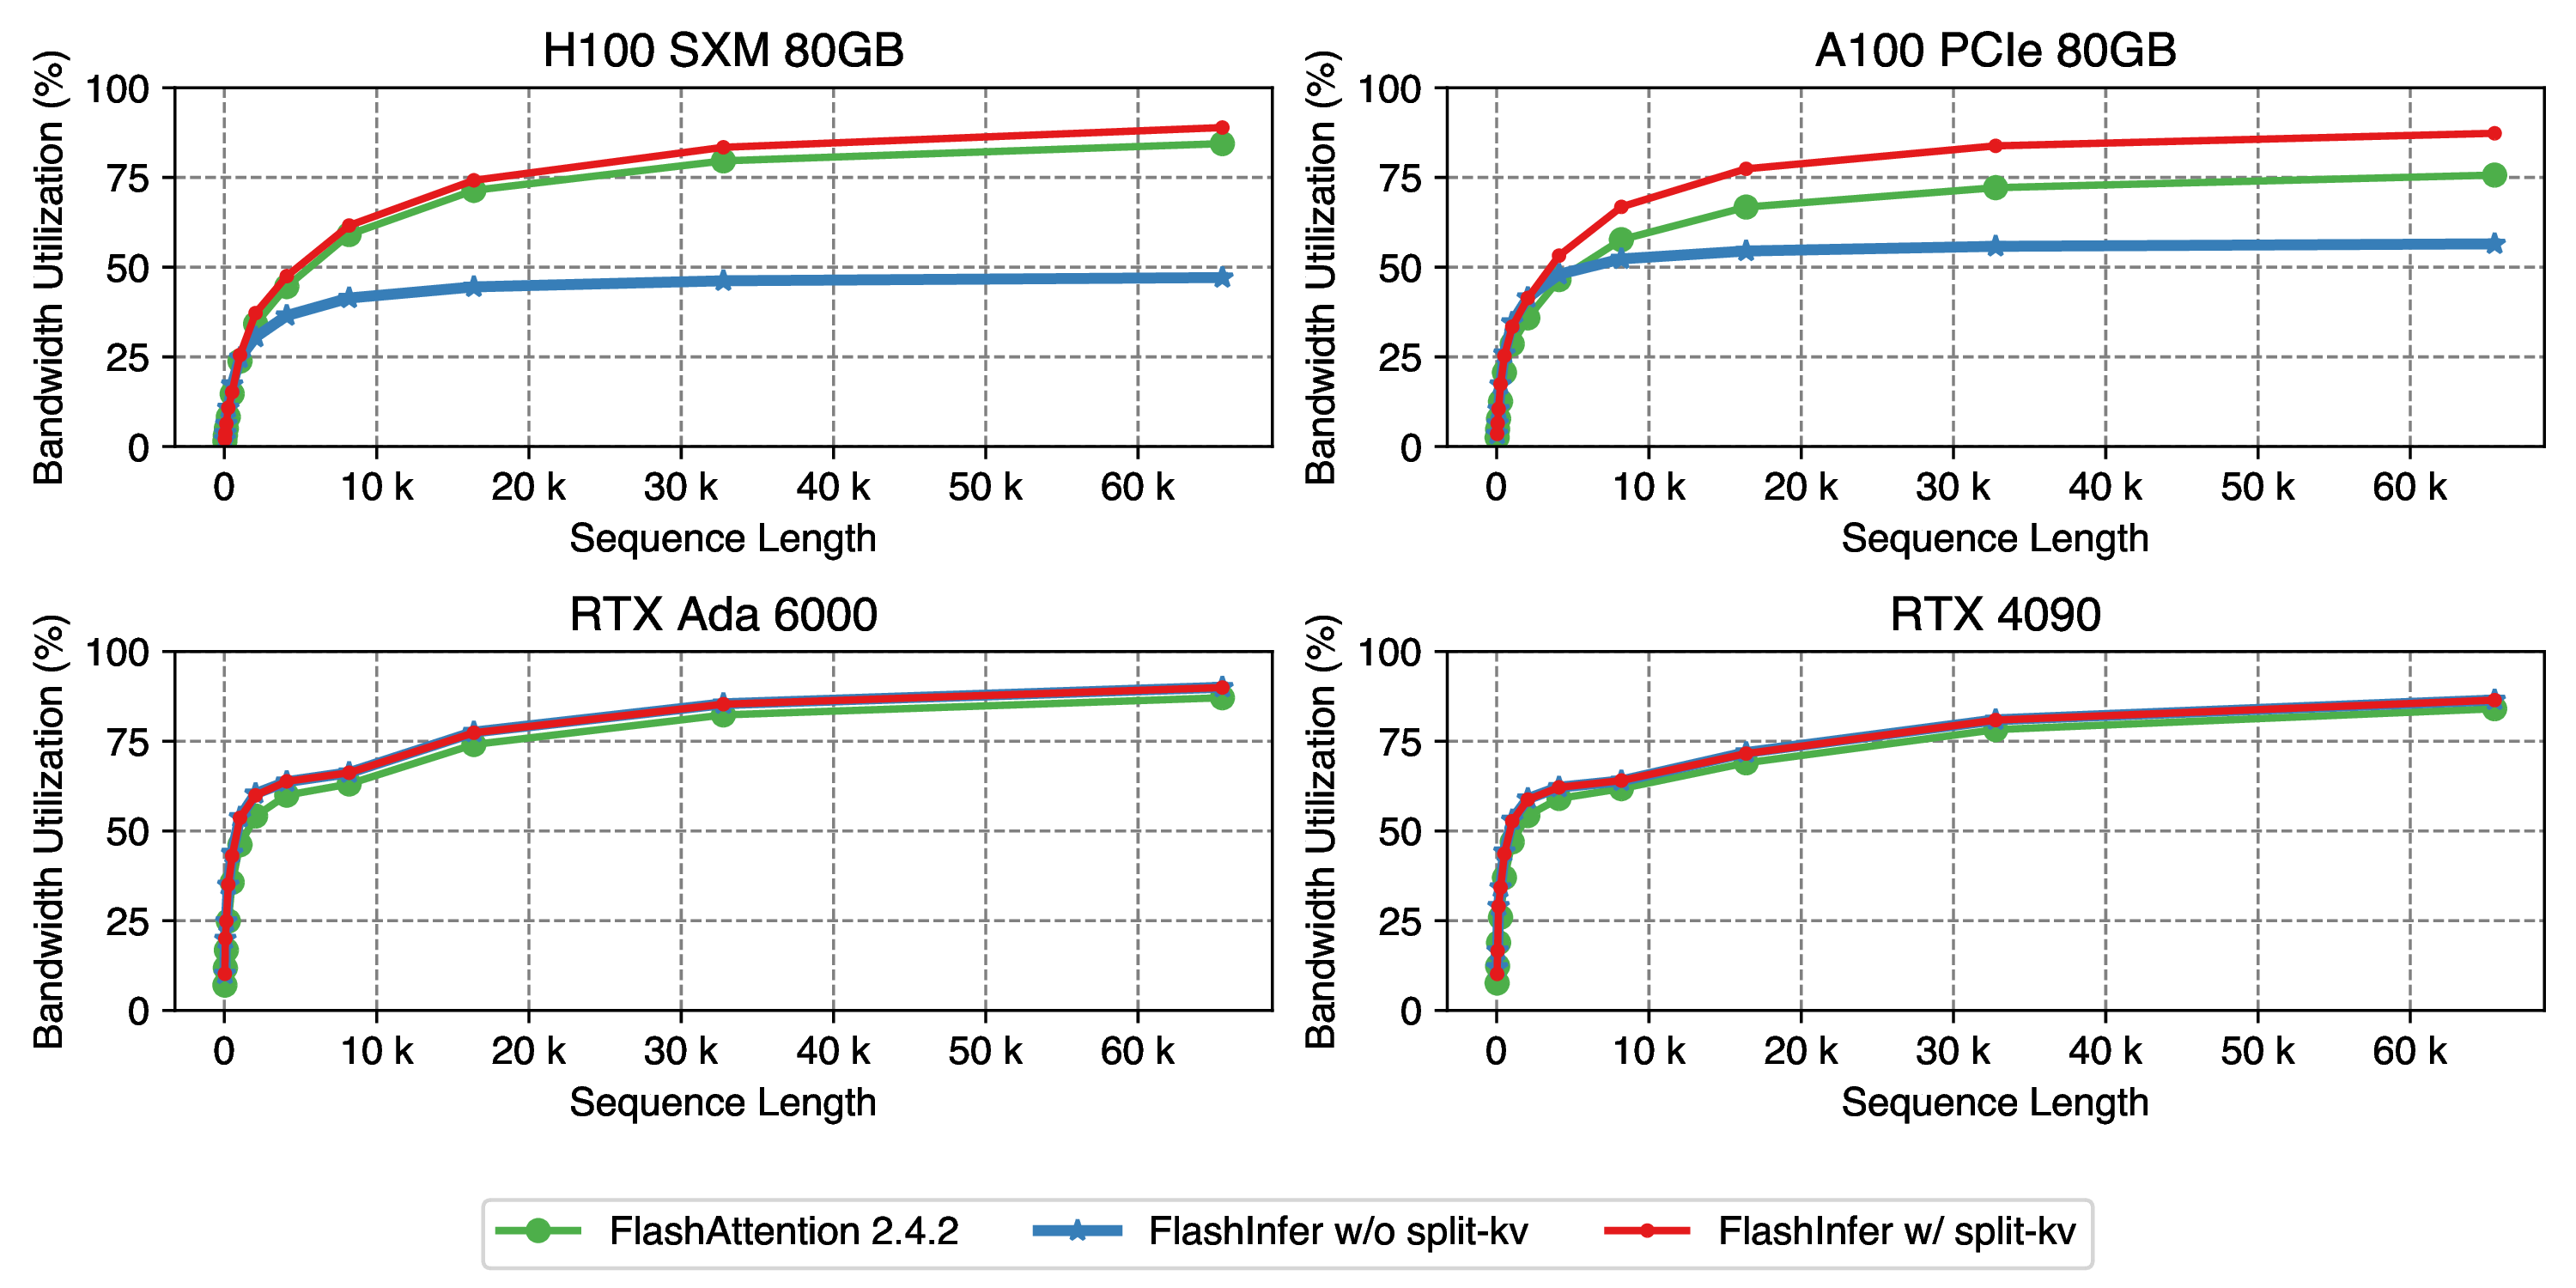
I tried to repro it simply with ncu data for numseq 1 and seqlen 16384 on 4090:
It is definitely as low as 70%-ish, could you please share more details about the measurement, or better the benchmark code. Are you measuring the timing with events?