Bayesian change detection
The Bayesian model-based change detection module implements a recursive algorithm for segmenting a sequence of real-valued input-output data. The segment boundaries are chosen under the assumption that, within each segment, the input-output data follow a multi-variate linear model. The parameters of the linear model (i.e. the coefficient matrix and the noise covariance matrix) are treated as random variables, thus resulting in a fully Bayesian model.
Sequence segmentation occurs online by recursively updating a set of segmentation hypotheses. Each hypothesis captures a particular belief about the current segment's length, given all the data so far. Every time new input-output data arrive, the hypotheses are updated to reflect this knowledge. The computational cost of each update step is kept constant via an approximation. The tradeoff between computational cost and approximation quality can be controlled with a tuning parameter.
Installation
This module can be installed using pip. To download and install this module from the command line, type the following commands in the console:
git clone git@github.com:gabrieag/bayesian-change-detection.git
cd bayesian-change-detection
sudo pip install .
To uninstall this module, type:
sudo pip uninstall change_detecExamples
For a quick demo, run examples.py with the Python interpreter. This script runs a set of examples that demonstrate the Bayesian change detection model on different datasets. The output is a set of plots, one for each example. All the plots look soomething like this:
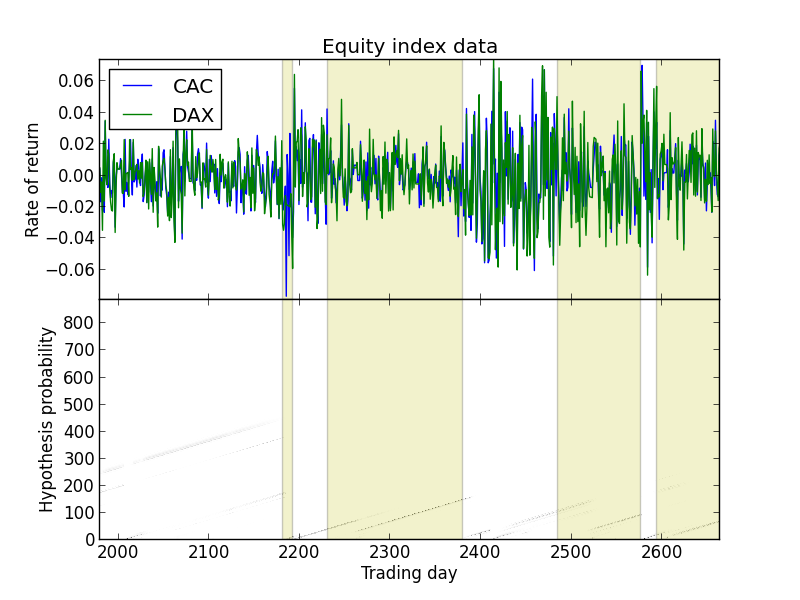
The top panel shows the sequence of output data, colored by the dimension. In this figure, the output data are return values computed from the daily closing values of the CAC (blue) and DAX (green) equity indices. The bottom panel shows the probability distribution over segment lengths, as a function of time. The maximum-likelihood segmentation of the entire sequence is shown in both the top and bottom panels as a sequence of alternating vertical spans.
In the bottom panel, the online inference results produced by the segmentation model are plotted in grey. For each time step, each length hypothesis is colored according to its probability, where white denotes 0% probability and black denotes 100% probability. The end result is a greyscale raster image, where pixel (i, j) denotes the probability that the current segment has length i, given all the data up to and including time step j. This distribution is inferred recursively, in O(1) time per time step.