Azure Data Explorer data source for Grafana
Azure Data Explorer is a log analytics cloud platform optimized for ad-hoc big data queries.
Installation
This plugin has the following minimum requirements:
- v4.0.0+: Grafana 8.0.0
- v3.0.0+: Grafana 7.1.0
- < v3.0.0 require Grafana 6.3.6.
For detailed instructions on how to install the plugin on Grafana Cloud or locally, please check out the Plugin installation docs.
Enforcing trusted Azure Data Explorer endpoints
For additional security, enforcing a list of trusted ADX endpoints against which the cluster URL will be verified is possible. This prevents a request from being redirected to a third-party endpoint.
This can be enabled by setting enforce_trusted_endpoints in your Grafana configuration under the [plugin.grafana-azure-data-explorer-datasource] section:
[plugin.grafana-azure-data-explorer-datasource]
enforce_trusted_endpoints = true
Configure the Azure Data Explorer data source
To configure ADX for using this data source:
- Create an Azure Active Directory (AAD) Application and AAD Service Principal.
- In the Azure Data Explorer WebExplorer, connect the AAD Application to an Azure Data Explorer database user.
- Use the AAD Application to configure the data source connection in Grafana.
- (Optional) To use the dropdown cluster select when creating queries, add reader access to the subscription(s) that contain the clusters.
Creating an Azure Active Directory Service Principle
For detailed instructions on how to set up a Microsoft Entra application and service principal that can access resources, please follow this guide from Microsoft: Create a Microsoft Entra application and service principal that can access resources
An alternative way to create an AAD application is with the Azure CLI. For more information on the Azure CLI command, refer to az ad sp create-for-rbac:
az ad sp create-for-rbac -n "http://url.to.your.grafana:3000"This should return the following:
{
  "appId": "XXXXXXXX-XXXX-XXXX-XXXX-XXXXXXXXXXXX",
  "displayName": "azure-cli-2018-09-20-13-42-58",
  "name": "http://url.to.your.grafana:3000",
  "password": "XXXXXXXX-XXXX-XXXX-XXXX-XXXXXXXXXXXX",
  "tenant": "XXXXXXXX-XXXX-XXXX-XXXX-XXXXXXXXXXXX"
}
Assign the Reader role to the Service Principal and remove the Contributor role:
az role assignment create --assignee <your appId> --role Reader
az role assignment delete --assignee <your appId> --role Contributor
Connecting AAD with an Azure Data Explorer User
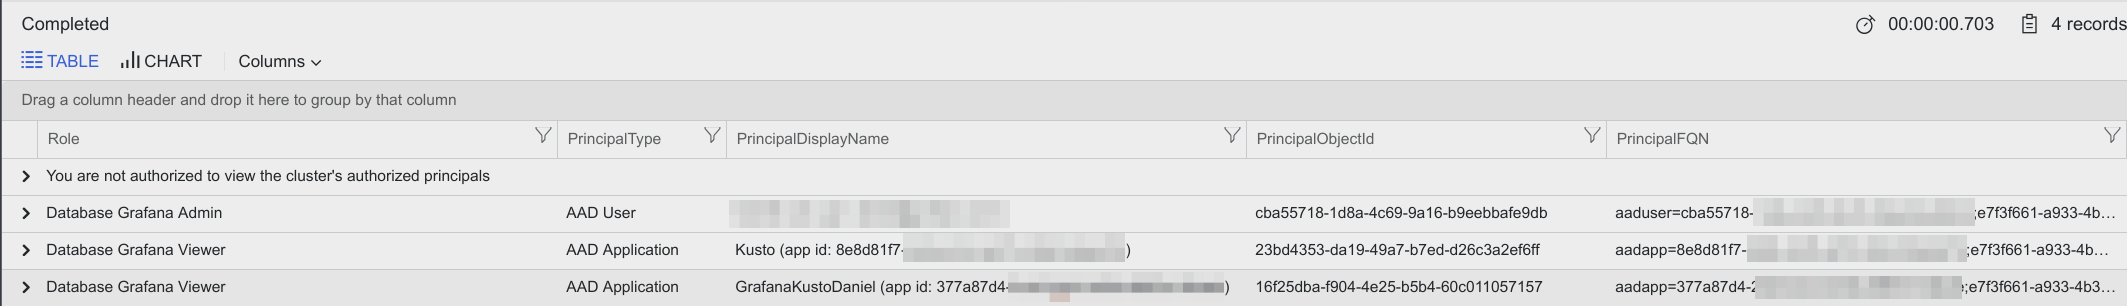
The AAD application that you created above needs to be given viewer access to your Azure Data Explorer database (in this example the database is called Grafana). This is done using the dot command add. The argument for .add contains both the client and tenant id separated by a semicolon:
.add database Grafana viewers ('aadapp=<your client id>;<your tenantid>')A real example with a client/app id and tenant id:
.add database Grafana viewers ('aadapp=377a87d4-2cd3-44c0-b35a-8887a12fxxx;e7f3f661-a933-4b3f-8176-51c4f982exxx')If the command succeeds, you should get a result like this:
Configuring Grafana
Add a data source by filling in the following fields:
| Field | Description |
|---|---|
| Directory (tenant) ID | (Azure Active Directory -> Properties -> Directory ID) |
| Application (client) ID | (Azure Active Directory -> App Registrations -> Choose your app -> Application ID) |
| Client Secret | ( Azure Active Directory -> App Registrations -> Choose your app -> Keys) |
| Default Cluster | (Options) If no cluster is selected when making a query, the default cluster will be used. |
Additional settings
Additional settings are optional settings that can be configured for more control over your data source. Additional settings can be accessed by expanding the additional settings section at the bottom of the data source configuration page.
| Field | Description |
|---|---|
| Query timeout | This value controls the client query timeout. |
| Use dynamic caching | By enabling this feature Grafana will dynamically apply cache settings on a per-query basis, and the default cache max age will be ignored. The bin size for time series queries will be used to widen the time range and as cache max age. |
| Cache max age | By default, the cache is disabled. If you want to enable the query caching please specify a max timespan for the cache to live. |
| Data consistency | Query consistency controls how queries and updates are synchronized. Defaults to Strong. For more information, refer to Query consistency |
| Default editor mode | This setting dictates which mode the editor will open in. Defaults to Visual. |
| Default database | The default database will be used if no database is selected. A default cluster is required to select a default database. To load default database options, you must save the data source with a valid Azure connection. |
| Use managed schema | If enabled, tables, functions, and materialized views are mapped to user-friendly names. |
| Send username header to host | With this feature enabled, Grafana will pass the logged in user's username in the x-ms-user-id header and in the x-ms-client-request-id header when sending requests to ADX. It can be useful when tracking needs to be done in ADX. |
Configuring On-Behalf-Of authentication (Beta)
{{%/ admonition type="caution" /%}} This feature is in Beta and subject to breaking changes {{%/ /admonition /%}}
For information about setting up and using the OBO flow, refer to on-behalf-of documentation
Query the data source
Before querying the data source, select the query header options cluster, database, and format. You can create queries using the query builder, KQL, or OpenAI.
Query header
Cluster
Select a cluster to query. If a default cluster was set in the data source settings, then it will auto-populate the cluster select. If there are no clusters to choose from, refer to Configure the Azure Data Explorer data source
Database
Select a database to query. If a default database was set in the data source settings, it will auto-populate the database selection.
Format as
Queries can be formatted as Table, Time Series, Trace, or ADX time series data using the Format as dropdown select.
-
Table queries are mainly used in the Table panel as a list of columns and rows. This example query returns rows with the six specified columns:
AzureActivity | where $__timeFilter() | project TimeGenerated, ResourceGroup, Category, OperationName, ActivityStatus, Caller | order by TimeGenerated desc -
Time series queries are for the Graph Panel (and other panels like the Single Stat panel). The query must contain exactly one datetime column, one or more number valued columns, and optionally one more more string columns as labels. Here is an example query that returns the aggregated count grouped by the Category column and grouped by hour:
AzureActivity
| where $__timeFilter(TimeGenerated)
| summarize count() by Category, bin(TimeGenerated, 1h)
| order by TimeGenerated asc
The number of valued columns is considered metrics, and the optional string columns are treated as tags. A time series is returned for each value column + a unique set of string column values. Each series has name of valueColumnName {stringColumnName=columnValue, ... }.
For example, the following query will produce series like
AvgDirectDeaths {EventType=Excessive Heat, State=DELAWARE}``EventCount {EventType=Excessive Heat, State=NEW JERSEY}:StormEvents | where $__timeFilter(StartTime) | summarize EventCount=count(), AvgDirectDeaths=avg(DeathsDirect) by EventType, State, bin(StartTime, $__timeInterval) | order by StartTime asc -
Trace format option can be used to display appropriately formatted data using the built-in trace visualization. To use this visualization, data must be presented following the schema that is defined here. The schema contains the
logs,serviceTags, andtagsfields which are expected to be JSON objects. These fields will be converted to the expected data structure provided the schema in ADX matches the below:logs- an array of JSON objects with atimestampfield that has a numeric value, and afieldsfield that is key-value object.serviceTagsandtags- a typical key-value JSON object without nested objects.
The values for keys are expected to be primitive types rather than complex types. The correct value to pass when empty is either
null, an empty JSON object forserviceTagsandtags, or an empty array forlogs. -
ADX time series are for queries that use the Kusto
make-seriesoperator. The query must have exactly one datetime column namedTimestampand at least one value column. There may also optionally be string columns that will be labels.Example:
let T = range Timestamp from $__timeFrom to ($__timeTo + -30m) step 1m
| extend   Person = dynamic(["Torkel", "Daniel", "Kyle", "Sofia"])
| extend   Place  = dynamic(["EU",     "EU",     "US",   "EU"])
| mvexpand Person, Place
| extend   HatInventory = rand(5)
| project  Timestamp, tostring(Person), tostring(Place), HatInventory;

T | make-series AvgHatInventory=avg(HatInventory) default=double(null) on Timestamp from $__timeFrom to $__timeTo step 1m by Person, Place
| extend series_decompose_forecast(AvgHatInventory, 30) | project-away *residual, *baseline, *seasonal
Query Builder
| Field | Description |
|---|---|
| Table | Select a table. |
| Columns | Select a subset of columns for faster results. Time series requires both time and number values; other columns are rendered as dimensions. For more information about dimensions, refer to Time series dimensions. |
| Filters | (Optional) Add filters for the selected columns. Values for filters will be restricted to the column's data type. |
| Aggregate | (Optional) Add aggregations for the selected columns. Select an aggregation type from the dropdown and select a column to aggregate on. |
| Group by | (Optional) Add group bys for the selected columns. For time group bys select a time range bucket. |
| Timeshift (deprecated use grafana time shift in Query Options) | (Optional) Shift the time ranges generated from Grafana macros by a predetermined duration. |
Columns of the dynamic type are supported within the query builder. This encompasses arrays, JSON objects, and nested objects within arrays. A limitation is only the first 50,000 rows are queried for data, so only properties contained within the first 50,000 rows will be listed as options in the builder selectors. Additional values can be manually written in the different selectors if they don't appear by default. Also, due to the fact that these queries make use of mv-expand, they may become resource intensive.
Refer to the documentation below for further details on handling dynamic columns appropriately via the KQL editor.
Kusto Data Types - Documentation on data types supported by Kusto.
Dynamic Data Type - Detailed documentation on the dynamic data type.
Query with Kusto Query Language (KQL)
Queries are written in Kusto Query Language; for more information, refer to Kusto Query Language (KQL) overview.
OpenAI query generator
{{%/ admonition type="note" /%}} You must enable the LLM plugin to use this feature. {{%/ /admonition /%}}
The LLM plugin can be installed at LLM app. After installing the plugin, enable it.
To use the query generator, type in a statement or question about the data you want to see and click Generate query. Review and edit the generated KQL query in the Generated query field. Once satisfied with the query, run the query by clicking Run query.
Time Macros
To make writing queries easier, there are some Grafana macros that can be used in the where clause of a query:
$__timeFilter()- Expands toTimeGenerated ≥ datetime(2018-06-05T18:09:58.907Z) and TimeGenerated ≤ datetime(2018-06-05T20:09:58.907Z)where the from and to datetimes are taken from the Grafana time picker.$__timeFilter(datetimeColumn)- Expands todatetimeColumn ≥ datetime(2018-06-05T18:09:58.907Z) and datetimeColumn ≤ datetime(2018-06-05T20:09:58.907Z)where the from and to datetimes are taken from the Grafana time picker.$__timeFrom- Expands todatetime(2018-06-05T18:09:58.907Z), the start time of the query.$__timeTo- expands todatetime(2018-06-05T20:09:58.907Z), the end time of the query.$__timeInterval- expands to5000ms, Grafana's recommended bin size based on the timespan of the query, in milliseconds. In alerting this will always be1000ms, it is recommended not to use this macro in alert queries.
Templating Macros
$__escapeMulti($myVar)- is to be used with multi-value template variables that contains illegal characters. If \$myVar has the value'\\grafana-vm\Network(eth0)\Total','\\hello!', it expands to:@'\\grafana-vm\Network(eth0)\Total', @'\\hello!'. If using single value variables there no need for this macro, simply escape the variable inline instead -@'\$myVar'-
$__contains(colName, $myVar)- is to be used with multi-value template variables. If \$myVar has the value'value1','value2', it expands to:colName in ('value1','value2').If using the
Alloption, then check theInclude All Optioncheckbox and in theCustom all valuefield type in the following value:all. If \$myVar has valueallthen the macro will instead expand to1 == 1. For template variables with a lot of options, this will increase the query performance by not building a large where..in clause.
Templating with Variables
Instead of hard-coding things like server, application, and sensor name in your metric queries, you can use variables in their place. Variables are shown as dropdown select boxes at the top of the dashboard. These dropdowns make it easy to change the data being displayed in your dashboard.
Create the variable in the dashboard settings. Usually, you will need to write a query in KQL to get a list of values for the dropdown. However, having a list of hard-coded values is also possible.
-
Fill in a name for your variable. The
Namefield is the name of the variable. There is also aLabelfield for the friendly name. -
In the Query Options section, choose the
Azure Data Explorerdatasource in theData sourcedropdown. -
Write the query in the
Queryfield. Useprojectto specify one column - the result should be a list of string values.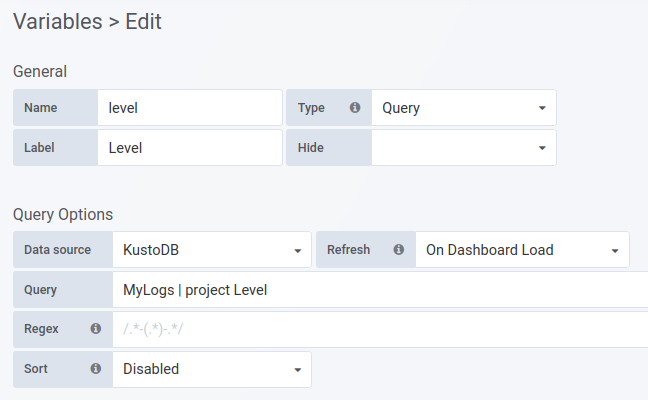
-
At the bottom, you will see a preview of the values returned from the query:
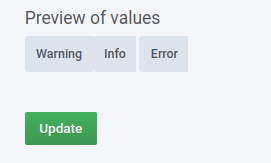
-
Use the variable in your query (in this case the variable is named
level):MyLogs | where Level == '$level'For variables where multiple values are allowed then use the
inoperator instead:MyLogs | where Level in ($level)
Read more about templating and variables in the Grafana documentation.
Databases Variable
There is no way to fetch a list of databases with the Kusto query language. When creating a template variable as described in the Templating with variables section, use the following function in the Query field to return a list of databases:
databases()This variable can be used in the databases dropdown. This gives you the ability to switch databases without editing the query in the panel.
To use the variable, type the name of your variable into the dropdown. For example, if the name of your variable is database, then type $database.
Annotations
An annotation is an event that is overlaid on top of graphs. The query can have up to three columns per row, the datetime column is mandatory. Annotation rendering is expensive so it is important to limit the number of rows returned.
- column with the datetime type.
- column with alias: Text or text for the annotation text
- column with alias: Tags or tags for annotation tags. This should return a comma separated string of tags e.g. 'tag1,tag2'
Example query:
MyLogs
| where $__timeFilter(Timestamp)
| project Timestamp, Text=Message , Tags="tag1,tag2"
Learn more
- Add Annotations.
- Configure and use Templates and variables.
- Add Transformations.
- Set up alerting; refer to Alerts overview.