Sataako.fi
Introduction
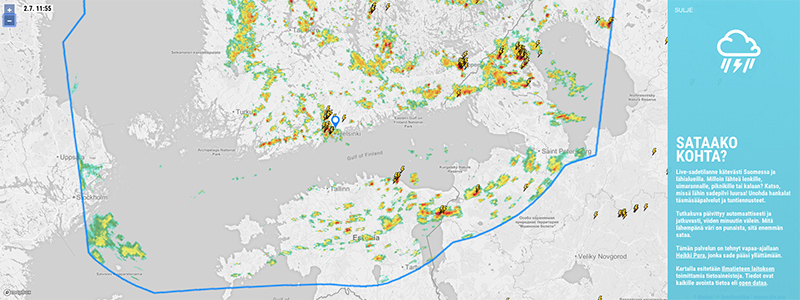
I wanted to create a mobile-friendly weather service for Finland which has the simplest possible user interface (in Finnish).
Sataako.fi fetches weather radar images from Finnish Meteorological Institute's Open Data APIs and shows them as a Openlayers image layer after some post-processing. The map tiles are served from OpenStreetMap via a long-caching proxy. The movement of rain clouds is shown as a short animation covering the last hour.

Embedding
If you want to embed the map into another website such as a radiator or a home automation system, you can fix the coordinates and zoom level and automatically hide the side panel using query parameters.
Available query parameters:
x&y: Set the coordinate the map centers on. The values should be in EPSG:3857 format.zoom: Set the default zoom levelcollapsed: Set the collapsed status of the side panel. Set astrueto hide the side bar by default.
Example: https://www.sataako.fi?x=2776307.5078&y=8438349.32742&zoom=7&collapsed=true
Runtime environment
The node.js application runs in Hetzner Cloud with a single vCpu instance. It's deployed there with ansible.
It's responsible for
- maintaing an up-to-date list of radar frames available from FMI
- delivering those frames as post-processed PNG or WEBP images (depending on the browser)
To be able to serve a decent amount of concurrent users without exceeding the FMI API request rate, the following steps are done:
- requests to FMI API go through a task queue which limits concurrency
- radar frame list is cached internally for one minute before a re-fetch from FMI
- radar frame images are cached 1) locally for about one hour and 2) by an AWS Cloudfront distribution sitting in front of the Heroku app (at d2ot8aujc2hu2d.cloudfront.net) for 24 hours
Radar frame post-processing
FMI provides a WMS compliant HTTP API for fetching a composite radar image covering all of Finland. To be able to use those images on top of the Mapbox map the following steps are taken:
- request a PNG image in EPSG:3067 projection which is native for FMI's radar images
- decode PNG into raw 32bit pixel data
- change a solid gray background (0xf7f7f7) to fully transparent
- use a mask-image to change a solid orange area outside the radars' range to fully transparent
- use an overlay-image to draw the edge of the radars' range
- encode image as PNG and WEBP maintaining transparency
OpenLayers will then reproject those images on the fly to EPSG:3857 projection aka WGS84 Web Mercator which is used by the OpenStreetMap tiles.
Contributing
Pull requests are welcome. Kindly check that your code passes ESLint checks by running npm test first.
Contributors
- Lauri Kangassalo (lakka) - Lightning implementation