WubbabooMark
Debugger Anti-Detection Benchmark

WubbabooMark aimed to detect traces of usage of software debuggers or special software designed to hide debuggers presence from debugee by tampering various aspects of program environment.
Typical set of debuggers nowadays is actually limited to a few most popular solutions like Ghidra/IDA/OllyDbg/x32+x64dbg/WinDbg and so on. There is a special class of software designed to "hide" debugger from being detected by debugee. Debugger detection usually used by another software class - software protectors (e.g. Themida/VMProtect/Obsidium/WinLicense). Sometimes software that counteracts these detections referred as "anti-anti-debug" or whatsoever. Personally I found all of this "anti-anti" kind of annoying because we can continue and it will be "anti-anti-anti-..." with all sense lost somewhere in the middle.
What this "anti-anti" class of software actually does is creating a landscape of additional detection vectors, while some of most notorious pieces compromise operation system components integrity and security in the sake of being able to work. And all of them, absolutely all of them brings multiple bugs due to inability correctly replicate original behavior of hooked/emulated functions. Sounds scary? Not much that scary as most of this software users (they call themselves "reversers/crackers") know what they're doing and doing that on purpose... right? Carelessly implemented targeted antidetection methods against known and well reverse-engineered commercial protectors creating a bunch of new artifacts. WubbabooMark using publicly known, actualized and enchanced methods to list those artifacts.
The continuous VMProtect drama generates a lot of fun so I just can't stay away of it. Since VMProtect recently goes "open-source" under DGAF license I had an opportunity to look closer on its "anti-" stuff. What VMProtect has under the hood clearly demonstrates authors following mainstream "scene" with little own creativity in some aspects due to limits as commercial product and software support requirements. Direct syscalls, heavens gate? What year is it now? However, reinventing this stuff even in 2018 seems have doomed to dead some of this so called "anti-anti" software.
Anyway, we have some debuggers, some "tampering tools/plugins" etc, lets see how good they are!
System Requirements
x64 Windows 10/11 and above.
Anything below Windows 10 is unsupported. Well, because those OSes discontinued by Microsoft and mainstream industry. What a surprise! What a surprise! Forget stone age systems and move on.
Windows 11 preview/developer builds WARNING: since this program rely on completely undocumented stuff there can be problems with most recent versions that program doesn't know about resulting in false-positive detection or program crashes. Use on your own risk.
Implemented tests
(a short list, almost each actually does more but for readme technical details are too much)
- Common set of tests
- Presence of Windows policy allowing custom kernel signers
- Detection of Windows kernel debugger by NtSystemDebugControl behavior.
- Check for unnecessary process privileges enablement
- Process Environment Block (PEB) Loader entries verification
- Must be all authenticode signed, have valid names
- Loaded Kernel Modules verification
- Must be all authenticode signed, doesn't include anything from built-in blacklist
- Detect lazy data tampering
- Blacklisted Driver Device Objects
- Lookup devices object names in Object Manager namespace and compare them with blacklist
- Windows Version Information
- Detect l33t and other BS changes
- Cross-compare version information from several system modules that are in KnownDlls
- Cross-compare version information from PEB with data obtained through WMI
- Validate system call (syscall) layout for PEB version
- Validate system build number acceptable range
- Running Processes
- Check if process name is in blacklist
- Cross-compare Native API query result with WMI data to detect hidden from client processes
- Detect lazy Native API data tampering
- Check client against console host information
- Application Compatibility (AppCompat) parent information
- Client Threads
- Verify that client threads instruction pointers belong to visible modules
- NTDLL mapping validation
- Map NTDLL using several methods and cross-compare results
- Examine program stack
- Find a code that doesn't belong to any loaded module
- Validate Working Set (WS) information
- Query WS and walk each page looking for suspicious flags
- Use WS watch and look for page fault data
- Perform Handle Tracing
- Enable handle tracing for client, perform bait call and examine results
- Check NtClose misbehavior
- Validate NTDLL syscalls
- Obtain system call data by various methods, use it and cross-compare results
- Validate WIN32U syscalls
- Obtain system call data and compare results
- Detect Debugger presence
- Process Debug Port with indirect syscall
- Process Debug Handle with indirect syscall
- Process Debug Flags with indirect syscall
- DR registers
- User Shared Data information
- Examine system handle dump
- Find debug objects and debug handles
- Detect lazy Native API data tampering
- Detect client handles with suspicious rights
- Enumerate NtUser objects
- Walk UserHandleTable to find objects which owners are invisible to client API calls
- Enumerate NtGdi objects
- Walk GdiSharedHandleTable to find objects which owners are invisible to client API calls
- Enumerate Boot Configuration Data (That one requires client elevation)
- Search for option enablements: TestMode, WinPEMode, DisableIntegrityChecks, KernelDebugger
- Scan process memory regions
- Search for regions with memory executable flags that doesn't belong to any loaded module
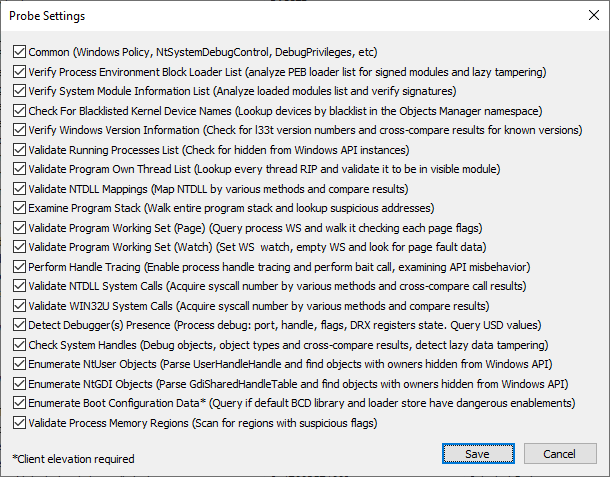
Program can be configured which tests you want to try. Go to menu "Probes -> Settings", apply changes and start scan. Note settings are saved to registry and read uppon program load.

Output Examples
-
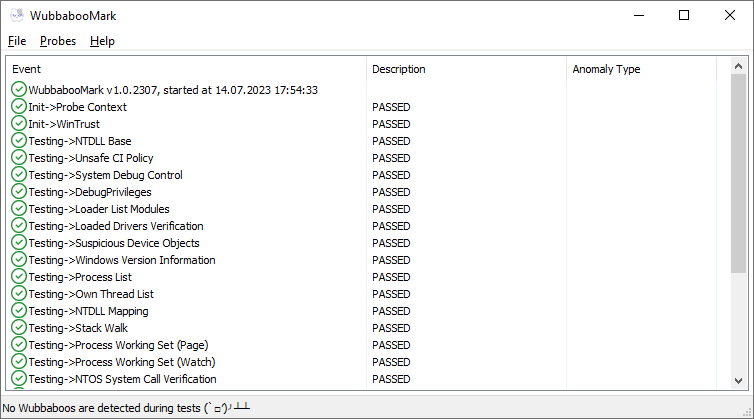
Clean scan

-
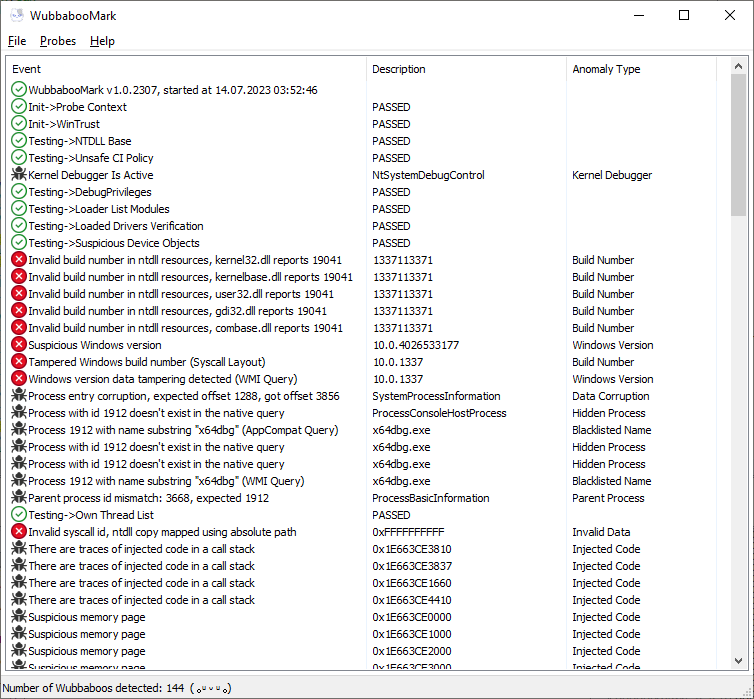
Wubbaboos found scan

How To Run Test And Don't Ask Questions Next
- Download or Compile from source "Skilla.exe"
- If you want to compile yourself: Use Microsoft Visual Studio 2019 and above with recent Windows SDK installed. Compile configuration is "Release", not "Debug".
- If you want to download precompiled binary it is in Bin folder of this repository.
- Load your debugger, setup your tampering plugins, load "Skilla.exe".
- Run the program in debugger and watch output. If something crashed including your debugger - it is your own fault (maybe~).
- Look for results. Normally there should be nothing detected, literally ZERO wubbaboos in list.
- If you want to repeat test - there is no need to restart "Skilla.exe" or repeat (2)(3) - go to menu and use "File -> Scan".
Do you found something that looks like a false-positive or a bug? Feel free to report in issues section! You can save generated report using "Probes -> Save As ..." menu. File will be saved in comma separated values (CSV) format.
False positives
Antimalware/anticheat software may cause false positives due to the way these software class works. Make sure you understand what you do. This is not AV/EDR benchmark nor testing tool.
Driver Bugs
While encountering random BSODs from the best and funniest "super hide" software I was about to make a fuzzer test just because every driver I compiled contained improper handling of syscalls it intercepts. However since authors of these software doesn't care and usage of all these drivers limited to small group of masochists this idea was dropped at early stage. Well what can I say - never use anything from that super hiding stuff on a live machine or you risk to lose your data due to sudden bugcheck.
Virtual Machine Detection
Not an aim of this tool and will never be added. This tool will work fine with VM.
Links
Here I would like to put some useful links, enjoy.
Debuggers first!
- x64dbg (https://github.com/x64dbg/x64dbg) - x64 debugger with UI inspired by OllyDbg. Despite being overflown with annoying graphics, questionable features and tons of bugs it is currently one of the best of what we have.
- HexRays IDA (https://hex-rays.com/ida-pro/) - cost a lot, can a lot, everybody have it for free, "F5" is a industry standard in ISV reverse-engineering departments.
- Ghidra SRE from NSA (https://github.com/NationalSecurityAgency/ghidra) - not much to say about it, except it is freeware open-source competitor of the above product.
- WinDbg (https://learn.microsoft.com/en-us/windows-hardware/drivers/debugger/debugger-download-tools) Microsoft user/kernel debugger with support built into operation system. A bit of hardcore for a newcomers but the most powerful as R0 debugger.
- Immunity Debugger (https://www.immunityinc.com/products/debugger/) - Requires Python and doesn't support x64, trash for historical purposes.
- There exist some funny clone of ollydbg+x64dbg with number of different names (cpudbg64, asmdbg32, asmdbg64 - author can't decide) however author attitude demonstrate typical chaos in mind and development not to mention fishing schemes used on project domain.
- HyperDbg (https://github.com/HyperDbg/HyperDbg) - hypervisor assisted kernel/user mode debugger.
- CheatEngine (https://github.com/cheat-engine/cheat-engine) - you can use it for debugging too, be aware that MSFT hates it, contains driver that is wormhole by design.
Debugger Anti-Detection
- ScyllaHide (https://github.com/x64dbg/ScyllaHide) - an "industry standard" in "anti-anti" software class.
- HyperHide (https://github.com/Air14/HyperHide) - a failed attempt to do something like ScyllaHide but hypervisor assisted.
- StrongOD (https://github.com/shellbombs/StrongOD) - SSDT intercepting driver built with Windows XP era in mind, never use it on a production machine, avoid at all cost.
- TitanHide (https://github.com/mrexodia/TitanHide) - another driver that intercept SSDT services, never use it on a production machine.
- QuickUnpack (https://github.com/fobricia/QuickUnpack) - contains a driver that is able to emulate rdtsc/cpuid instructions using SVM/VMX, never use it on a production machine.
- AntiDebuggerFuxker (https://github.com/AyinSama/Anti-AntiDebuggerDriver) - "InfinityHook" style driver aimed to bypass VMProtect detections, never use it on a production machine and better never use it at all :P
- VirtualDbgHide (https://github.com/Nukem9/VirtualDbgHide) - utilize LSTAR hook, a typical broken "anti-" driver, never use it on a production machine, avoid at all cost.
- ColdHide_V2 (https://github.com/Rat431/ColdHide_V2) - a basic and failed ScyllaHide clone.
- DBGHider (https://github.com/hi-T0day/DBGHider) - IDA plugin that does some trivial things.
- MineDebugHider (https://github.com/zhouzu/MineDebugHider) - C# based trivial API interceptor with invalid anti-detection logic in author mind.
- Themidie (https://github.com/VenTaz/Themidie) - Themida specific hooks based on MHook lib.
- Kernel-Anit-Anit-Debug-Plugins (https://github.com/DragonQuestHero/Kernel-Anit-Anit-Debug-Plugins) - some of them contain driver that do kernel Dbg* functions hooking. Avoid at all cost.
- xdbg (https://github.com/brock7/xdbg) - plugin for x64dbg and CE based on MSFT Detours lib.
Debugger Detection
- al-khaser (https://github.com/LordNoteworthy/al-khaser) - contains basic set of debugger/analysis detection methods.
- AntiDebugger (https://github.com/liltoba/AntiDebugger) - various trash in C#.
- AntiDebugging (https://github.com/revsic/AntiDebugging) - small collection of basic things.
- Anti-Debugging (https://github.com/ThomasThelen/Anti-Debugging) - another collection following P.Ferrie articles.
- Anti-DebugNET (https://github.com/Mecanik/Anti-DebugNET) - basics implemented on C#.
- antidebug (https://github.com/waleedassar/antidebug) - collections of methods from author blogposts.
- AntiDBG (https://github.com/HackOvert/AntiDBG) - collection of recycled known ideas.
- Anti-Debug-Collection (https://github.com/MrakDev/Anti-Debug-Collection) - name says it all.
- aadp (https://github.com/crackinglandia/aadp) - collection of mistakes.
- cpp-anti-debug (https://github.com/BaumFX/cpp-anti-debug) - basics implemented on C++.
- debugoff (https://github.com/0xor0ne/debugoff) - a rare Linux anti-analysis methods collection. Warning - cancerous Rust.
- makin (https://github.com/secrary/makin) - basics mostly following P.Ferrie articles.
- Lycosidae (fork)(https://github.com/fengjixuchui/Lycosidae) - it's soo bad, so it is even good. Original repo seems destroyed by ashamed author.
- khaleesi (fork)(https://github.com/fengjixuchui/khaleesi) - al-khaser with injected code from the Lycosidae and something called "XAntiDebug". Original repo again seems unavailable.
- VMProtect open-source edition, won't give any links to avoid possible DMCA or whatever, you can find it on github under different names.
- Unabomber (https://github.com/Ahora57/Unabomber) - collection of methods that are creatively abusing misbehavior and bugs of anti-detection software.
- XAntiDebug (https://github.com/strivexjun/XAntiDebug) - few ideas from VMProtect "improved" by author.
Here I should put some links to what is now reinvented wheels about debuggers detection that you can easily find in the world wide web. It is mostly time-machine to where Windows XP was all new and shine.
- Collection of ancient stuff by Checkpoint (https://anti-debug.checkpoint.com/) Unsure where they copied some of these, probably from al-khaser (https://github.com/LordNoteworthy/al-khaser), or vice-versa.
- Peter Ferrie, Anti-Debugging Reference (http://pferrie.epizy.com/papers/antidebug.pdf?i=1) A must put, because literally everyone when you look at references have links to it, so I'm bit ashamed that I've never fully read it, however it must be something good, isn't it?
- Peter Ferrie, Anti-unpacker tricks (https://pferrie.tripod.com/papers/unpackers.pdf) I believe this one is where the above had roots in.
- Peter Ferrie, Anti-unpacker tricks VB series (https://www.virusbulletin.com/virusbulletin/2008/12/anti-unpacker-tricks-part-one) All parts of it I think have more details than above.
- An Anti-Reverse Engineering Guide By Josh Jackson (https://forum.tuts4you.com/files/file/1218-anti-reverse-engineering-guide/) Very ancient just like all the above.
- Enough of this museum.
- Anti Debugging Protection Techniques with Examples (https://www.apriorit.com/dev-blog/367-anti-reverse-engineering-protection-techniques-to-use-before-releasing-software) A more recent combination of known stuff.
Project Name
Wubbaboo is a mischievous spirit from Cognosphere videogame Honkai Star Rail. It likes to hide in unexpected places and does a lot of pranks just like the software class we are testing.
No wubbaboos were harmed during tests!
Authors
- (c) 2023 WubbabooMark Project
License
MIT