Spotfire Sankey Diagram
Spotfire mods visualization for Sankey diagram resp. Alluvial diagrams in Spotfire.
Visualize relationships between two or more categories or change of categories over time.
Sankey diagrams are visualizations used to show a flow from one set of values to another. Sankeys are best used when you want to show a many-to-many mapping between two or more categories (e.g. product categories, vendors and distribution channel) or multiple paths through a set of stages resp. change of categories over time (e.g. shift of votes over the last elections).
In the category X axis you select the different layers, while the continuous Y axis is used for the size of the connections between the layers.
Using R package for Alluvial as reference for layout and color. Started using D3 resp. Google Charts for Sankey, but then switched to plain SVG implementation due to constraints regarding coloring and sorting.
Example electoral swing analysis in US presidential elections
Lets analyze as an example electoral swing in last three US presidential elections and visualize how votes of people respetive states changed.
The Sankey diagram below shows the number of electoral votes per respective states over three years for the different candidates. And other than a simple bar chart, the Sankey diagram also shows the link between the year for a state, thus showing for example that some states from 2012 Obama changed to 2016 Trump and then to 2020 Biden.

The data used for this visualization comes from Hardvard Dataverse containing constituency (state-level) returns for elections to the US presidency. See below for the required data preparation.
Because the Sankey diagram also supports marking, you can create a detailed table visualisation then listing the actual state names and electoral votes to give you more details.

The data set for the Sankey diagram required one row per state and columns for the different elections. See here examples/US Elections 2012 2016 2020.csv
To create the Sankey diagram im Spotfire
- Import the data into Spotfire
- Add an Sankey diagram and add
Electoral Votesto the X axis - Add
Candidate 2012,Candidate 2016andCandidate 2020ro the Y axis - Add
Candidate 2020orParty 2020to colors and adjust the colors to typical colors of the partys
To create the required data structure with one line per entity and categories as columns from the original data source from Hardvard Dataverse several steps have to be done in Spotfire. These steps are not related to the Sankey diagram itself. They are listed here for reference how data was transformed in Spotfire to bring the data in the right structure for the Sankey.
- Download the data as CSV from Hardvard Dataverse
- Import the data into Spotfire
- From the data panel
- Filter rows for
[year]>=2012 - Create a new calculated column to identify why candidate got the most votes per state with
maxcandidatevotes using Max([candidatevotes]) Over ([year],[state])=[candidatevotes] - Filter rows for
[maxcandidatevotes]=True
- Filter rows for
- From the data panel, then pivot the data with one row per state and create columns for candidate and party_simplified per year
The result of your data preparation should look similar to what you can also download from here examples/US Elections 2012 2016 2020.csv
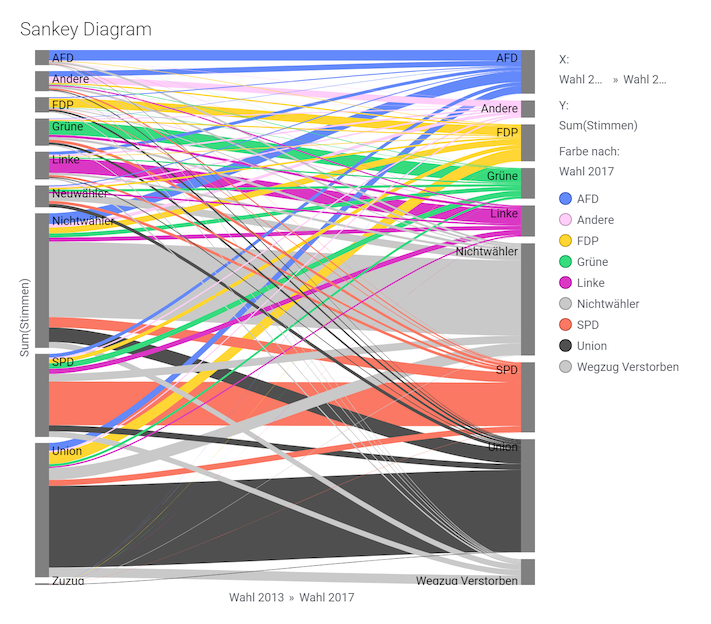
Example Wählerwanderung DEU federal elections
Another example would be to use dataset about federal elections in Germany here examples/DEU Bundestagswahl Waehlerwanderung 2013 2017.csv which contains data from tv news channel Tagesschau and is already in the right shape.
The data contains how many people voted in 2013 for one party and in 2017 for the same or another party. For example 11m people voted in 2013 for Union and also in 2017, 5,9m peopled voted in 2013 for SPD and also in 2017, while 800k people voted in 2013 for Union and changed to SPD in 2017, and 820k people changed from Union to SPD.
- Download the dataset from the examples folder
- Load the dataset to TIBCO Spotfire
- Add a Sankey diagram and add
Stimmenresp.Sum(Stimmen)to X axis - Add
Bundestagswahl 2013andBundestagswahl 2017to the Y axis - Put
Bundestagswahl 2017to colors - Adjust the colors to the typical colors of the partys
Open Topics
- Better layout of labels for category values https://github.com/hski-github/spotfire-sankey-diagram/issues/3
- Currently the order of values is done alphabetically, as an alternative option could be sorted by highest value, but also custom order should be supported https://ideas.tibco.com/ideas/TS-I-8062 resp. https://github.com/hski-github/spotfire-sankey-diagram/issues/21
- When hovering over bar segments, then the shown value is not formatted in the same way as defined for the continuous axis, but plain JavaScript value rendering. Here a new feature is required in the Spotfire mods framework. https://ideas.tibco.com/ideas/TS-I-8116
References
- https://cran.r-project.org/web/packages/alluvial/vignettes/alluvial.html
- http://www.datasmith.org/2020/05/02/alluvial-plots-vs-sankey-diagrams/
- https://stackoverflow.com/questions/4545254/sankey-diagram-in-javascript
- https://developers.google.com/chart/interactive/docs/gallery/sankey
- https://github.com/d3/d3-sankey
- https://observablehq.com/collection/@d3/d3-sankey
- https://www.tagesschau.de/inland/btw17/waehlerwanderung-115.html
- https://github.com/microsoft/powerbi-visuals-sankey
How to get started with development
All source code for the mod example can be found in the src folder.
These instructions assume that you have Node.js (which includes npm) installed.
- Open a terminal at the location of this example.
- Run
npm install. This will install necessary tools. Run this command only the first time you are building the mod and skip this step for any subsequent builds. - Run
npm run server. This will start a development server. - Start editing, for example
src/main.js. - In Spotfire, follow the steps of creating a new mod and connecting to the development server.