Overview
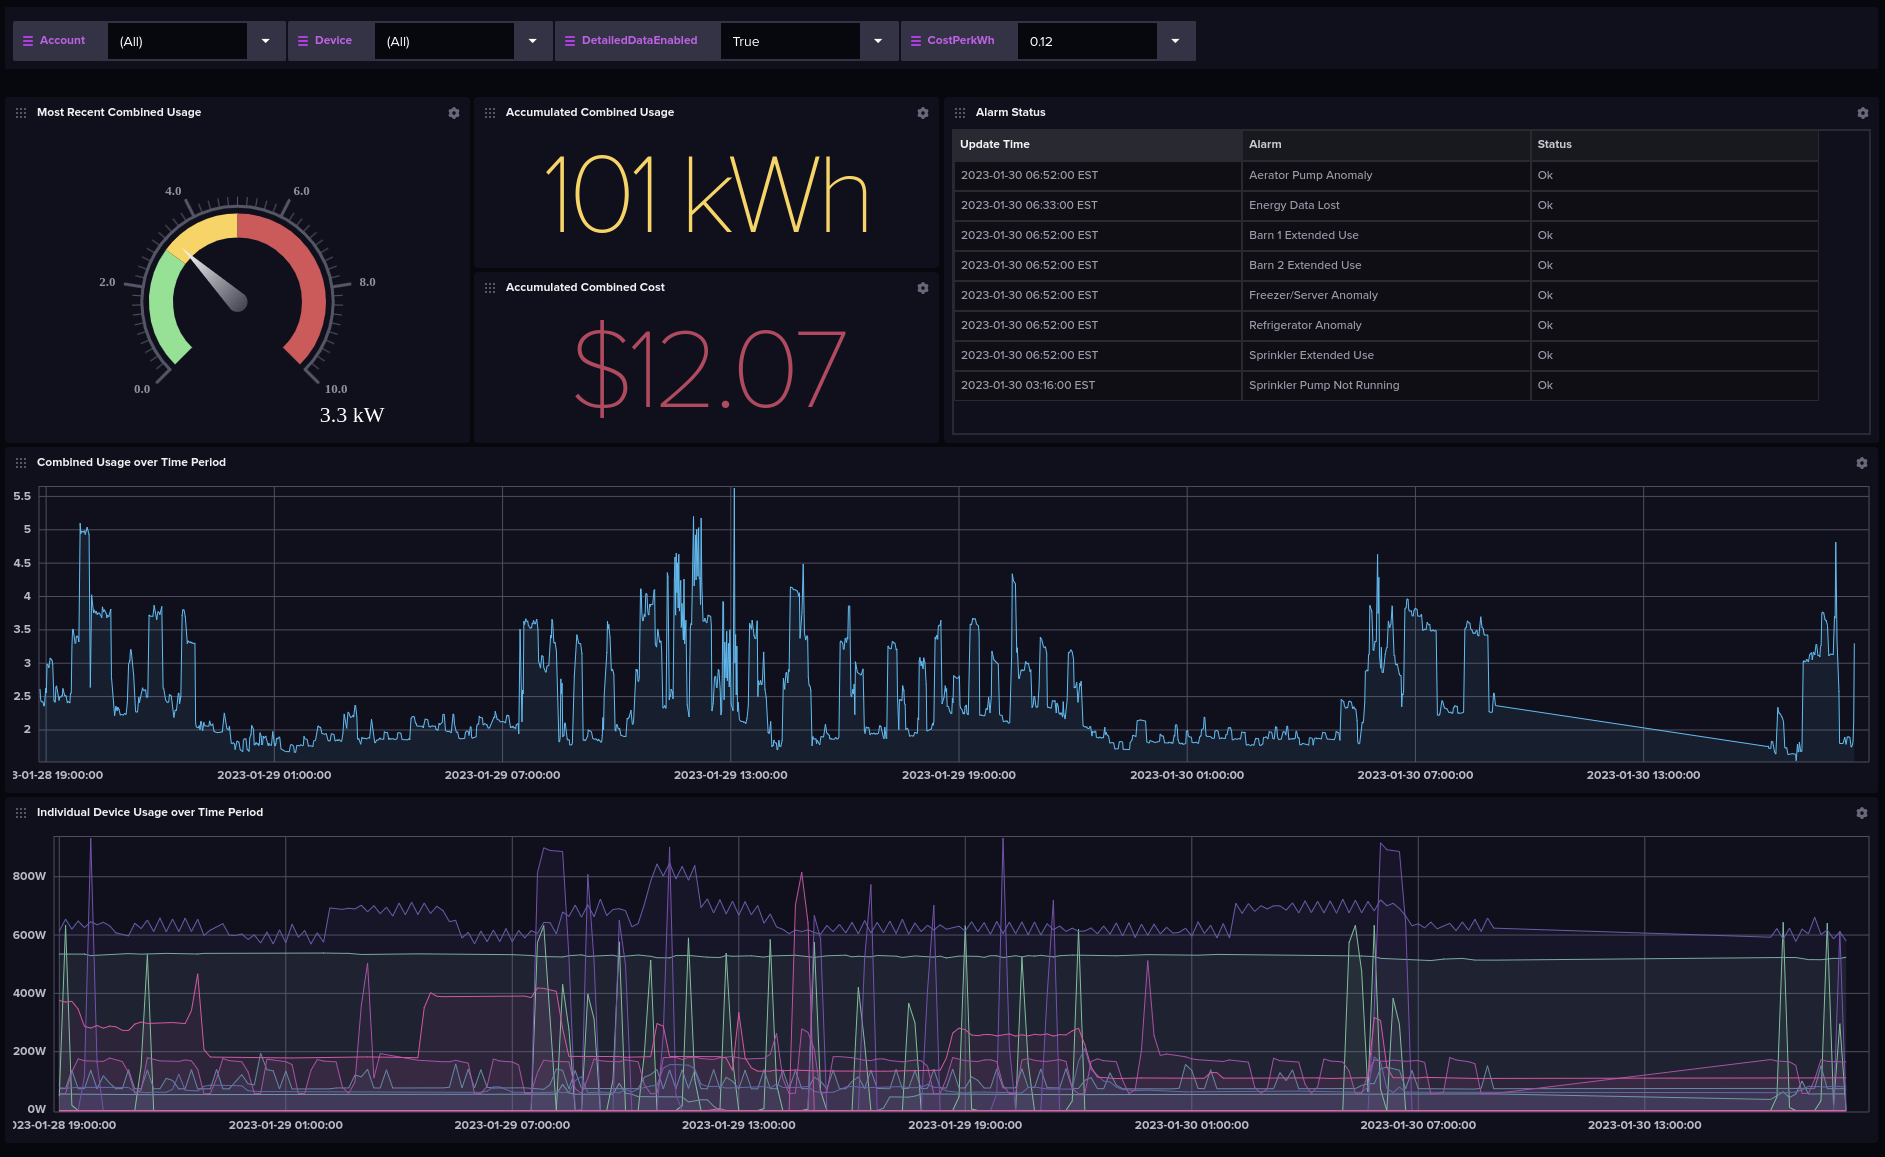
The Emporia Vue energy monitoring kit allows homeowners to monitor their electrical usage. It monitors the main feed consumption and up to 8 (or 16 in the newer version) individual branch circuits, and feeds that data back to the Emporia API server.
This project, Vuegraf, fetches those metrics from the Emporia Vue API host and stores the metrics into your own InfluxDB. After installation you will be able to:
- View your energy usage across all circuits on a single graph
- Create alerts to notify when certain energy usage thresholds are exceeded
This project is not affiliated with emporia energy company.
Dependencies
- Emporia Vue Account - Username and password for the Emporia Vue system are required.
- Python 3 - With Pip.
- InfluxDB 2 - Host, port, org, bucket, and token are all required.
Influx
Setup
If you do not yet have a running InfluxDB 2 instance, you will need to set one up. You can do this very quickly by launching an InfluxDB 2 Docker container as follows:
mkdir -p /home/myuser/influxdb2
docker run -v /home/myuser/influxdb2:/var/lib/influxdb2 -p 8086:8086 -e INFLUXD_SESSION_LENGTH=432000 --name influxdb influxdb
Substitute an appropriate host path for the /home/myuser/influxdb2 location above. Once running, access the web UI at http://localhost:8086. It will prompt you for a username, password, organization name, and bucket name. The rest of this document assumes you have entered the word vuegraf for all of these inputs, except for the password; choose your own password that meets the minimum requirements.
Note that the default session timeout for Influx is only 60 minutes, so this command increases the login session to 300 days.
Once logged in, go to the Load Data -> API Tokens screen and generate a new All Access token with the description of vuegraf. Copy the generated token for use in the rest of this document, specifically when referenced as <my-influx-token>.
Dashboard
By default, a new InfluxDB instance will not have any dashboards loaded. You will need to import the included Influx JSON template, or create your own dashboard in order to visualize your energy usage. Because this template contains more than just the dashboard itself you will not be able to use the InfluxDB UI to perform the import. You will need to use the instructions included below.
The included template file named influx_dashboard.json includes the provided dashboard and accompanying variables to reproduce the visualizations shown below. This dashboard assumes your main/parent device name contains the word Panel (specifically cased as shown), such as House Panel, or Right Panel. If it does not, the Flux queries will need to be adjusted manually to look for your device's name. Note that nested devices should contain the word Subpanel (again using that specific upper/lower casing).

You will need to apply this template file to your running InfluxDB instance. First, copy the influx_dashboard.json file into your new InfluxDB container:
docker cp <path-to-vuegraf-project>/influx_dashboard.json influxdb:/var/lib/influxdb2/Next, to import the dashboard, run the following command:
docker exec influxdb influx apply -f /var/lib/influxdb2/influx_dashboard.json --org vuegraf --force yes -t <my-influx-token>Replace the <my-influx-token> with the All Access Token you generated in the Influx Load Data -> API Tokens screen.
You're now ready to proceed with the Vuegraf configuration and startup.
Configuration
The configuration allows for the definition of multiple Emporia Vue accounts. This will only be useful to users that need to pull metrics from multiple accounts. This is not needed if you have multiple Vue devices in a single account. Vuegraf will find multiple devices on its own within each account.
The email address and password must match the credentials used when creating the Emporia Vue account in their mobile app.
Important: Ensure that sufficient protection is in place on this configuration file, since it contains the plain-text login credentials into the Emporia Vue account.
A sample configuration file is provided in this repository, and details are described below.
Minimal Configuration
The minimum configuration required to start Vuegraf is shown below.
{
    "influxDb": {
        "version": 2,
        "url": "http://my.influxdb.hostname:8086",
        "org": "vuegraf",
        "bucket": "vuegraf",
        "token": "<my-influx-token>"
    },
    "accounts": [
        {
            "name": "Primary Residence",
            "email": "my@email.address",
            "password": "my-emporia-password"
        }
    ]
}
Advanced Configuration
Timezones
All data is stored in InfluxDB in UTC. To represent day-summary datapoints, vuegraf fetches a day's data at the end of the day in a certain timezone, configured by the configuration field timezone.
- if
timezoneis missing or null or itsupper()is"TZ", then the "default timezone" will be used- the "default timezone" depends on the deployment method of the script
- If you are using Docker, the container has the timezone set to UTC unless the environment
TZis set. - If you are running the script natively, it depends on your operating system. For example, in Ubuntu the timezone name is the contents of
/etc/timezone
- for all values of
timezoneother than the ones named above, the string SHOULD be a valid timezone name.
The configured timezone is only relevant for collecting day-scoped data: the script fetches Emporia's "day to date" counter values, so if the account's timezone does not match the script one's, the last hours of the day will not be counted. For example, if your account is in the America/Los_Angeles timezone while the script runs its default UTC configuration in a Docker container, the daily summaries will miss the last 8 hours of every day.
For a list of timezones as of late 2023, consult the TZ identifier column of the table at this wikipedia page.
Ingesting Historical Data
If desired, it is possible to have Vuegraf import historical data. To do so, run vuegraf.py with the optional --historydays parameter with a value between 1 and 720. When this parameter is provided Vuegraf will start and collect all hourly data points up to the specified parameter, or max history available. It will also collect one day's summary data for each day, storing it with the timestamp 23:59:59 for each day. It collects the time using the configured timezone, but stores it in influxDB in UTC.
IMPORTANT - If you restart Vuegraf with --historydays on the command line (or forget to remove it from the dockerfile) it will import history data again. This will likely cause confusion with your data since you will now have duplicate/overlapping data. For best results, only enable --historydays on a single run.
For Example:
python3 path/to/vuegraf.py vuegraf.json --historydays 365Channel Names
To provide more user-friendly names of each Vue device and branch circuit, the following device configuration can be added to the configuration file, within the account block. List each device and circuit in the order that you added them to the Vue mobile app. The channel names do not need to match the names specified in the Vue mobile app but the device names must match. The below example shows two 8-channel Vue devices for a home with two breaker panels.
Be aware that the included dashboard assumes your device name contains the word "Panel". For best results, consider renaming your Vue device to contain that word, otherwise you will need to manually adjust the included dashboards' queries.
            "devices": [
                {
                    "name": "Right Panel",
                    "channels": [
                        "Air Conditioner",
                        "Furnace",
                        "Coffee Maker",
                        "Oven",
                        "Pool Vacuum",
                        "Pool Filter",
                        "Refrigerator",
                        "Office"
                    ]
                },
                {
                    "name": "Left Panel",
                    "channels": [
                        "Dryer",
                        "Washer",
                        "Dishwasher",
                        "Water Heater",
                        "Landscape Features",
                        "Septic Pump",
                        "Deep Freeze",
                        "Sprinkler Pump"
                    ]
                }
            ]
Running
Vuegraf can be run either as a container (recommended), or as a host process.
Container (recommended)
A Docker container is provided at hub.docker.com. Refer to the command below to launch Vuegraf as a container. This assumes you have created a folder called /home/myuser/vuegraf and placed the vuegraf.json file inside of it.
Normal run with docker
docker run --name vuegraf -d -v /home/myuser/vuegraf:/opt/vuegraf/conf jertel/vuegrafRecreate database and load 25 days of history
docker run --name vuegraf -d -v /home/myuser/vuegraf:/opt/vuegraf/conf jertel/vuegraf --resetdatabase --historydays=24Host Process
Ensure Python 3 and Pip are both installed. Install the required dependencies:
pip install -r src/requirements.txtor, on some Linux installations:
pip3 install -r src/requirements.txtThen run the program via Python, specifying the JSON configuration file path as the only argument:
python src/vuegraf/vuegraf.py vuegraf.jsonor, on some Linux installations:
python3 src/vuegraf/vuegraf.py vuegraf.jsonOptional Command Line Parameters
usage: vuegraf.py [-h] [--version] [-v] [-q] [--historydays HISTORYDAYS] [--resetdatabase] configFilename

Retrieves data from cloud servers and inserts it into an InfluxDB database.

positional arguments:
  configFilename        JSON config file

options:
  -h, --help            show this help message and exit
  --version             Display version number
  -v, --verbose         Verbose output - summaries
  --historydays HISTORYDAYS
                        Starts executing by pulling history of Hours and Day data for specified number of days.
                        example: --load-history-day 60
  --resetdatabase       Drop database and create a new one
Alerts
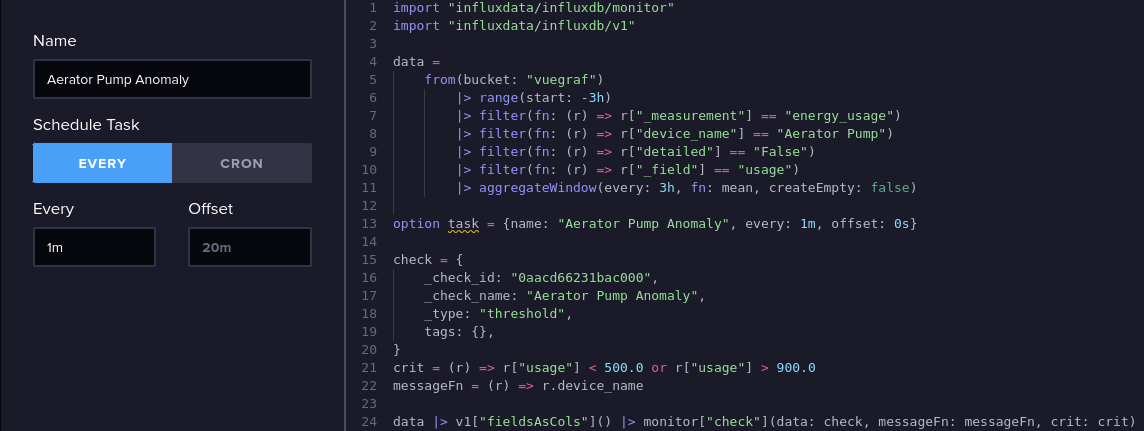
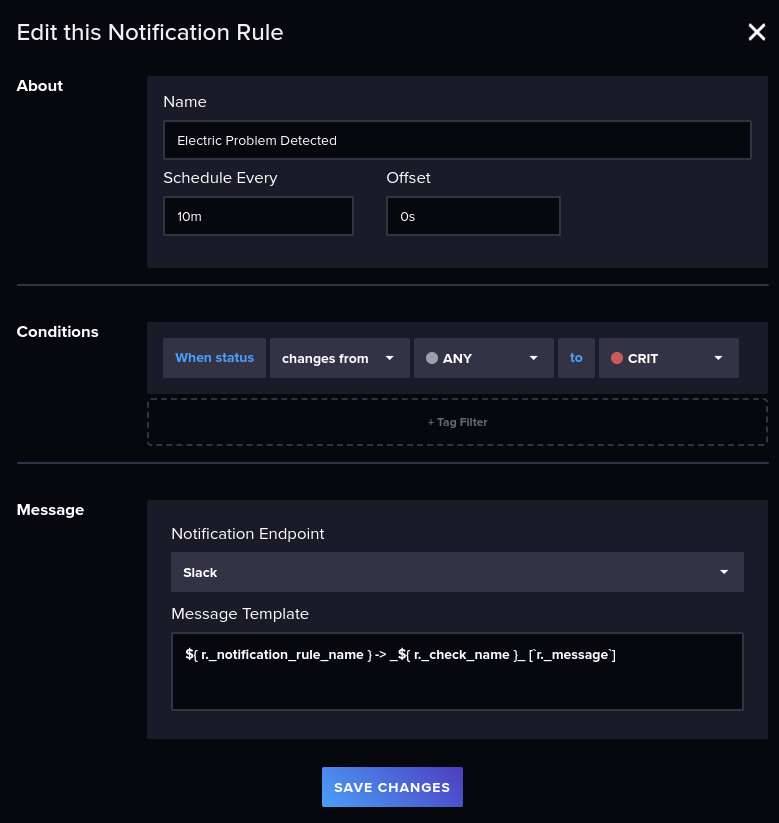
The included dashboard template contains two alerts which will trigger when either a power outage occurs, or a loss of Vuegraf data. There are various reasons why alerts can be helpful. See the below screenshots which help illustrate how a fully functioning alert and notification rule might look. Note that the included alerts do not send out notifications. To enable outbound notifications, such as to Matrix or Slack, you can create a Notification Endpoint and Notification Rule.
This alert was edited via the text (Flux) interface since the alert edit UI does not yet accommodate advanced alerting inputs.
Side note: The logo at the top of this documentation satisfies Slack's icon requirements. Consider using it to help quickly distinguish between other alerts.

This notification rule provides an example of how you can have several alerts change the status to crit, but only a single notification rule is required to transmit notifications to external endpoints (such as email or Slack).

To send alerts to a Matrix chat room hosted on a Synapse server, use a Hookshot bot with appropriate URL path routing (via a reverse proxy), and in InfluxDB, specify the Alert Endpoint as follows:
- Destination: HTTP
- HTTP Method: POST
- Auth Method: None
- URL: https://my-matrix-host.net/webhook/1234abcd-4321-1234-abcd-abcdef123456
In the above example, /webhook/ routes to the Hookshot server. Then edit the Alert Notification Rule, and change the body variable assignment as follows:
body = {text: "🔴 ${r._notification_rule_name} -> ${r._check_name}"}Additional Topics
Per-second and per-hour Data Details
By default, Vuegraf will poll every minute to collect the energy usage value over the past 60 seconds. This results in a single value being captured per minute per channel, or 60 values per hour per channel. If you also would like to also fetch per-second and/or per-hour values, you can enable the detailed collection, which is polled once per hour, and backfilled over the previous 3600 seconds. This API call is very expensive on the Emporia servers, so it should not be polled more frequently than once per hour. To enable this detailed data, add (or update) the top-level detailedDataEnabled configuration value with a value of true.
detailedDataEnabled: trueIf detailedDataEnabled is set to true, the following two configuration fields become relevant. Notice that they are not mutually exclusive and are actually both set to true unless overridden:
detailedDataSecondsEnabled(default value istrue): fetch and store per-second data every hourdetailedDataHoursEnabled(default value istrue): fetch and store per-hour data every hour
For every datapoint a tag is stored in InfluxDB for the type of measurement
detailed = Truerepresents backfilled per-second data that is optionally queried from Emporia once every hour.detailed = Falserepresents the per-minute average data that is collected every minute.detailed = Hourrepresents the data summarized in hoursdetailed = Dayrepresents a single data point to summarize the entire day
When building graphs that show a sum of the energy usage, be sure to only include the correct detail tag, otherwise your summed values will be higher than expected. Detailed data will take more time for the graphs to query due to the extra data involved. If you want to have a chart that shows daily data over a long period or even a full year, use the detailed = Day tag.
If you are running this on a small server, you might want to look at setting a RETENTION POLICY on your InfluxDB bucket to remove minute or second data over time. For example, it will reduce storage needs if you retain only 30 days of per-second data.
Vue Utility Connect Energy Monitor
As reported in discussion #104, the Utility Connect device is supported without any custom changes.
Smart Plugs
To include an Emporia smart plug in the configuration, add each plug as it's own device, without channels. Again, the name of the Smart Plug device must exactly match the name you gave the device in the Vue app during initial registration.
            devices: [
                {
                    "name": "Main Panel",
                    "channels": [
                        "Air Conditioner",
                        "Furnace",
                        "Coffee Maker",
                        "Oven",
                        "Dishwasher",
                        "Tesla Charger",
                        "Refrigerator",
                        "Office"
                    ]
                },
                {
                    "name": "Projector Plug"
                },
                {
                    "name": "3D-Printer Plug"
                }
            ]
Docker Compose
For those that want to run Vuegraf using Docker Compose, the following files have been included: docker-compose.yaml.template and docker-compose-run.sh. Copy thedocker-compose.yaml.template file to a new file called docker-compose.yaml. In the newly copied file, vuegraf.volumes values will need to be changed to the same directory you have created your vuegraf.json file. Additionally, adjust the persistent host storage path for the InfluxDB data volume.
Finally run the docker-compose-run.sh script to start up the multi-container application.
./docker-compose-run.shUpgrading from InfluxDB v1
Early Vuegraf users still on InfluxDB v1 can upgrade to InfluxDB 2. To do so, stop the Influx v1 container (again, assuming you're using Docker). Then run the following command to install InfluxDB 2 and automatically upgrade your data.
docker run --rm --pull always -p 8086:8086 \
  -v /home/myuser/influxdb:/var/lib/influxdb \
  -v /home/myuser/influxdb2:/var/lib/influxdb2 \
  -e DOCKER_INFLUXDB_INIT_MODE=upgrade \
  -e DOCKER_INFLUXDB_INIT_USERNAME=vuegraf \
  -e DOCKER_INFLUXDB_INIT_PASSWORD=vuegraf \
  -e DOCKER_INFLUXDB_INIT_ORG=vuegraf \
  -e DOCKER_INFLUXDB_INIT_BUCKET=vuegraf \
  -e DOCKER_INFLUXDB_INIT_RETENTION=1y \
  influxdb
Adjust the host paths above as necessary, to match the old and new influxdb directories. The upgrade should complete relatively quickly. For reference, a 7GB database, spanning several months, upgrades in about 15 seconds on SSD storage.
Monitor the console output and once the upgrade completes and the Influx server finishes starting, shut it down (CTRL+C) and then restart the Influx DB using the command referenced earlier in this document.
Login to the new Influx DB 2 UI from your web browser, using the vuegraf / vuegraf credentials. Go into the Load Data -> Buckets screen and rename the vue/autogen bucket to vuegraf via the Settings button.
Finally, apply the dashboard template as instructed earlier in this document.
Productionalizing the Server
There are additional steps necessary for making this configuration fault tolerant. Consider implementing the following:
- Configuring the container to always restart (such as after a reboot or a crash)
- Backing up the InfluxDB on a frequent basis
- Configure logging for rollover management, such as by file size or date
- Configure OS alerts to an admin when detecting crashes of critical software, such as InfluxDB
- Checking for low disk space on the host and alerting an admin
- Setting up calendar reminders for host OS updates and associated kernel reboots
- Updating Vuegraf and Influx on a schedule
- Much more!
These topics are out of scope of this project, but are intended to help new system administrators understand different areas that need to be considered for ensuring disaster recovery and prevention of vulnerabilities.
License
Vuegraf is distributed under the MIT license.
See LICENSE for more information.