Shaded relief maps in blender
Tutorial
This guide will help you prepare DEM data using QGIS in order to render 3D looking shaded-relief maps in Blender.
Tweet me your finished maps, and feel free to ask any questions! 
Requirements
For this tutorial i used the following software:
- Blender 2.92
- QGIS 3.20
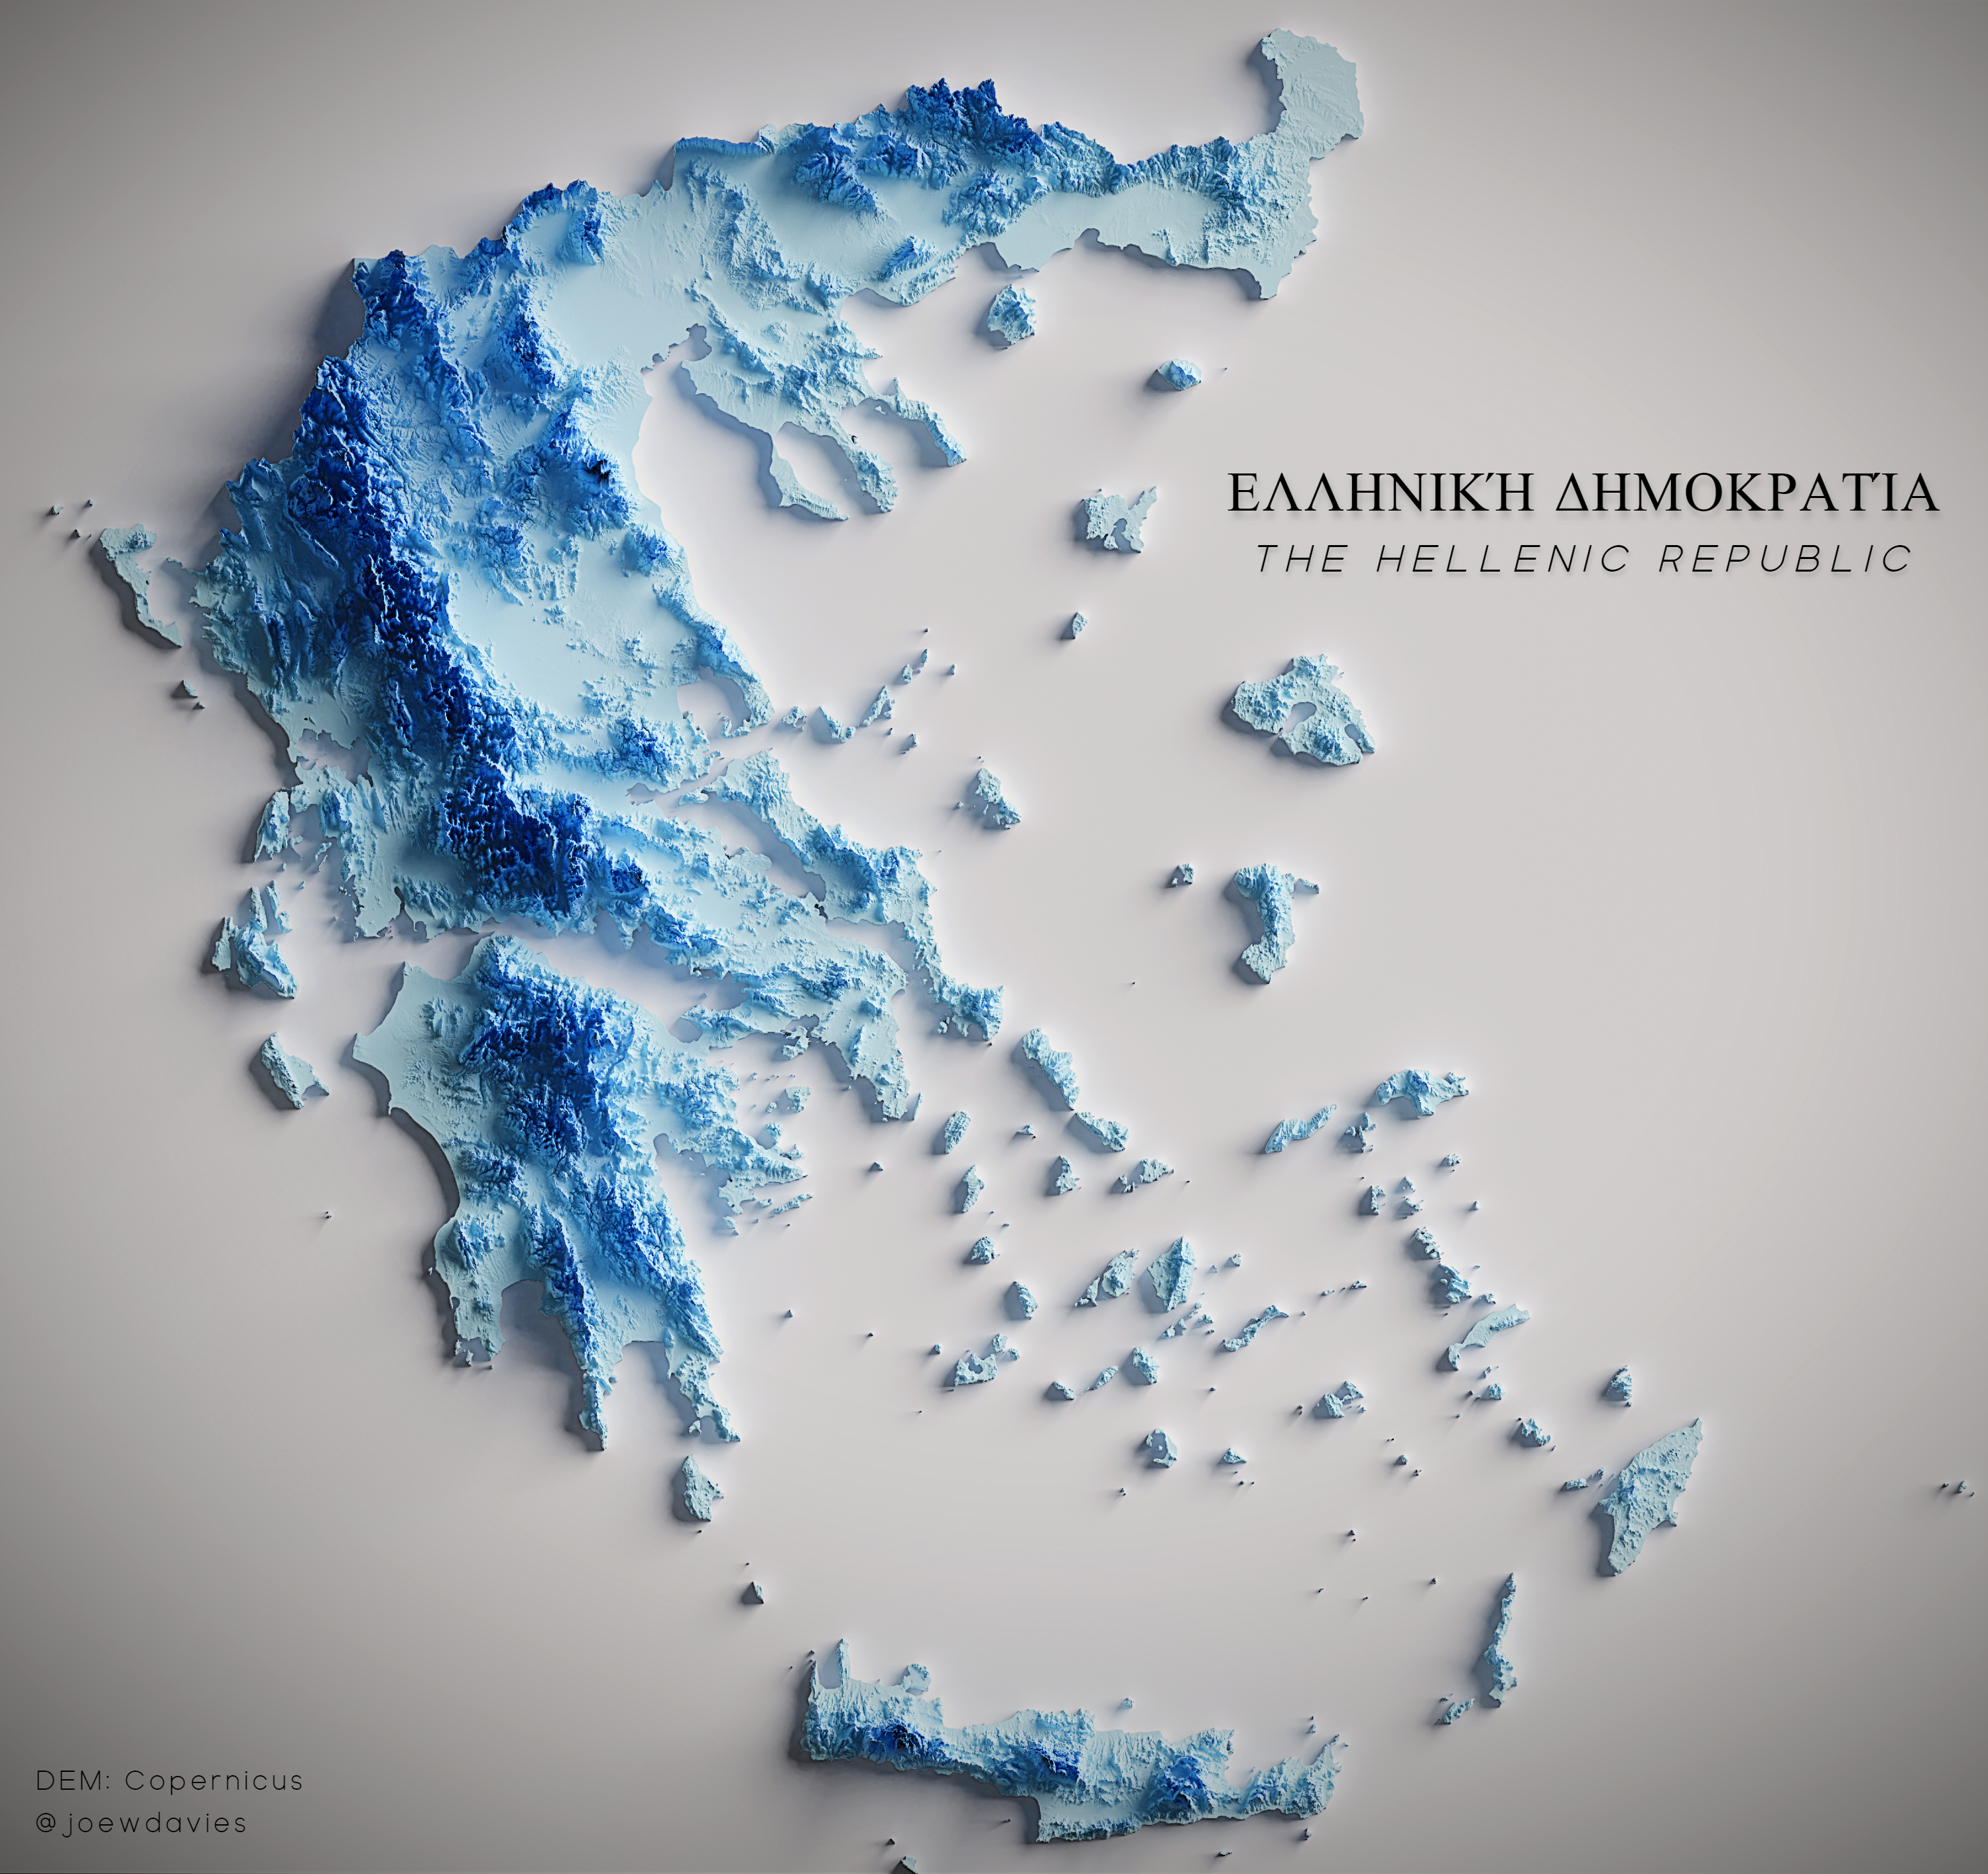
I will be going through the whole process, using Wales as my area of interest.
Table of Contents
- Prepare the DEM
- Prepare blender scene
- Plug the DEM into the plane
- Add modifier
- Add colour
- Add mask (optional)
Step 1: Prepare the DEM
-
First download the elevation tiles from your preferred source. I usually get mine from here. In this example I am using a tile which covers Wales.
-
If you need to merge multiple tiles together for your area of interest then use raster > miscellaneous > merge.
-
If you wish to clip the DEM to a specific area then in QGIS use raster > extraction > clip raster by mask layer and use a polygon of your area of interest as 'mask layer'. In this example I used a polygon of Wales to clip the DEM, both of them being the same projection (EPSG:4326).
-
Now reproject the DEM into your desired projection in QGIS using raster > projections > warp (reproject). In this example I am reprojecting to EPSG:27700 (British National Grid).
-
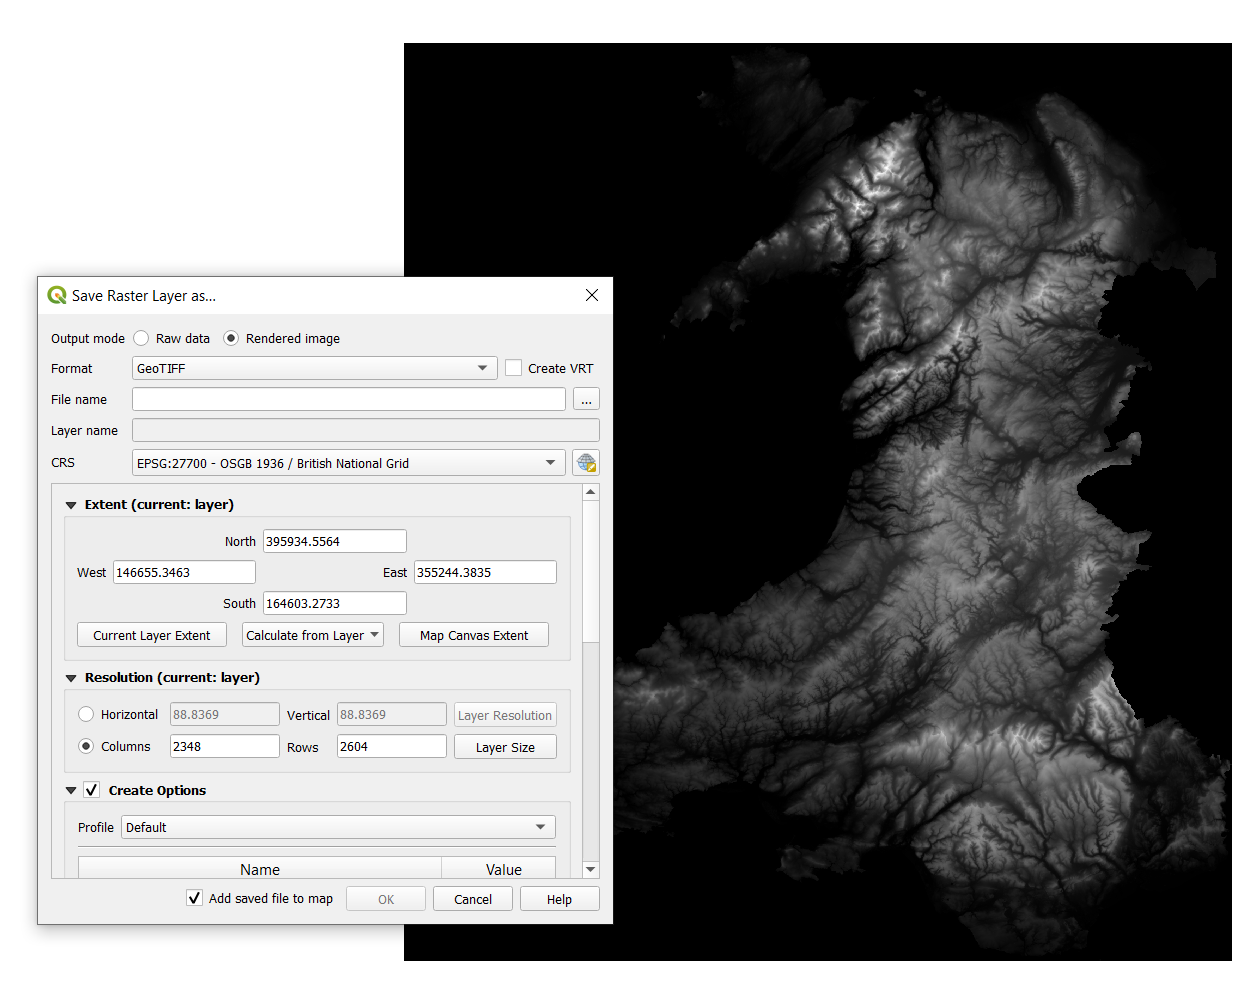
Once you have your reprojected DEM, right click it in the layers tab and select export > saveas then in the popup window select 'rendered image' as the output mode. This rendered image is what we will use in Blender.
Step 2 : Prepare blender scene
Please bear in mind that this will take longer the first time you do it, but once it is set up you can just reuse the project as a template and adjust the dimensions to the different DEMs.
Scene settings
-
First delete the cube that is loaded by default (left click then delete key).
-
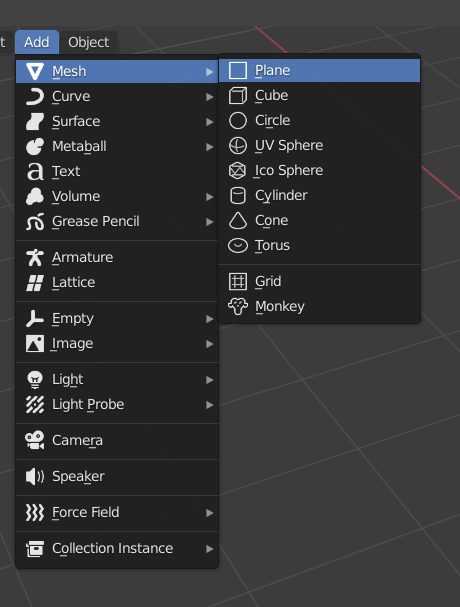
Then we need to add a plane. This is done by selecting add > mesh > plane.
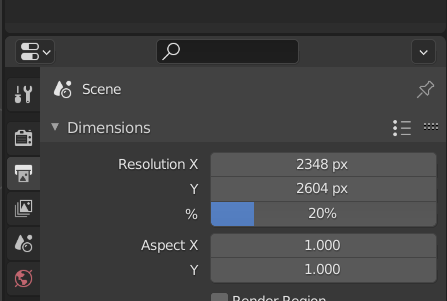
- Set the dimensions of the scene according to the dimensions of our DEM image (in this case, the rendered DEM is 2348 x 2604 so I will set the X in scene dimensions to 2348 and the Y to 2604).
-
Also notice that I set the % of the scene dimensions to 20%. This just means that renders will be a lot quicker whilst we are tinkering with different settings until we are happy. Once everything is ready we can crank it up to 100% (or for bigger DEMs whatever our computer is capable of!) and the render will take longer but will produce an image with a higher resolution.
-
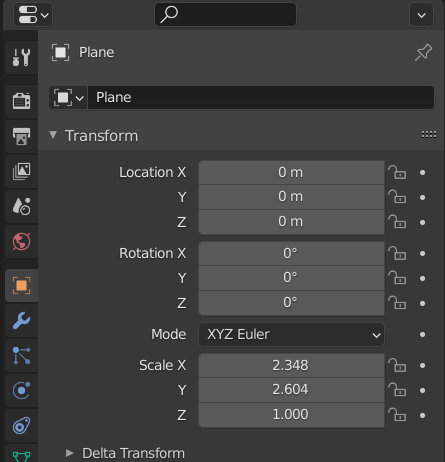
We also need to make sure that the aspect ratio of our scene matches our DEM image. To do this, we can just set the scale of our plane to match the dimensions of our DEM. In this example my DEM is 2348 x 2604 so I will set the plane X scale to 2.348 and the Y scale to 2.604.
- Just like this % value of the scene dimensions, we can increase and decrease the 'render' value in the 'render properties' tab to determine how many passes blender takes for each pixel (higher = more detailed, lower = less detailed).
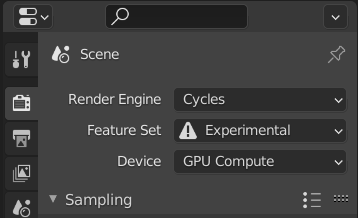
- In the same tab, we must also set the render engine to 'cycles' and set 'feature set' to experimental. This enables blender to do its shaded-relief magic. If you have a powerful graphics card I reccommend chaning the 'device' to 'GPU compute' - that way renders will be much faster.
Lighting settings
-
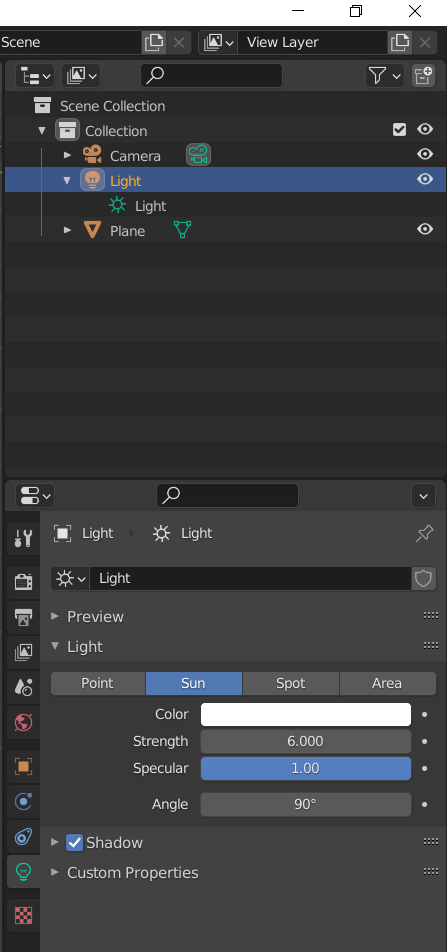
We also need to configure the light source of our scene. We need to select sun as our light, so to do this left click the light object in the object collection (top right) then select the 'object data properties' panel then select sun, set the power to 6 and the angle to 90.
-
If you want to exaggerate the shadows, change this angle from 90 to say 70 (or whatever you want!) just bear in mind that valleys will lose visibility as you reduce this value.
-
Now open the object properties panel (orange square icon for me) and for rotation put 0 for X, 45 for Y, and 135 for Z.
I wont go into detail as to why I've chosen these values, but for a more in-depth explanation on lighting shaded relief maps in blender check out this tutorial. Feel free to play around with these values once we've done our first render.
Camera settings
Finally, we need to set our camera to how we want it. To do this, select the camera object in the object collection (top right) then set the following values:
-
In the object properties panel, set the location X and Y values to 0, and the Z to 3.
-
Then set the rotation X Y and Z to 0.
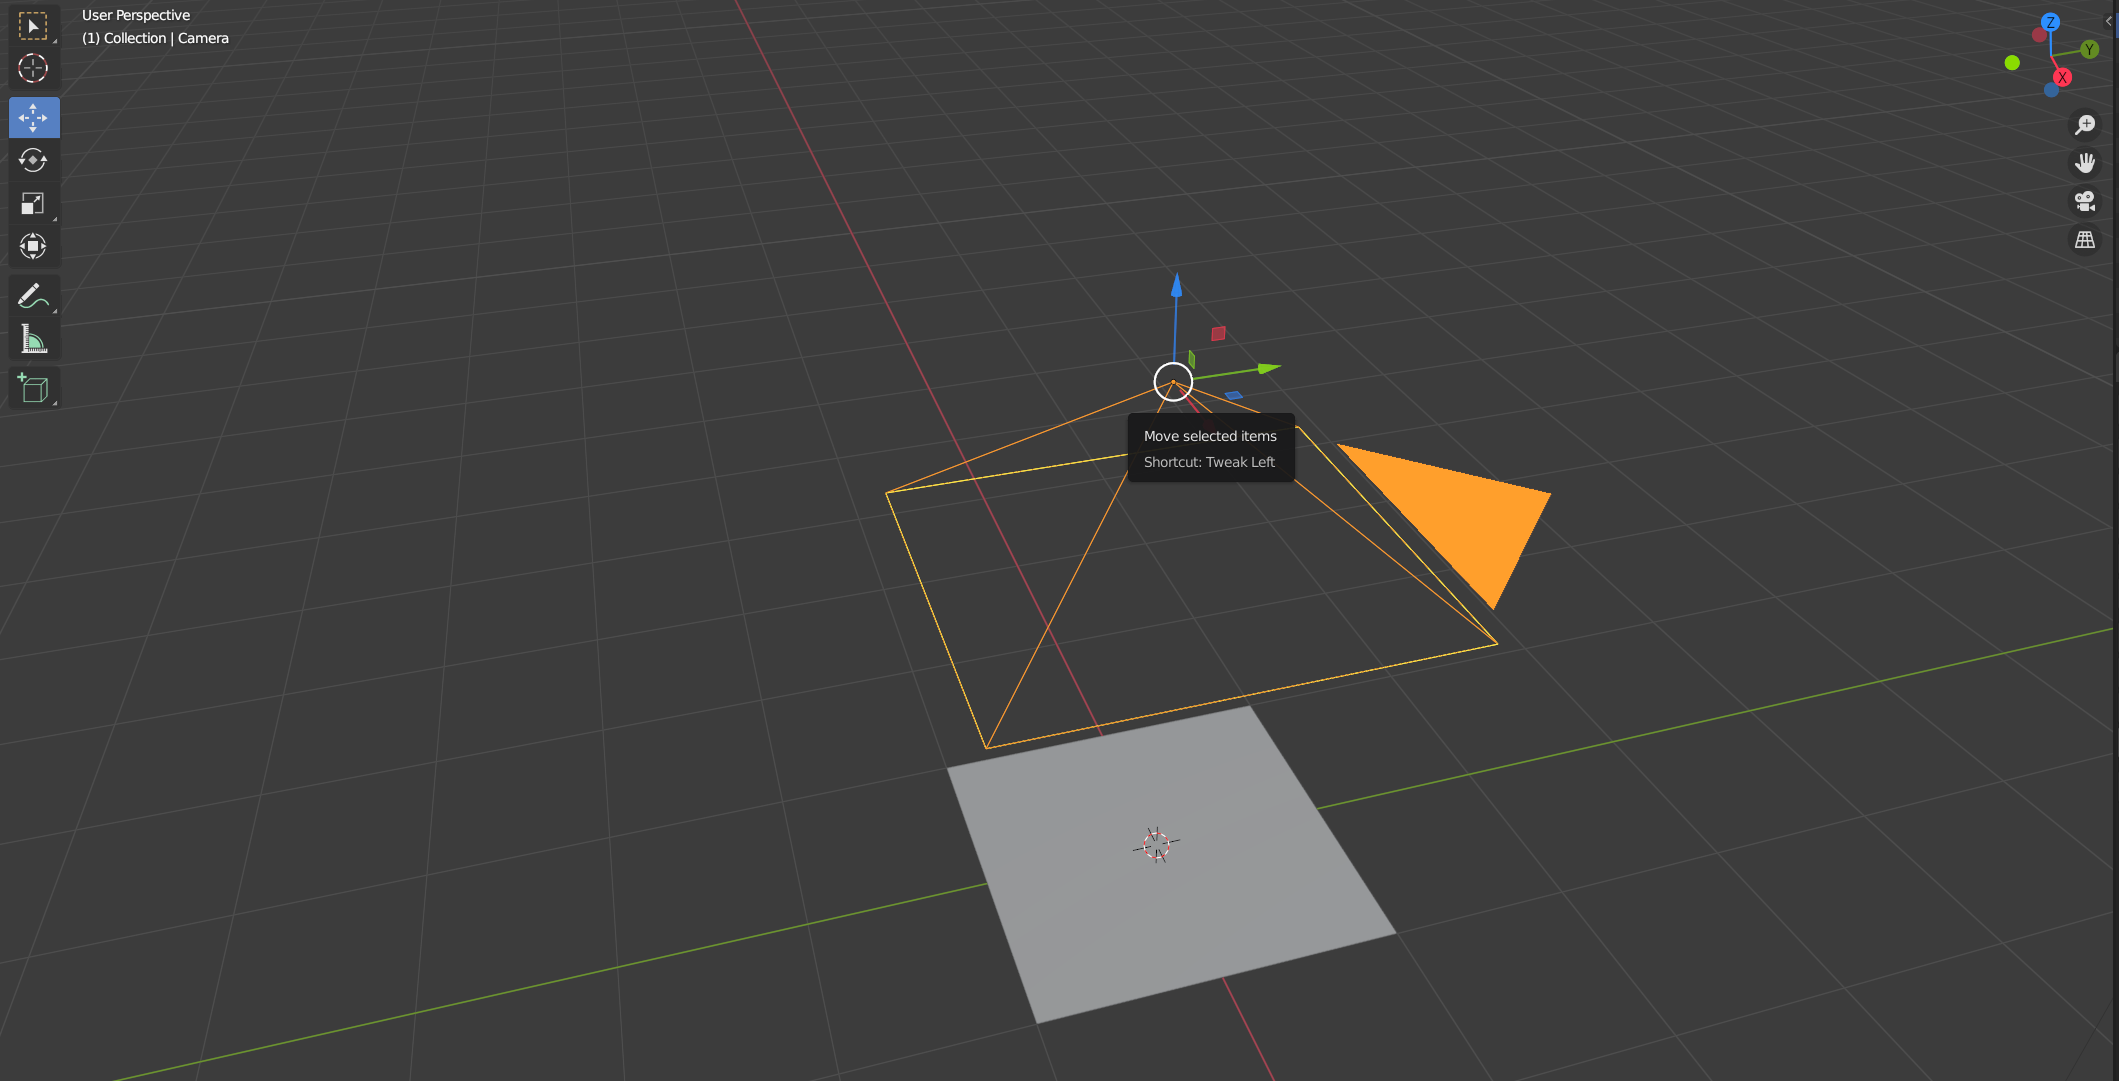
If the camera is too zoomed-in, adjust the focal length property (when using a perspective camera) or the orthographic scale (when using an orthographic camera). You can also adjust the Z position of the camera. For playing around with different camera angles I suggest switching to the '3D viewport' editor type and moving the camera by hand (see screenshot below).
Step 3 : Plug the DEM into the plane
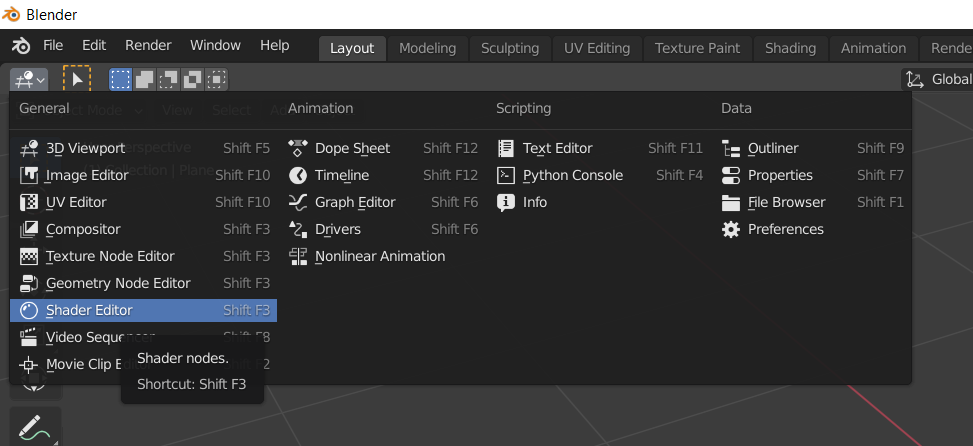
- In order for the plane to use our DEM for elevation, we need to add a new material to our plane. To do this, select the plane in the object collections panel (top right), then change the editor mode to shader editor.
-
Once in shader editor click 'new material' which should add two new nodes: a principled BSDF and a material output.
-
All we need to do is add an image texture by clicking add > image texture. When the node appears, click the open image button and select the DEM .tif file we prepared earlier.
-
Now add a displacement node by selecting add > displacement.
-
Click the 'color' circle of the image texture node and drag to the 'height' circle of the displacement node. Then do the same but from 'displacement' of the displacement node to 'displacement' of the material output. It should now look something like this:
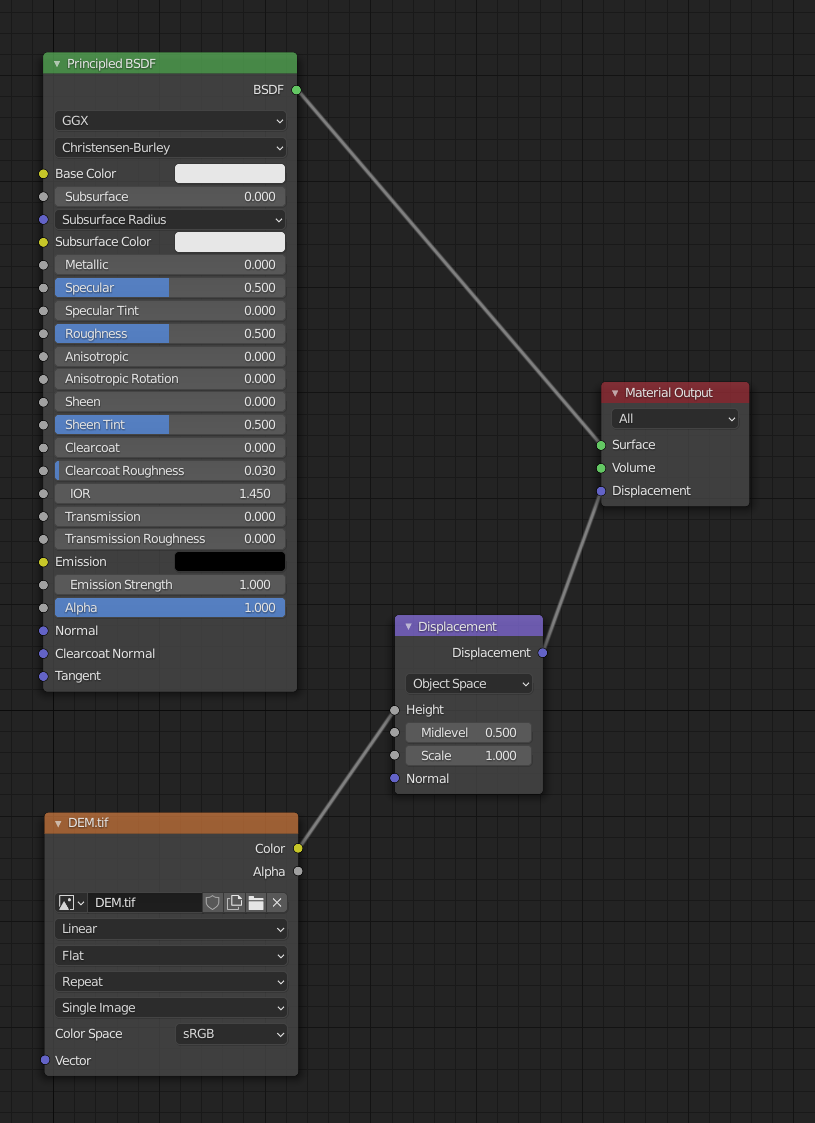
- Finally, with the plane selected: go into the material properties > settings > surface and change displacement to 'displacement and bump'

Step 4 : Add modifier
If you render the image now (render > render image or F12) you should get something like this:
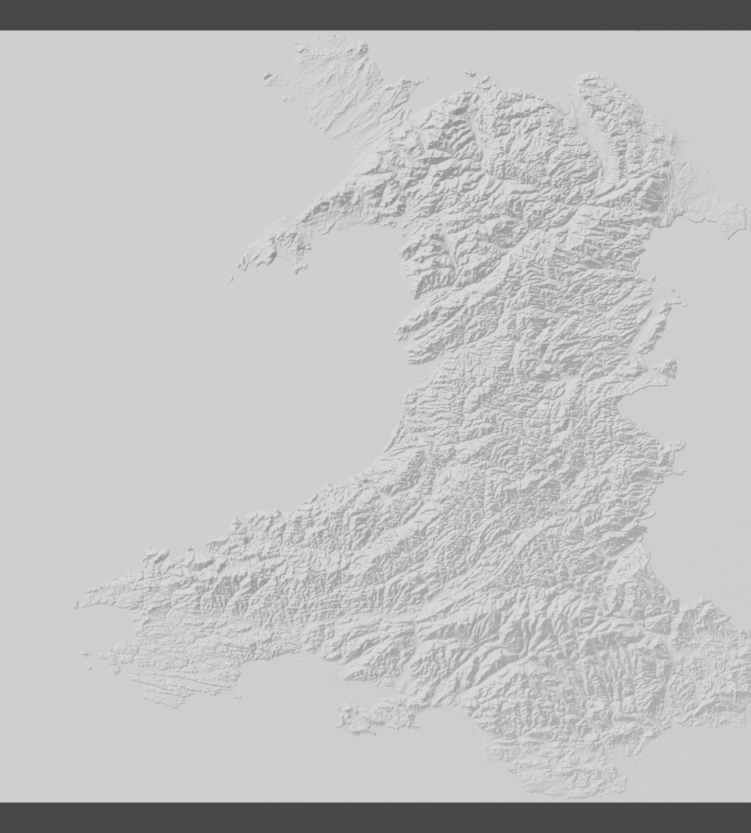
Which is not what we want (blender is not deforming the plane 'in 3D' it is just showing a 2D hillshade).
To change this lets add a modifier:
- click the blue spanner icon to open modifier properties then click add modifier > subdivision surface. Now select 'simple' as the type of subdivision algorithm then tick 'adaptive subdivision'.
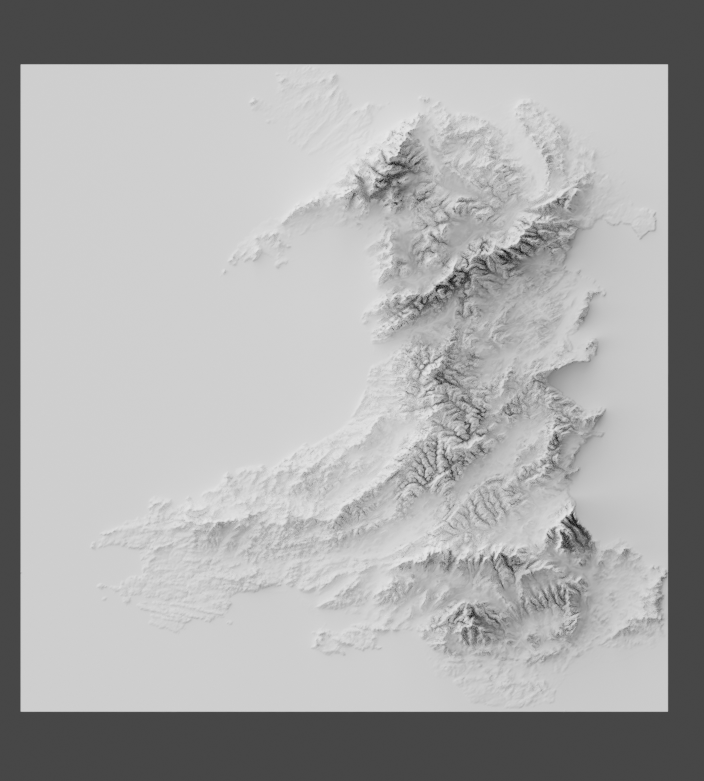
Now press F12 to render again and you should end up with something like this:
Step 5 : Add colour!
In order to add colour we can add a colour ramp which will use our DEM to determine the colour of each pixel.
-
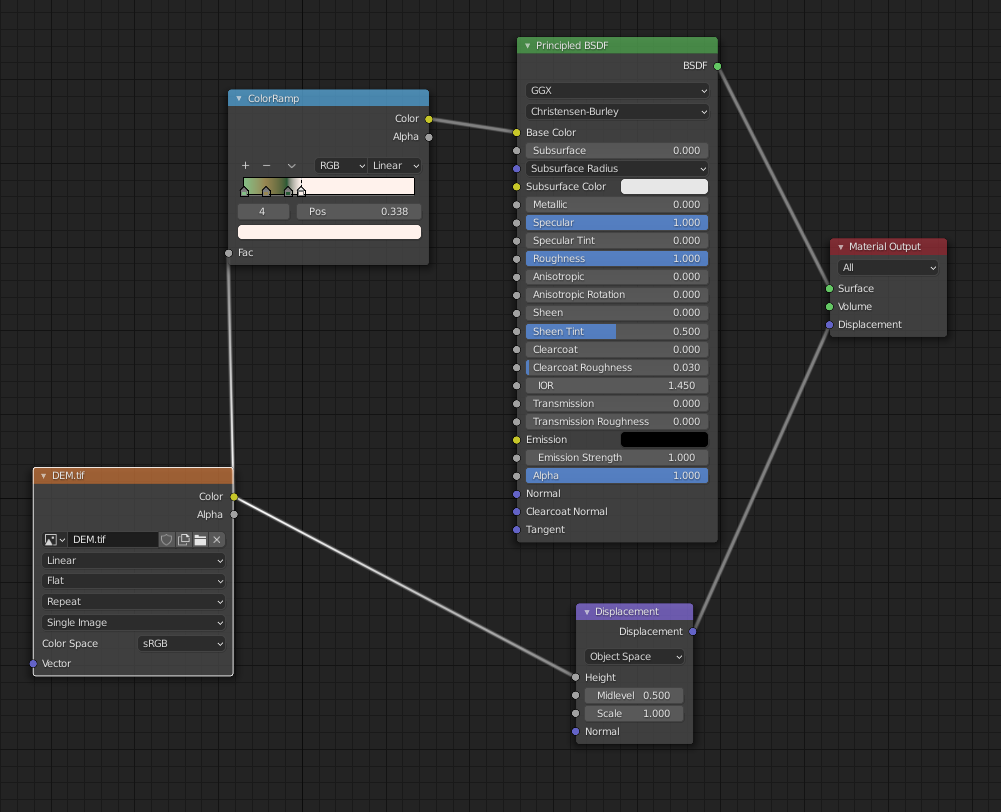
First add a colour ramp node with add > color ramp.
-
Plug the DEM image texture node 'color' into the 'fac' of the color ramp node and then the 'color' of the color ramp node into the 'color' of the principled BSDF shader node.
-
Add color stops by using the '+' icon and click the color to open the color selector.
Play around with the colours and their positions on the ramp to make cool renders.
Extra: Mask for AOI
If you are using a colour ramp with your DEM then you probably want to distinguish between features such as land and sea. This can be accomplished using a mask. Here I will briefly explain how I do this.
Step 1 : Rasterize vector polygon of AOI in QGIS (raster > conversion > rasterize) with the following options:
input layer: your vector polygon
value to burn: 1
output units : pixels
width resolution : width of final DEM tif in pixels
height resolution : height of final DEM tif in pixels
output extent: same extent as our final DEM tif
no data value: -1
output data type: byte
Step 2: Save the generated raster as a rendered image (export > saveas > outputmode = rendered image).
Step 3 : Open output raster in irfranView (or your preferred image editor), save as png > select black area as transparent color. (this is just how I do it, as long as you can use the alpha channel of the image to distinguish between your AOI and areas outside it then thats fine).
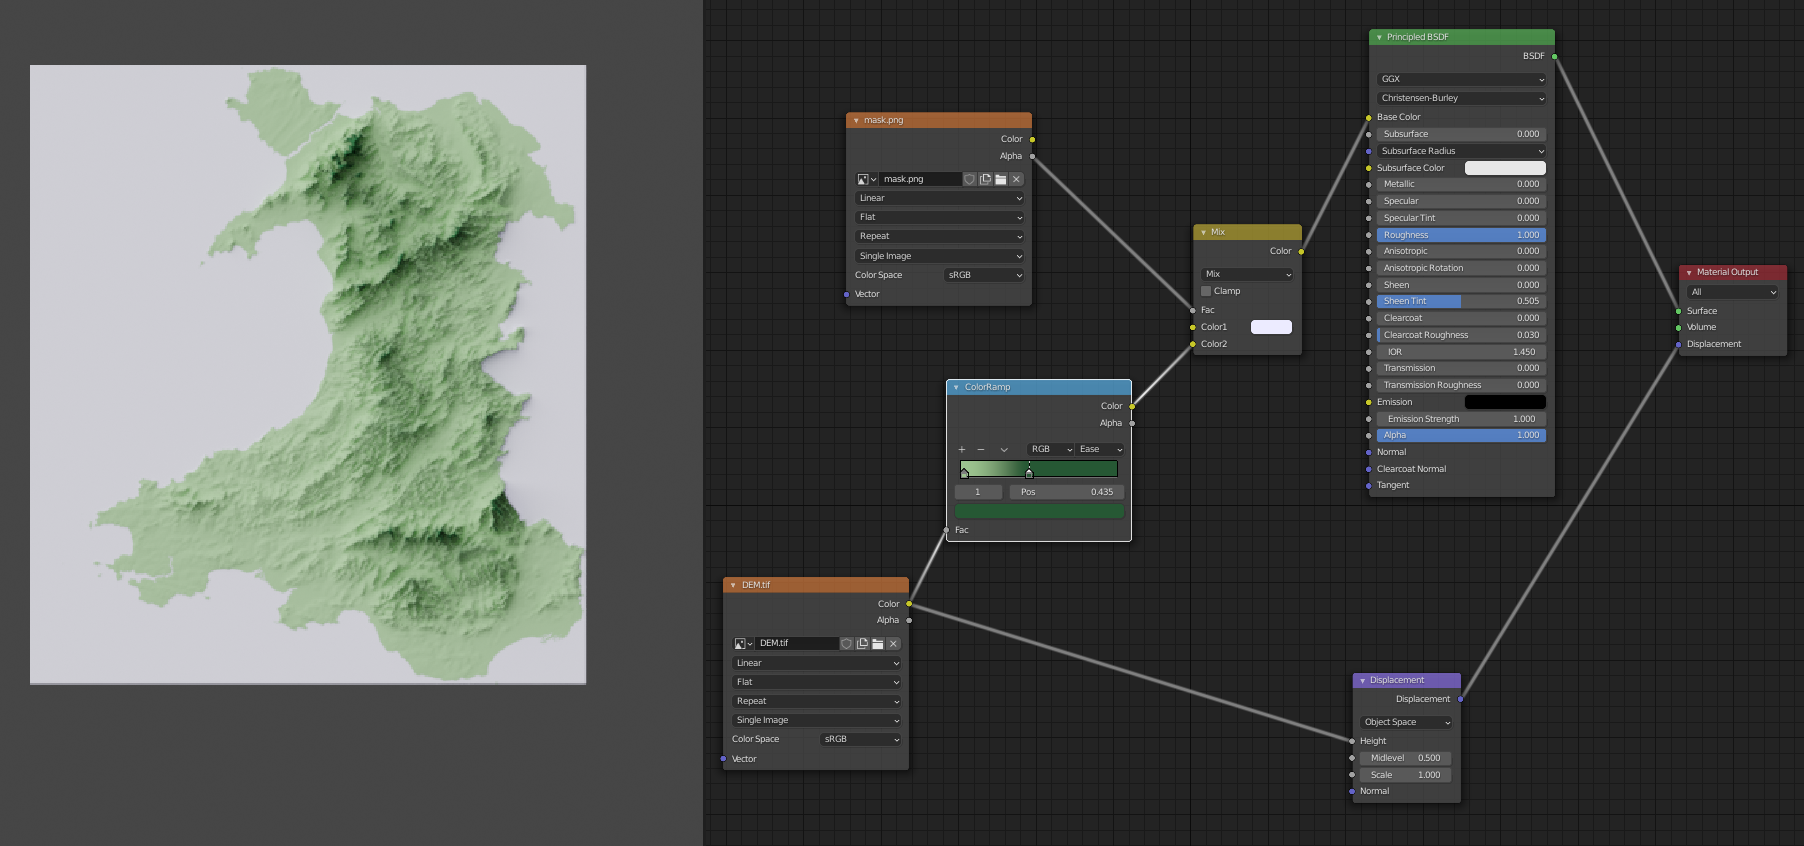
Step 4 : Use in blender to differentiate AOI from non-AOI areas. Here is an example of using a different colour input for areas inside and outside the mask:
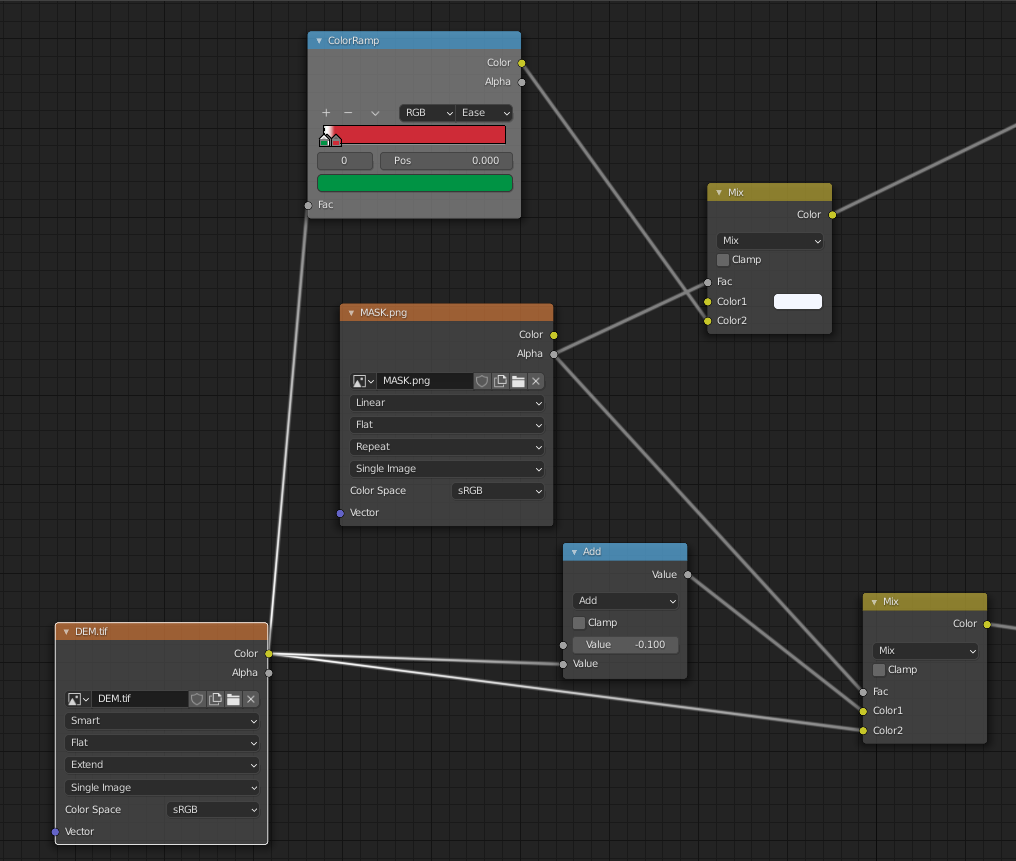
💡 Tip: you can also use this mask to artificially 'raise' your area of interest (as I did with the map of Greece). Just use a 'math' node connected to the DEM as the color1 input of a 'mix' node and color2 as the DEM, then use the mask as the Fac of the mix node. The result of this mix node is then plugged into the displacement node (see screenshot below).
End
I hope you enjoyed the tutorial and you've managed to make a cool map!
